Investigation of the α−γ−α Phase Transformation in Steel: High-Temperature In Situ EBSD Measurements
Abstract
A newly developed laser powered heating stage for commercial SEMs in combination with automated established electron backscatter diffraction (EBSD) data acquisition is presented. This novel experimental setup can be used to achieve more information about microstructure and orientation changes during grain growth, recrystallization, recovery, and phase transformations. First results on the α−γ−α phase transformation in steel within 886∘C–900∘C are presented.
1. Introduction
Most investigations into microstructure and texture evolution are limited to postmortem analysis. Due to this limitation, there is a need for experimental setups permitting the in situ observation of microstructural changes of polycrystalline materials. Besides in situ deformation, the main focus lies on the in situ observation of temperature-influenced processes like grain growth, recrystallization, recovery, and phase transformations. An example is the α-γ-α phase transformation in low-carbon steels [1–3]. The observation of this phase transformation by using the EBSD technique is limited to the low-temperature regime, since it is a reversible process and cooling down instantaneously leads to a back transformation to the low-temperature phase.
Due to this fact, a new laser powered heating stage was developed for commercial SEMs with the capacity to heat specimens up to a temperature of 1000°C. Data acquisition utilizes a combination of the well-established electron back-scatter diffraction (EBSD) technique and orientation contrast (OC) imaging. By using a combination of a heating stage with the automated EBSD technique, we achieve a powerful tool for in situ observations of microstructural changes at elevated temperatures. Previous studies on annealing and recrystallization experiments utilizing a combination of a hot stage and automated EBSD technique were limited to temperatures of about 400°C [4]. Seward et al. performed in situ SEM observations of the hcp-to-bcc-phase transformations in titanium at 900°C in a special SEM dedicated to high-temperature EBSD measurements [5].
In this study, a novel concept of a high vacuum heating stage utilizing the energy of an infrared diode laser as heating source is introduced. A great advantage of this approach is the very small size, because only the sample holder is situated inside the SEM chamber and therefore no influence on the electron beam occurs, which would lead to image drift or distortion.
2. Experimental Setup
2.1. SEM-EBSD System
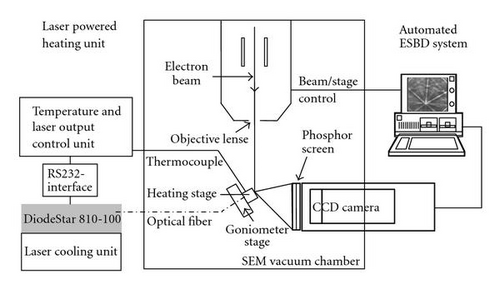
In Figure 1, the whole SEM-EBSD system for the high-temperature investigations is presented. A Jeol JSM-6100 SEM equipped with a standard eucentric goniometer stage and a scintillator-photomultiplier secondary electron-detector were used. The electron gun consists of a tungsten hairpin filament. The SEM possesses a standard EBSD detector system Nordlys by HKL with a 70° tilted specimen stage for EBSD analyses. The analog detector signal is then digitized by a NORDIF EBSP image processor supplied by the Hamamatsu Photonics company and finally processed by the software Channel 5 supplied by HKL technology. The EBSD detector contains a four-quadrant forward scatter detector mounted around the phosphor-screen, which provides the OC images for enhancement of the microstructure investigation by EBSD.
2.2. Laser-Powered Heating Stage
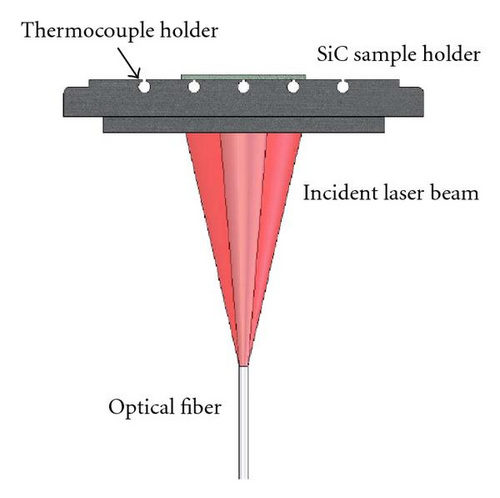
The heating stage was developed at the Institute of Physical Metallurgy and Metal Physics of RWTH, Aachen University. The general construction is shown schematically in Figures 2(a), 2(b) and contains three basic components. The main body consists of a small SiC sample holder functioning as the actual sample heater. The laser light source is a commercial diode infrared laser. It is a continuous wave laser of 810 nm wavelength and maximum power output of 100 W with a stability of ±2%. The incident infrared laser light which is emitted from an optical fiber (Figure 3) is heating the SiC sample holder only by absorption. The specimen is finally mounted onto the SiC sample holder by a tungsten clamp (Figures 2(a), 2(b)(4)).
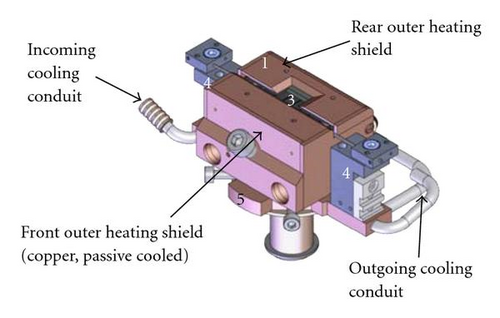
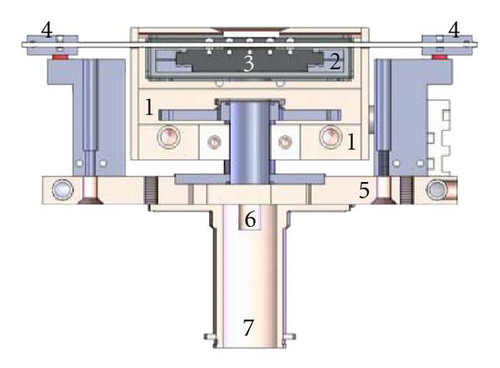
The second component is the inner heating shield (Figure 2(b)(2)) which is not cooled and made of tantalum sheets, for high-temperature stability. The final component consists of the outer heating shield (Figures 2(a), 2(b)(3)) which is made of copper. The rear part of the outer heating shield and also the copper base of the heating stage are directly cooled by an integrated water cooling circuit (Figure 2(a)).
The temperatures of various attachments (EBSD-Detector, secondary electron detector, and heating stage) in the SEM chamber are monitored by thermocouples for safety reasons. Three thermocouples are used to monitor the heating stage temperature (heating shield, sample holder) and to control the desired temperature and the heating rate. Adjustment of the laser power output proceeds by an external computer connected via an RS232 interface using Labview 8.0 (Figure 1). The heating stage can be operated at any tilting angle and working distance WD down to 15 mm.
3. Experimental Results
All experiments were conducted using the following EBSD parameters: tilting angle 70°, WD = 15 mm, accelerating voltage 20 kV, aperture size 110 μm, 6–8 bands, 0.7 μm step size, and magnification x500. The measurement of an area of 250 × 180 μm takes 45 minutes. A ferritic hot band was cold rolled down to 80% thickness reduction in reverse manner. After recrystallization, annealing the center part of the sample was investigated subsequently to metallographic preparation. The sample was heated up, respectively, cooled down in 1°C steps in the temperature range between 880°C and 920°C. The temperature was directly measured by a thermocouple placed inside the sample. The exact chemical composition of the investigated material is given in Table 1. All data were collected using beam-controlled measurements and the commercial Channel 5 software by HKL technology.
| C | Si | Mn | Al | N | Cr | V | Mo | Ti | Nb |
|---|---|---|---|---|---|---|---|---|---|
| 0.065 | 0.05 | 0.99 | 0.042 | 0.003 | 0.027 | 0.006 | 0.005 | 0.07 | 0.003 |
Figures 4(a)–4(d) shows acquired EBSD data maps of identical positions of the sample surface at four different temperatures between 897°C and 900°C for the α-γ phase transformation. The thick black lines mark the grain boundaries of misorientation angles larger than 15°, the thin black lines denote misorientations larger than 5°, and the red lines indicate Σ3-twin boundaries. The grey-shaded area corresponds to the low-temperature bcc α-phase and the colored grains are the high-temperature fcc γ-phase. The phase boundaries between the α- and γ-phases are colored in reference to the Kurdjumov-Sachs (K-S) orientation relationship [6]. Disorientations from K-S between 0° and 5° are marked with white lines, larger than 5° yellow and larger than 10° green lines. In the following, mainly a phenomenological view on the achieved data is given to demonstrate what kind of information we get from high-temperature in situ EBSD measurements.
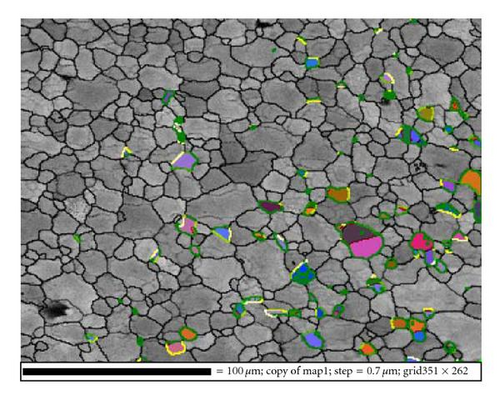
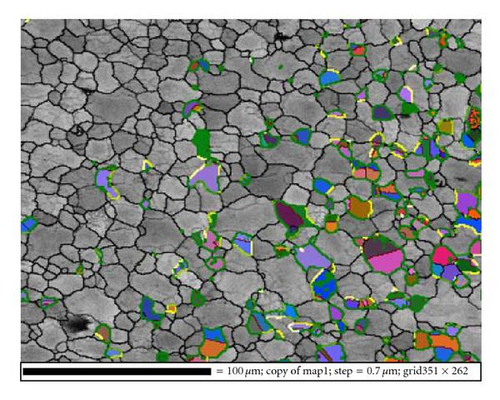
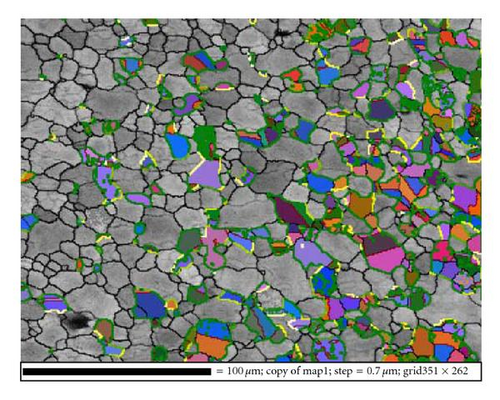
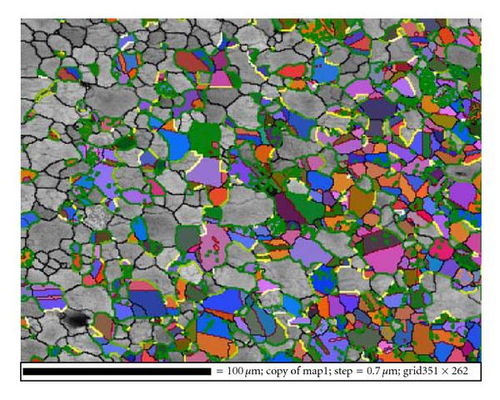
The α-γ phase transformation can be seen to start with nucleation and growth in the temperature range of 897°C (Figure 4(a)) (5% γ-phase). With increasing temperature further growth of the already formed nuclei as well as the formation of new fcc γ-nuclei occur. Besides, those new γ-grains with twin-relationships to the already formed neighboring fcc γ-grains appear. At 900°C, already 50% of the area has turned into γ-phase (Figure 4(d)). As expected from former ex situ experiments, the nucleation sites are predominantly at grain boundaries and triple junctions (Figures 4(a)–4(d)) [1, 2]. Further, it can be seen that the growth of the new γ-grains is mainly homogeneous and isotropic. Also, a grain refinement can be observed (bcc 5.3 μm, fcc 3.1 μm).
The K-S correspondence holds for the majority of the newly formed γ-grains in relation to mostly one neighboring bcc mother grain. Furthermore, the texture development of the γ-phase for different stages of transformation was investigated. The result is shown in Figure 5 using the fcc α-fiber and β-fiber. The fcc texture shows only slight changes in the range of 5 to 50% phase transformation except for the copper component on the β-fiber during the first transformation step at 897°C (5% fcc).
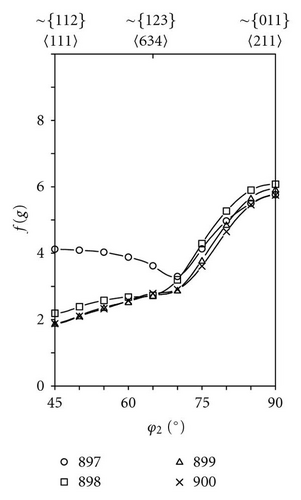
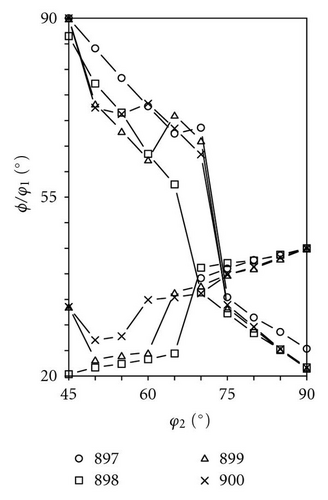
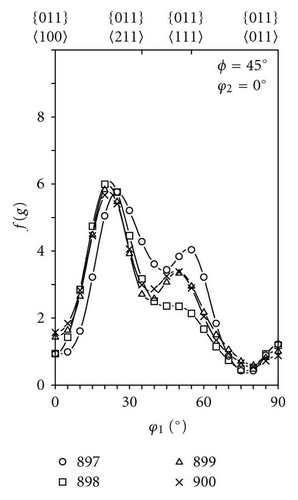
The reverse process, the γ-α-phase transformation, is shown in Figures 6(a)–6(e). The EBSD maps reflect the microstructural evolution of the surface area between 893°C and 886°C, respectively, after two complete transformation cycles. The marking of the lines is the same as in Figure 4 except for the colouring of the grains (now: fcc grains are in grey, bcc grains are colored). A complete back transformation into the low-temperature bcc-α phase was observed.
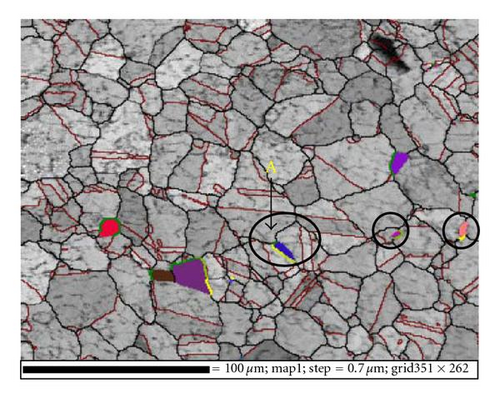
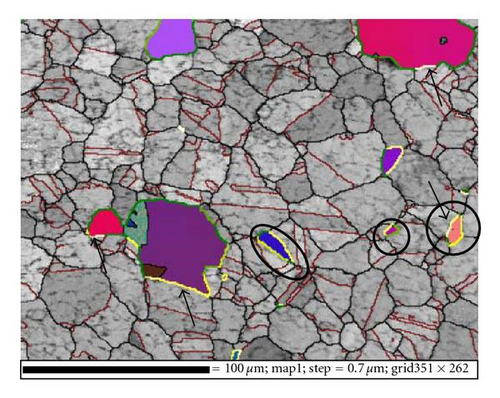
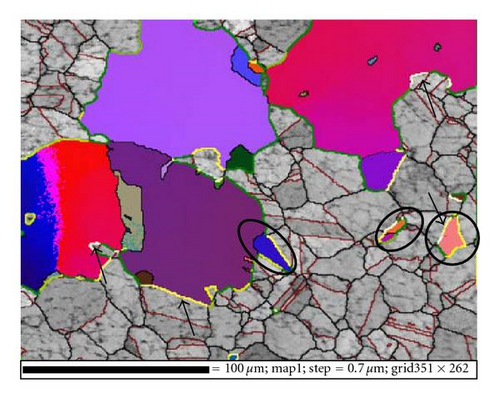
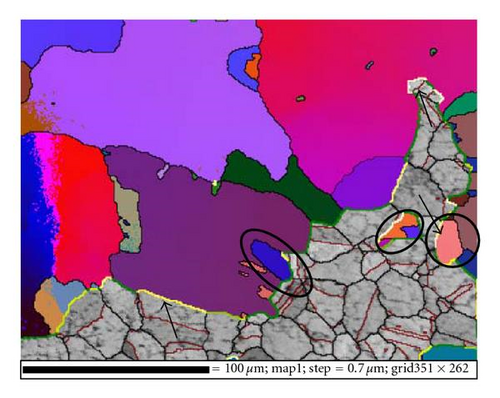
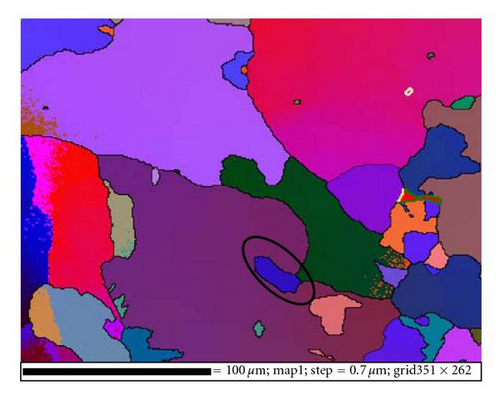
In comparison to the forward transformation, the back transformation of the newly formed α-phase occurs also by nucleation mainly at triple junctions and its growth. The γ-α phase transformation can be seen to start at the temperature of 893°C (Figure 6(a)) (1.4% α-phase) and is completed at 886°C (Figure 6(e)) (99.8% α-phase). With the decreasing temperature, further growth of the already formed nuclei as well as the formation of new α-bcc nuclei occur. but there are obvious differences to the α-γ phase transformation. The main difference is the inhomogeneous growth of the bcc grains. The white and yellow lines indicate a good K-S relationship between the two phases; at these K-S boundaries no further phase transformation was observed (see the marked lines). The marked bcc grains which show no significant growth during transformation are bordered by more K-S boundaries with less deviation from the perfect relationship. These bcc grains have a good K-S relationship with two or three of the surrounding fcc grains, and no further growth of such grains takes place. In contrast to the α-γ phase transformation no grain refinement occurred, rather during the γ-α phase transformation a grain coarsening (fcc 9.3 μm, bcc 24.2 μm) was observed.
No textures for the γ-α phase transformation could be calculated due to the poor grain statistics.
4. Discussion
An important aspect of the α-γ-α phase transformation in steel is the texture development and the occurrence of variant selection [3, 7, 9]. Variant selection means that during the phase transformation not all possible crystallographic variants are equally selected, for example, among the 24 variants of the K-S relationship. The α-γ-α phase transformation proceeds by nucleation and growth. It is, therefore, of particular interest which stage determines the final texture and when and how variant selection occurs.
The results of the high-temperature in situ EBSD measurements for the α-γ phase transformation demonstrate that the nucleation of the newly formed phase occurs mainly at triple junctions. Also, a good K-S correspondence in relation to mostly one neighboring bcc mother grain was found for the majority of the newly formed γ-grains. The fcc texture changes only slightly with progressing phase transformation for a transformation fraction of 5 to 50% except for the copper component on the β-fiber during the first transformation step at 897°C (5% fcc). The observed deviation of the fcc texture at low transformed volume fraction (5% fcc) is likely due to insufficient statistics because in this case only 123 grains could be investigated. Otherwise, the results show that the fcc transformation texture does not significantly change with progressing transformation. From this result we can conclude that the developed austenite texture is essentially determined by nucleation, that is, variant selection takes place at the nucleation stage.
During the γ-α phase transformation, the nucleation occurs also mainly at triple junctions and large ferrite grains develop. In contrast to the α-γ phase transformation, several ferrite grains exhibit a good K-S relationship not only to one but two or three of the surrounding austenite grains, and virtually no growth of such grains takes place. Therefore, the microstructure during the γ-α phase transformation consists of small bcc grains surrounded by K-S boundaries and large bcc grains with less K-S boundaries. Some of the small bcc grains develop an elongated shape during the γ-α phase transformation. This can be attributed to the fact that the phase transformation to ferrite is only feasible in a direction free of K-S boundaries (see Grain A).
This effect of the K-S phase boundaries during the γ-α phase transformation was noticed also for the α-γ phase transformation, but was not as obvious as during the back transformation. This is associated with faster growth kinetics of the bcc grains during back transformation, by which the difference between the K-S and non-K-S phase boundaries becomes more pronounced and which also leads to a coarsening of the ferrite grains. Because of the poor grain statistics no bcc texture could be calculated for the γ-α phase transformation.
The circumstance that an fcc grain has mostly one mother grain (good K-S matching) and a newly nucleated bcc grain, very often more than one K-S neighbor, can be associated with the so-called texture memory effect and the nucleation rate. From previous investigations it is known that a texture memory effect occurs during the α-γ-α phase transformation cycle [3, 7–9]. This means that the bcc textures prior and subsequent to this transformation are comparable, apparently because a bcc grain transformed into an fcc grain by using one specific out of 24 K-S variants. During back transformation of the fcc grain, the same variant seems to be preferred which leads to the same bcc orientation as prior to transformation. If we assume that the nucleation rate during the γ-α phase transformation is smaller than the α-γ phase transformation, the following (extreme) case is possible. A bcc grain possesses three fcc grains with a good K-S relationship during the α-γ phase transformation. During back transformation at one of these three fcc grains which possibly share a triple junction, a new bcc grain nucleates with the same variant as before. If this bcc grain nucleates inside the triple junction, it will be surrounded only by K-S boundaries. In case of a small nucleation rate for the γ-α phase transformation, this bcc grain will be “isolated” in a subsequent transformation cycle, and the new fcc grains which nucleate with a K-S relationship at this bcc grain will have a K-S boundary only to this grain.
5. Summary
A new laser-induced heating stage for commercial SEMs is introduced with the capacity to heat specimens to a temperature of 1000°C whilst acquiring microstructural and crystallographic data by means of the EBSD technique. The in situ investigations into the high-temperature α-γ-α phase transformation in a microalloyed low-carbon steel demonstrate the excellent performance of this laser powered heating stage and its potential for other high-temperature applications. The following first results are presented.
- (i)
Nucleation was observed mainly at triple junctions.
- (ii)
The austenite texture is determined by nucleation.
- (iii)
The microstructure development during the γ-α phase transformation is inhomogeneous.
- (iv)
The growth kinetics during the γ-α phase transformation is faster than the α-γ transformation.
- (v)
The mobility of the transformation front depends on its proximity to a K-S relationship.
Acknowledgment
The authors would like to thank the Deutsche Forschungsgemeinschaft for financial support for the research project “Investigation of variant selection during α-γ-α phase transformation in steel by using high temperature in situ EBSD in a high-resolution SEM” (Go 335/33-1).


