Time-Resolved 2PPE and Time-Resolved PEEM as a Probe of LSP′s in Silver Nanoparticles
Abstract
The time-resolved two-photon photoemission technique (TR-2PPE) has been applied to study static and dynamic properties of localized surface plasmons (LSP) in silver nanoparticles. Laterally, integrated measurements show the difference between LSP excitation and nonresonant single electron-hole pair creation. Studies below the optical diffraction limit were performed with the detection method of time-resolved photoemission electron microscopy (TR-PEEM). This microscopy technique with a resolution down to 40 nm enables a systematic study of retardation effects across single nanoparticles. In addition, as will be shown in this paper, it is a highly sensitive sensor for coupling effects between nanoparticles.
1. Introduction
The interaction of light with metal nanoparticles has attracted considerable attention for many centuries. One of the most impressive examples of their magic colourful properties is the artistic adoption of the light scattering and absorption by small noble metal particles in the church windows of Marc Chagall. In modern science, the optical properties of nanostructures have raised to a topic of high interest for fundamental physics as well as for technical applications. Silver and gold nanoparticles with typical sizes of 5 nm to 150 nm can exhibit particularly strong optical extinction in the visible spectral range due to resonantly driven electron plasma oscillations, termed as localized surface plasmons (LSP). The resonance energy of the LSP depends critically on the size and the shape as well as on the material of particle and embedding environment [1–3]. This enables spectral tuning of the resonance, an ability which is of considerable interest in the context of future electronic and optical device applications. Due to the rapid advances in the fabrication of small particles [4] and nanowires [5], their optical properties are now used in a wide range of applications, including biosensors [6, 7], near field microscopy [8], and new optical devices [9–11]. Furthermore, since plasmons are associated with large electromagnetic fields near the particle surface, they play an important role in surface-enhanced Raman scattering (SERS) [12], second harmonic generation [13, 14], and multiphoton photoemission [15–19]. The limiting factor for applications is the energy loss of the collective electron oscillation due to the damping of the LSP, which is manifested in the plasmon decay time τp1 [20].
The fundamental microscopic mechanisms of collective electron excitations in small particles as well as their decay are still far from being completely understood. As a pioneer in this field, Gustav Mie developed a first theory based on Maxwell’s equations to explain the optical properties of spherical nanoparticles. Mie’s theory easily describes red shifts and the lifetime broadening of the dipole plasmon resonance as the particle size is increased. It also explains the appearance of resonance contributions of higher multipolar order [1]. However, this theory is strictly valid only for single particles with a spherical geometry. Therefore, during the last decades, lots of theoretical studies focused on the properties of LSP in nanostructures of different shapes in order to gain insight, for example, into their optical response, the field distribution of the resonant modes as well as relevant decay channels, and the coupling between neighbouring particles [21–23].
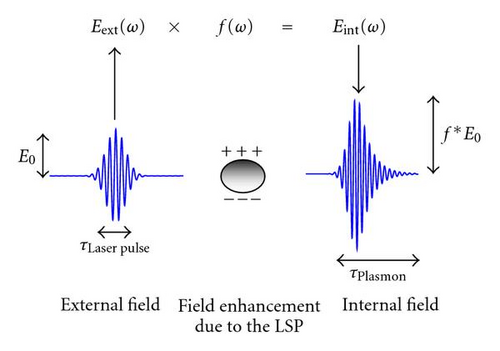
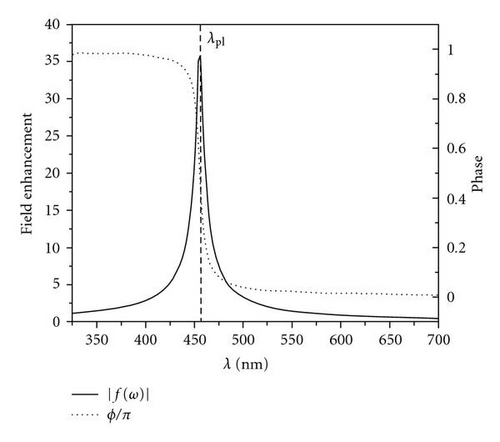
A simple oscillator model describing the interaction of a light field and a nanoparticle can be discussed as follows [24]. The light field couples occupied and unoccupied single electron states which are separated by the photon energy hυ. The induced polarizations of these different, coherently coupled transitions superpose to a macroscopic polarization which represents the collective response of the electronic system. This induced polarization field adds to the incident light field and causes a modification of the particle internal field (Figure 1). The relation between internal field and light field is described by the frequency-dependent field enhancement factor f(ω) [15]. Figure 2 displays the phase shift ϕ(ω) of the induced polarization field with respect to the light field and the amplitude of the field enhancement factor f(ω). For frequencies below the evident resonance peak, the internal field is small because the π-shifted polarization field adds destructively to the light field. While passing the resonance frequency, the polarization response undergoes a phase shift by π. The extraordinary field enhancement at λp1 (corresponding to the LSP resonance) is determined by the resonant response of the electron collective to the light field adding up to an extremely large polarization field. Finally, in the short wavelength regime, the amplitude of the polarization field decreases as now the electron collective is too inert to follow the oscillating light field.
The damping of the plasmon excitation is basically governed by two different decay channels (see Figure 3). First, the plasmon energy can be returned coherently to the external radiation field (radiation damping), as the oscillating polarization field must emit electromagnetic radiation. Within the optical far field theory, this decay channel corresponds to the elastic scattering of the incident exciting light. The signals exploited by pure optical far field detection techniques, such as second harmonic generation [13, 14] and extinction spectroscopy [25], are due to the coupling to this radiation damping channel.
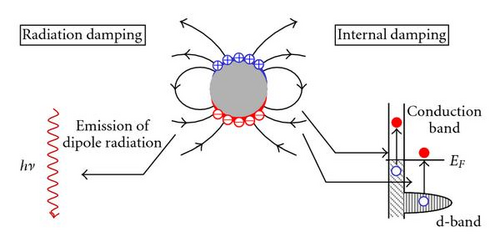
Furthermore, the decay of a plasmon is possible by the creation of electron-hole pairs and a subsequent transfer of energy to the internal degrees of freedom inside the particles (internal damping). This process results in a complete loss of coherence to the exciting light field. In the far field, this damping channel is recognized as absorption. The involvement of single electron excitations in this process suggests that also electron emission techniques such as photoemission may be useful as probes for plasmonic properties. In this paper, we demonstrate that particularly two-photon photoemission (2PPE) is highly sensitive to plasmon excitations in metallic nanoparticles. A striking example is the study of particle shape characteristics of the plasmon damping in elliptical nanoparticles as probed by means of the time-resolved 2PPE. Furthermore, we show that 2PPE in combination with the photoemission electron microscopy technique (PEEM) allows to map local near field variations associated with plasmonic excitations with subdiffraction (<40 nm) resolution. In contrast to Cinchetti et al. [27] who first investigated LSP excitation in special moon-like tapered silver nanoparticles (around 400 nm) on silicon, we concentrate on arrays of smaller particles of different shape. Observed effects that will be discussed are the field retardation in large nanoparticles and the plasmon-governed coupling of neighbouring nanoparticles.
2. Experimental
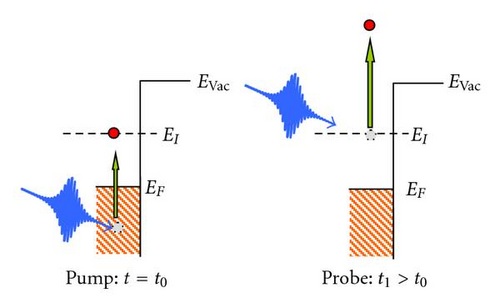
Figure 4 shows the basic scheme of the time-resolved two-photon photoemission technique applied to a metal surface [28]. A first ultrashort laser pulse (pump) in interaction with the electronic subsystem at a given time t0 populates an intermediate excited electron state EI below the vacuum level. A second laser pulse (probe) incident at the time t1 couples this excited state population to a detection state above the vacuum level, where it is addressed by an electron-sensitive detector such as an electron energy analyzer or a photoemission electron microscope. A successive and controlled increment of the time delay between both pulses enable to record the time-evolution of the depopulation of the intermediate state. For the electron gas of a metal, the depopulation is governed by inelastic electron-electron scattering processes and is characterized by the inelastic lifetime τee.
A typical experimental time-resolved 2PPE trace as a function of the time delay between cross-polarized pump and probe pulses is shown in Figure 5. The shape of this cross-correlation trace is a convolution of the two laser pulses and the exponential decay of the probed intermediate state EI determined by the inelastic lifetime τee. A deconvolution of τee can be performed by a fit of simulated correlation traces to this data set. For bulk electron excitations, these simulations are performed within a rate equation model which corresponds to the solution of the Liouville-von Neumann equations of a three level system within the density matrix formalism in the limit of rapid dephasing [29–31]. For qualitative statements on τee and for comparing studies, it is, however, often sufficient to analyse the broadening (Δ FWHM) of the cross-correlation trace, which increases linearly with the life times of the intermediate state τee (Δ FWHM ≈a*τee; a ~ 1.13).
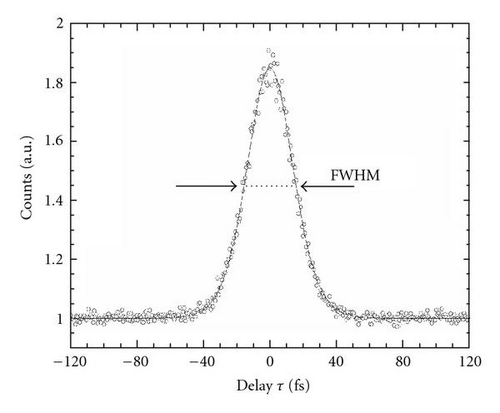
So far, only single electron states have been considered for the description of the 2PPE process. In the following, we will discuss to what extent the 2PPE process is also sensitive to the collective electron excitations in nanoparticles (LSP).
2PPE is a second-order process and, therefore, the measured electron yield is proportional to the fourth power of the electric field () acting on the electrons. In the case of plasmon resonant excitation of a nanosized particle, this (particle internal) field is determined by the local field enhancement f(ω) as governed by the properties of the LSP. It is this relation which makes the two-photon photoemission a versatile tool in the investigation of plasmonic excitations. Later, we will see that besides a high field enhancement, an efficient transfer of energy from the LSP resonance to the single electron excitation spectrum is a necessary condition to generate a high-photoemission signal.
The participation of the plasmon excitation in the 2PPE process has also direct consequences for the shape of the cross-correlation trace obtained from the time-resolved experiments. Next to τee, the inelastic lifetime of single electron excitation, also the LSP-lifetime τLSP has to be considered for a correct deconvolution. A correct quantitative deconvolution of these two quantities from the cross-correlation trace is a rather complex task as has been shown, for instance, in reference [24]. However, as we will see in the following, a clever use of the different experimental degrees of freedom will already enable interesting qualitative statements about LSP and single electron dynamics, again by considering the FWHM of the cross-correlation only.
The setup of the time-resolved 2PPE experiments used for our studies is shown in Figure 6. Pump and probe laser pulses are delivered from the frequency-doubled output (photon energy of 3.1 eV) of a femtosecond Ti: Sapphire laser system (repetition frequency 80 MHz, temporal pulse width 20 femtoseconds). A Mach-Zehnder interferometer allows to adjust the difference in optical pathway between pump and probe pulse with an accuracy of better than 100 nm corresponding to a timing accuracy of <0.3 femtosecond. The collinear pulse pair is then focussed onto the sample surface and excites the electrons in a 2PPE process which are subsequently detected by a suitable detection unit.
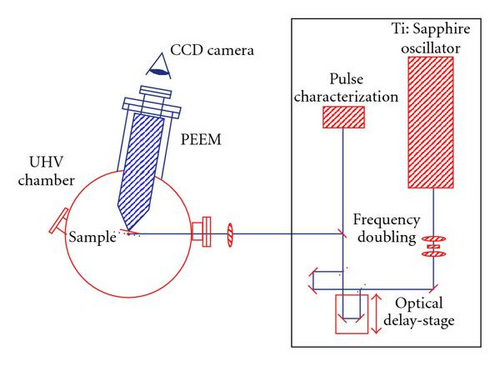
For our studies, two different types of electron detectors have been used. Spectroscopic measurements have been performed with a cylindrical sector electron energy analyzer (Focus CSA 200) with an energy resolution of better than 100 meV. For the plasmonic systems under consideration, it enables us to investigate the energy dependence of electron-hole pair excitation subsequent to a LSP decay. However, this detector does not provide any spatial resolution.
The second detector used for our studies is an electrostatic photoemission electron microscope (Focus IS-PEEM), which is described in detail elsewhere [32, 33]. The lateral resolution of this instrument is better than 40 nm and enables us to focus even on a single nanoparticle. For this experiment, a mercury vapour UV source (high energy cutoff 4.9 eV) is available in addition to the femtosecond laser. It allows imaging of the surface by linear photoemission near the work function threshold which is located at about 4.5 eV photon energy for silver.
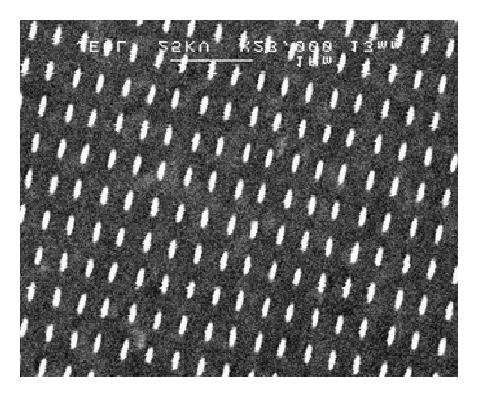
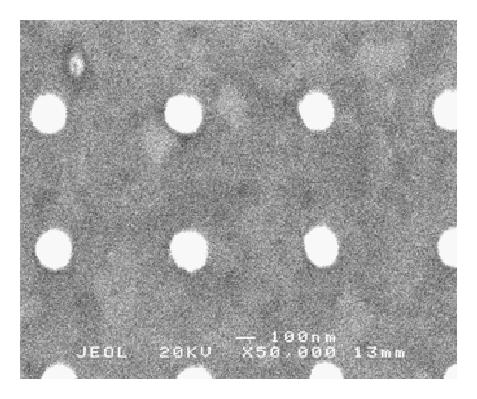
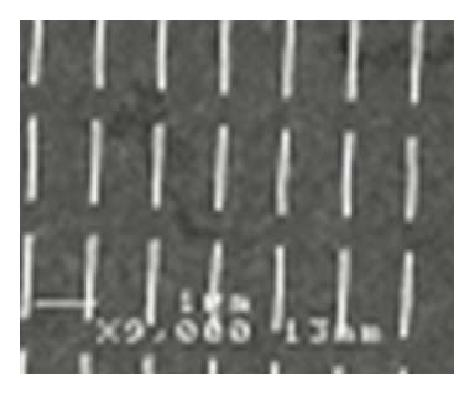
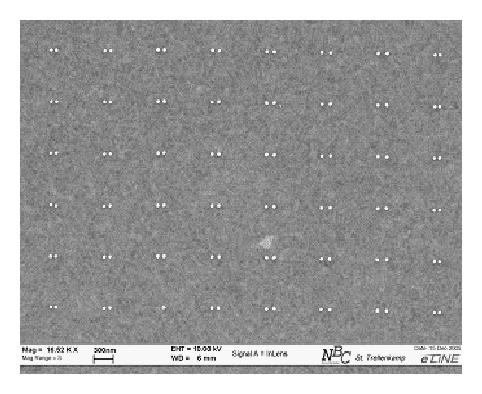
The investigated samples have been prepared by electron beam lithography in a lift-off process. This technique enables a controlled and flexible design of metal nanoparticles. The shape and size of the particles used in our studies were tuned such that their LSP resonance frequencies match the experimental setup conditions of the laser system. Figure 7 shows SEM images of the different silver nanostructures deposited on ITO-covered glass substrates as they are used in this study. The dimensions of the elliptical-shaped silver nanoparticles in Figure 7(a) are 140 nm (long axis), 60 nm (short axis), and 50 nm (height). They constitute a versatile sample for the investigation of the dependence of the LSP lifetime in respect to resonant or off-resonant excitation. The silver nanodot array (Figure 7(b) diameter: 200 nm, height: 50 nm) as well as the silver nanowire array (Figure 7(c) length: 1.6 μm, width: 60 nm, and height: 50 nm) will be used in the time-resolved PEEM experiments to map retardation effects associated with a plasmon excitation at a nanometer resolution. Studies of the plasmon-induced particle-particle coupling are possible with nanodot pairs of varying centre-to-centre spacing. Figure 7(d) shows an example of 50 nm dimers (height: 40 nm) at an interparticle spacing of 130 nm (grating constant: 740 nm).
3. Results and Discussion
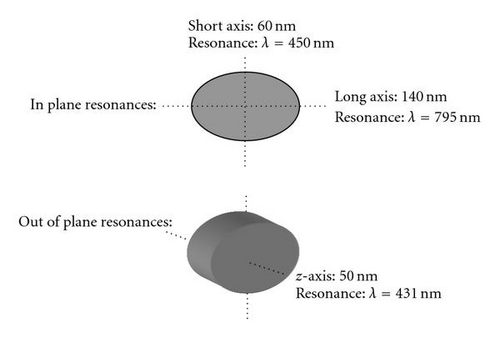
Figure 8 shows measured (black line) and calculated extinction spectra of the array of elliptically-shaped silver nanoparticles (Figure 7(a)). The experiments were performed at normal light incidence using unpolarized light. The calculations are based on a numerical model described in [34]. We identify three different resonances at 431 nm, 450 nm, and 795 nm corresponding to plasmon excitations along the z-axis, the in-plane short axis, and the in-plane long axis, respectively (see Figure 8 for details). However, the experimental configuration (perpendicular light incidence) allows a coupling to the in-plane resonances, only. The resonance energies of these two modes are almost perfectly reproduced by the calculations, whereas the broadening of the resonances is somewhat underestimated. This indicates the presence of damping mechanisms in the nanoparticles which are not taken into account in the simulation, for example, the interaction between particle and substrate and an enhanced internal damping due to a finite defect density in the particle itself [16].
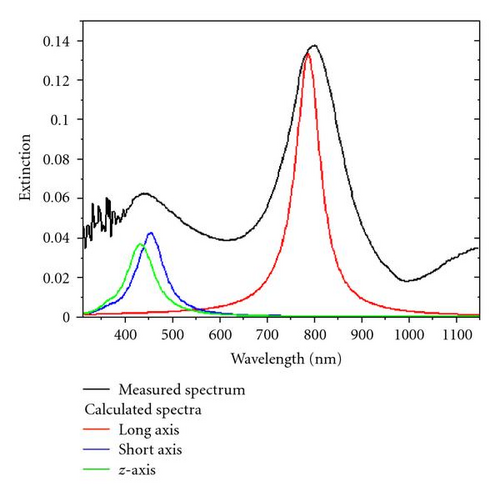
The 400 nm laser-light used for the TR-2PPE experiment couples almost resonantly to the in-plane short-axis mode of the particle. In contrast, far off-resonant conditions are given for the case of an excitation of the long-axis mode. At perpendicular incidence of the laser light, a rotation of the polarization vector of the light enables to switch between this resonant and off-resonant excitation conditions. An off-resonant excitation is possible for a polarization vector (electric field) oriented along the long axis since the resonance is at 795 nm, resonant excitation is possible for an orientation along the in-plane short axis.
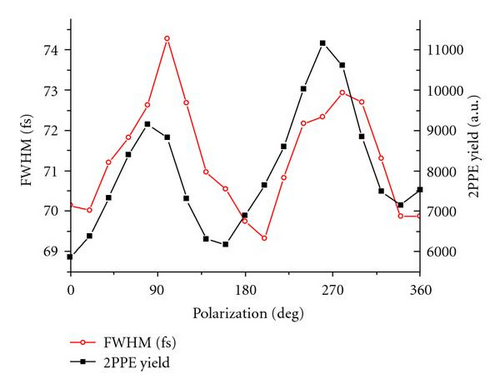
The difference between off-resonant and resonant excitation becomes evident from the polarization dependence of the photoemission current which is a sensitive probe of the field enhancement as discussed above. The black line in Figure 9 shows the measured 2PPE yield as a function of the polarization angle of the incident laser light. We observe a clear variation in the yield, where the yield maxima and minima correspond to orientations of the electric field vector along the short and long axis, respectively. The same periodicity is observed if time-resolved 2PPE data are considered. The red line in Figure 9 displays the variation of the FWHM of the cross-correlation traces as obtained from sech2 fits as function of polarization angle. As discussed above, differences in the FWHM of the correlation trace are an indirect measure for the lifetime of the LSP. For resonant (short-axis) excitation, we measure a maximum in the LSP lifetime, for complete off-resonant excitation, the LSP lifetime is minimum. Interestingly, the variations of yield and FWHM with polarization angle show a fixed phase shift of about 30°. This observation indicates that the excitation conditions resulting in the highest photoemission yield do not coincide with conditions resulting in the maximum LSP lifetimes. The reason for this unexpected mismatch is not clear, yet.
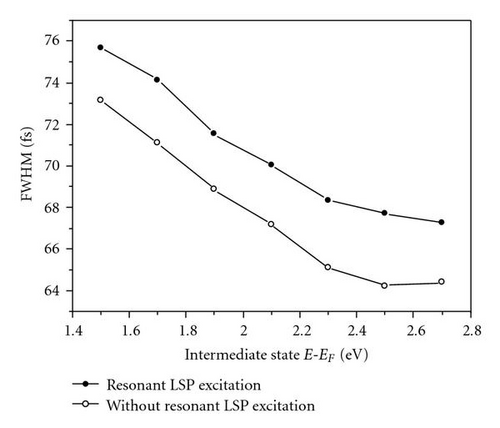
TR-2PPE experiments at varying intermediate state energies E-EF of the single electron excitations allow to highlight the different origins of τee and τLSP. For metals, τee exhibits a characteristic energy dependence as has been shown in the past in several theoretical and experimental works [24, 35–37]. As an example, Figure 10(b) shows lifetime results obtained in the TR-2PPE of single electron excitations in a polycrystalline silver sample. τee increases monotonously as the intermediate state energy decreases. In contrast, the lifetime of the plasmon τLSP should be independent of (E-EF). Figure 10(a) shows the FWHM of the cross-correlation curves at varying intermediate state energies (E-EF) measured for the elliptical nanoparticles under resonant and off-resonant conditions. Both curves exhibit an energy dependence characteristic for the single electron decay τee in silver. At the same time, the resonant and off-resonant curves keep a constant displacement along the abscissa (time axis) representing the energy-independent broadening caused by the LSP decay. The offset is about 3 femtoseconds and is of the same order of magnitude as the plasmon decay time determined from line width analysis of the optical extinction spectrum (1/Γ ≈ 2 femtoseconds).

In order to study local variations in the electron dynamics on nanometer scales, a technique capable of a high lateral resolution is required, such as photoemission electron microscopy. In combining the high temporal resolution of the time-resolved 2PPE technique and the high lateral resolution of the PEEM, we succeeded to map local variations in the LSP dynamics even within a single nanoparticle. Figures 11(a) and 11(b) show PEEM images of a 2D array of silver nanodots (diameter: 200 nm, height: 50 nm, and grating constant: 650 nm) recorded with a mercury vapour lamp in 1PPE and the second harmonic of the laser in 2PPE, respectively.
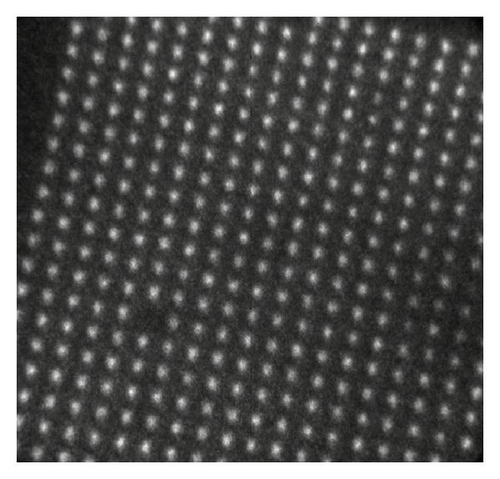
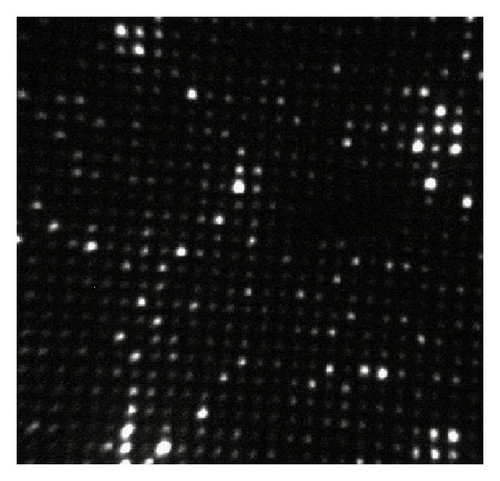
The homogeneous response of the nanoparticle array to the UV excitation as visible in Figure 11(a) is a clear evidence for the accurate lithography process. In contrast, the 2P-PEEM image (Figure 11(b)) exhibits a distinct brightness variation among the particles pointing in the first instance to considerable variations in the LSP excitation conditions. However, a detailed analysis of the data and the comparison of images taken at different excitation wavelengths show that these inhomogeneities are caused by the internal defect structure of the different particles rather then differences in the collective electron response [16]. For further information about the fundamental behaviour of the LSP, we plan to perform energy resolved measurements as, for example, done by Cinchetti et al. by combining the time of flight technique with PEEM [38].
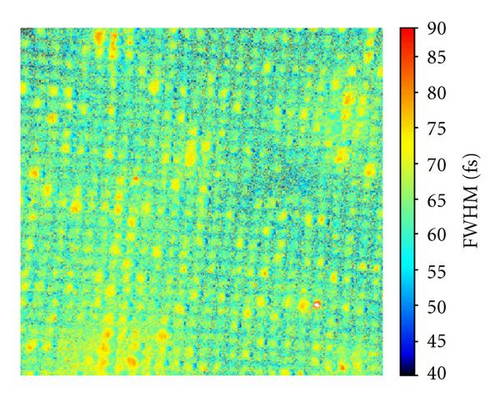
Figure 11(c) shows the result from a time-resolved PEEM scan of the identical area of the sample. In this depiction, the colour-coded FWHM-value of the cross-correlation trace of every image pixel is plotted as a measure for the local femtosecond dynamics. This lifetime map allows in an intuitive way for the identification of local variations in the ultrafast response between the particles as well as within a single particle itself. The quantitative analysis of a selected particle out of the array is displayed in Figure 12.
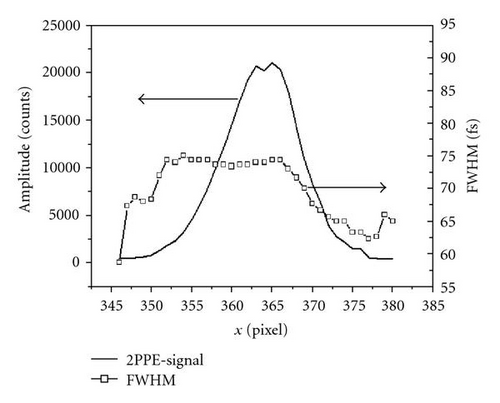
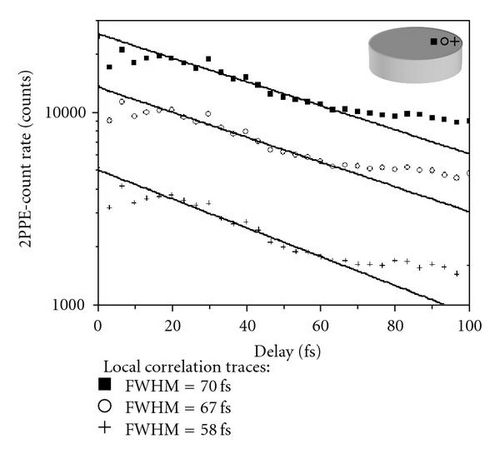
The open squares correspond to the measured FWHM of the TR-2PPE correlation curve along a section through the centre of the particle. As a guide to the eye, the corresponding 2PPE yield is plotted, roughly reproducing the particle profile. Surprisingly, FWHM-trace and profile do not match each other; the FWHM-trace is shifted to the left in respect to the 2PPE yield trace. It seems as if the LSP lifetime varies considerably across the particle. This view is confirmed by the data plotted in Figure 12(b). Here, sections of three cross-correlation traces from the particle are displayed together with an exponential fit on a logarithmic scale. For reference, the corresponding locations within the particle are shown in the inset. Quantitatively, we find in this area a systematic local variation in the ultrafast electron dynamics of more than 10 femtoseconds. This observation is against the intuition that the LSP as a collective excitation of the electron gas is a global and characteristic property of the entire nanoparticle. In locally probing, the LSP excitation with the external field, however, we create a situation of laterally varying interference conditions between external an internal fields, quite similar to the explanation given by Meyer zu Heringdorf et al. [39] for the observation of stationary emission maxima along self-assembled nanowires. In their study, they image silver wires of varying length by 2PPE induced by the second harmonic of a Ti : Sa oscillator in PEEM using a setup very similar to our experiment. In the PEEM images, emission maxima occur along the wire whose positions do not change with wire length. The authors explain the occurrence as well as the position of the emission maxima by taking into account interference between a surface plasmon wave inside the wire with the external light field which is incident at an oblique angle of 74° with respect to the surface normal. Since the surface plasmon wave inside the wire propagates at a lower velocity than the light field, the phase between the two fields changes along the wire, forming a stationary beating pattern of alternating constructive and destructive interference. In our case, the situation is similar to that extent that we observe photoemission from local fields which result from the superposition of the external light field and the polarization field within the nanoparticle. Since the particles are much smaller than the wires discussed above, we do not see a considerable variation in the photoemission yield, since the second emission maximum occurs only about 2.5 μm away, which is already far outside the particle. What we do observe, however, are traces of a locally varying phase between light and plasmon fields. At very high temporal resolution, one finds a lateral variation of the fringe patterns in phase-resolved 2PPE correlation traces which clearly show the varying phase difference between the two fields across the particle [17]. The data presented here was collected with a less elaborate setup which is not capable of resolving the fringe patterns. However, the overall shape of the phase-averaged correlation traces is influenced by the varying phase between light and plasmon field and changes systematically across the particle, which in turn results in a systematic variation of the best-fit sech2 FWHM parameter. The colour-coded display of the FWHM in the rightmost image of Figure 11 shows that it is indeed a systematic effect, since each of the imaged nanoparticles shows a distinct red-blue contrast from left to right. To put it differently, what we observe here is a result of electromagnetic retardation. Since the particles are not far smaller than the wavelength of the exciting light (in fact, they are about half a wavelength wide), not every position inside the particle is excited with the same phase.
Such retardation effects are expected to be even more pronounced for structures elongated along the direction of incidence of the laser light, as was already shown in the abovementioned study by Meyer zu Heringdorf. [39]. Figure 13 shows 1P-PEEM and a 2P-PEEM images and a corresponding lifetime map of the nanowire array introduced in Figure 13(c).
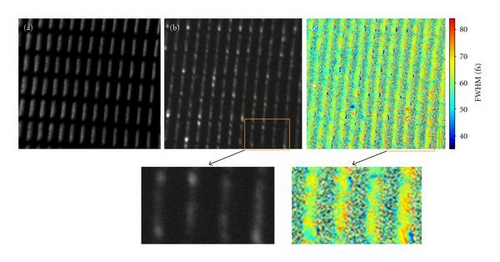
The nanowires as mapped in the 1P-PEEM image show clear internal intensity variations indicating a structural inhomogeneity of the nanowires. Also, the 2PPE image shows distinct brightness variations along the wires. Note that for the 2PPE measurements, the nanowires have been aligned perpendicular to the direction of incidence of the exciting light. Strikingly, the endings of the wires always exhibit the highest photoemission yield. In addition, most of the wires show three further emission maxima. Local variations are also reproduced by the lifetime map of the nanowire array (Figure 13(c)). The FWHMs of the cross-correlation traces vary along the wire on a scale of about 100 nm, a value which corresponds roughly to the width of the wires. Perpendicular to the long wire axis, the FWHM variations are very similar to those observed for the nanodot array in Figure 11. We conclude that the present sample does not actually consist of homogeneous nanowires. Instead, during the preparation process, the wires obviously decomposed into conglomerates of small silver particles. The brightness variations originate from LSP excitations in the individual small islands as well as variations in the defect density along the wire. This result is in good agreement with the findings in Kubo et al. [40] and Chelaru et al. [41]. In this context, the observed FWHM characteristics can be interpreted in terms of the model introduced before. These findings are corroborated by SNOM measurements of Ditlbacher et al. [42], who could show that propagating modes leading to standing waves patterns are only supported in single crystalline nanowires.
Finally, we would like to discuss the coherent coupling of LSP modes excited in two neighbouring particles by the same external laser field. The local interference conditions determining this coupling depend on the relative phase of the contributing LSP fields and, hence, on the interparticle distance and the angle of light incidence. Here, we investigate how secondary fields from neighbouring particles in an array of particle dimers modulate the local 2PPE signal. Figure 14 shows 1P-PEEM (Figure 14(a)) and 2P-PEEM (Figure 14(b)) images of silver particle pairs (diameter: 50 nm, height: 40 nm, and grating constant: 740 nm) with a centre-to-centre distance of 130 nm. The 2PPE data were collected under resonance conditions with respect to the particle LSP at a photon energy of 3.1 eV (400 nm, p-polarized light along the dimer axis).
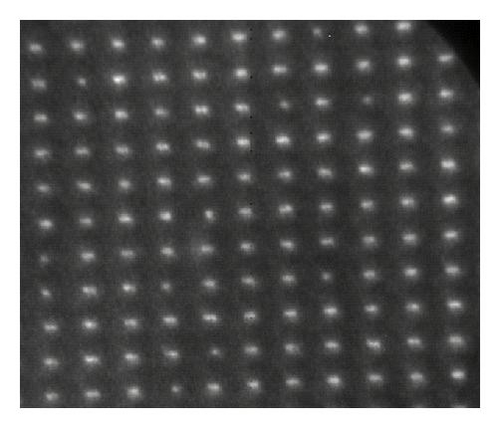
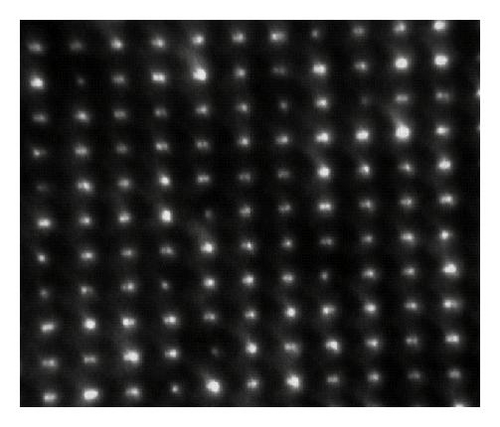
In the 1P-PEEM image, the individual particles are clearly resolved. For the 2P-PEEM image, we observe again a random local variation of the photoemission signal as observed before for the nanodot sample. We assign these inhomogeneities to particle variations in the defect density (Figure 11(b)). To be still able to deduce the systematic local variations arising from the particle-particle coupling, we performed a statistical analysis of the photoemission yield from the particle dimers. The average brightness values in a 7 × 7 pixel region of interest centred on the left and on the right particle within each pair is extracted from the image. In a further step, we calculate the relative count rate difference between left and right particle . Figure 15(a) shows the frequency distribution of ΔIrel as of the sample area.
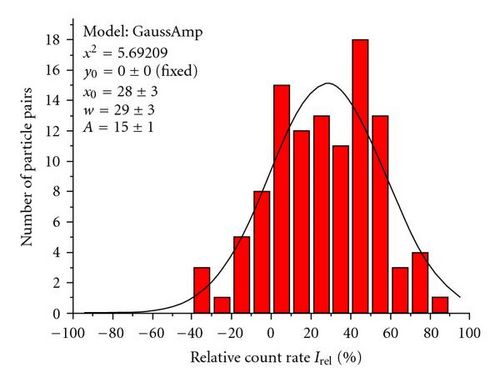
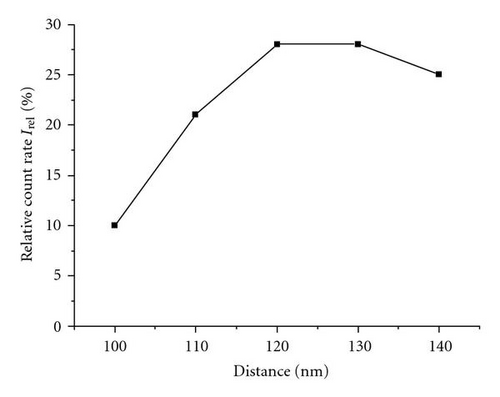
A positive value of ΔIrel corresponds to the situation that the right particle is brighter than the left particle. The histogram gives evidence that in average, the right particle which is located towards the direction of light incidence shows a 28% yield enhancement in comparison to the left particle. Calculations based on a dipole model can qualitatively reproduce this observation. Further, measurements have been conducted for particle dimers at varying intrapair distances between 100 nm and 140 nm (Figure 15). For all particle pairs, we observe an asymmetry in the photoemission yield exhibiting a positive ΔI value. However, as function of the particle distance, we also observe a monotonous variation in ΔI with a local flat maximum at about 120 nm. In general, for excitation at a fixed wavelength (λ = 400 nm), a periodic distance dependence is expected, since the conditions for constructive and destructive interference of the particle fields at the location of the right particle will change alternately with increasing distance. The periodicity should be of the order of the wavelength. At sufficient large distances, the differences in the particle yields should disappear due to the decrease of the particle field strength with distance. The experimental data shown in Figure 15(b) display a section out of the periodic coupling modulation close to an oscillation maximum. It is noteworthy that this coupling effect could be mapped on the basis of a statistical analysis of the particle array. This approach delivers obviously very reproducible and significant results, even though the photoemission signal is considerably blurred by sample inhomogeneities. The 2PPE yield analysis gives direct evidence for the dipole-induced coupling between neighbouring particles.
4. Conclusions
Time-resolved 2PPE is a well-established method to investigate the relaxation dynamics of optically excited electrons. In contrast to pure optical methods, the 2PPE directly addresses the electronic system and is therefore well suited to investigate the complex interplay between collective and single electron excitations on a microscopic level. Using special elliptically-shaped nanoparticles switching between resonant and off-resonant excitation conditions is possible by rotating the polarization vector of the perpendicular incident light. The presented laterally integrated time-resolved 2PPE results allow extracting the lifetime of collective electron oscillation. The results presented in this context confirm the model developed by Merschdorf et al. [24], which treats the plasmon resonance as a modification of the internal electric field with respect to amplitude, phase, and temporal structure.
The combination of TR-2PPE and a photoemission electron microscope permits a spatial resolution much below the optical diffraction limit as well as a femtosecond time-resolution. The direct imaging gives access to the spatiotemporal dynamics of the plasmon resonance-enhanced electric fields in and around metal nanostructures. In comparison to other microscopy techniques such as SNOM, the PEEM lacks the need to scan the sample surface, enabling a parallel data acquisition. The presented data underlines the possibilities of TR-PEEM in visualising the ultrafast dynamics of energy flow through nanoscopic devices. Investigations of the near fields around single particles, nanowires, and particle pairs were discussed. In the case of large single particles, direct observation of the phase propagation of a plasmon mode through an extended nanoparticle was demonstrated. In polycrystalline nanowires, the method was used to identify the observed patterning caused by structural defects. Finally, a LSP field energy distribution influenced by the coupling in particle pair structures with a centre-to-centre distance of 130 nm was demonstrated. This shows the possibilities of channelling light through resonant metallic nanostructures into areas well below the diffraction limit. In conclusion, we would like to stress that TR-PEEM as characterization tool for the metal nanostructures shows the potential to become a key technique in the field of nano-optics.
Acknowledgments
The authors would like to thank the Nano-Bio Center at the University of Kaiserslautern for their support in preparing the silver nanoparticle samples. This work was supported by the Deutsche Forschungsgemeinschaft through SPP 1093 and the DFG Graduiertenkolleg 792.


