The New Old Rat (Rattus, Mammalia) From Turkestan: Revisiting From a Genomics Perspective
Funding: This work was supported by the National Natural Science Foundation of China (Grant Nos. 32170426, 32350410408), and the Institute of Zoology, Chinese Academy of Sciences (Grant No. 2023IOZ0104); A.A.L. and E.V.I. were supported by the research project of the Severtsov Institute of Ecology. Evolution (FFER-2024-0012), E.V.O. was supported by the state assignment of Lomonosov Moscow State University.
ABSTRACT
The Turkestan rat (Rattus turkestanicus) has long been classified as a part of the Himalayan rat R. pyctoris. In this study, we integrate genomic and morphological data to re-evaluate the taxonomic status of this species. Morphological analyses indicate minimal differentiation between samples from the Himalayas and Turkestan, whereas significant genetic divergence is evident in both mitochondrial DNA and across whole-genome SNPs. Genetic distance analysis of 13 mitochondrial protein-coding sequences and population differentiation statistics (fixation index Fst) of genome-wide SNPs also supported the divergence. Based on these findings, we propose reinstating R. turkestanicus as a full species.
1 Introduction
The genus Rattus Fischer von Waldheim, 1803, represents one of the most species-rich taxa within the order Rodentia. The taxonomy of this genus has a complex history, with the composition of its species evolving notably over time. One reason for this is the conservative nature of cranial morphology, which hindered the refinement of certain taxa during the morphometric era of taxonomy (Rowe et al. 2011). Recent genetic studies on rats have provided new insights and have contributed to the stabilisation of Rattus taxonomy (Robins et al. 2008; Pagès et al. 2010). Molecular dating based on the whole mitochondrial genome revealed that this genus began diverging approximately 3.5 million years ago (Mya) (Robins et al. 2008).
There are still taxa of rats that have not been studied by either morphological or genetic methods. One such taxon is the Turkestan rat, Rattus turkestanicus (Satunin 1903). Originally described from what is now Kyrgyzstan, the taxonomic status of this species has been debated for many years on the basis of specimens from India and Nepal (Hinton 1922; Chakraborty 1983; Musser and Carleton 2005).
The nominal taxon Mus turkestanicus was described by Satunin (1903). The name was derived from Turkestan—the historical region in Central Asia that includes the Tian Shan and Pamir mountains and the arid areas around them. The original publication did not directly mention the type specimen, which was, however, marked in the collection of the St Petersburg Zoological Institute (Baranova and Gromov 2003). The description did not attract the attention of zoologists, and the first revision of the taxon in question was made by Argyropulo (1928a, 1928b, 1936). Argyropulo compared a sample of R. turkestanicus with two specimens from India and wrote unequivocally about their identity. The majority of later authors accepted this point of view and considered Turkestan and Himalayan rats as one species without further discussion (Corbet and Hill 1992; Musser and Carleton 1993, 2005). The main discussion concerned the proper name of this species, not the species composition (Musser and Carleton 2005). The opposing view that R. turkestanicus was separate from the Indian R. vicerex (Bonhote, 1903) (another nominal taxon in the group under discussion) existed (Hinton 1922; Chakraborty 1983), but the Turkestan specimens were not analysed by these authors. Hinton (1922) only suggested such a possibility, but did not discuss the geographical distribution of the taxa. Chakraborty (1983) clearly separated the species, but populated Kashmir with the Turkestan rat, so his taxonomic limits differed from those of other authors. Thus, the separation of the Turkestan and Himalayan rats has never been popular. The stable name for the combined species for the last three decades has been R. pyctoris (Hodgson, 1845).
This article revisits the question of the classification of the Turkestan and Himalayan rats. We compared the two species for the first time using genomic methods. Due to the lack of significant morphological differentiation that is common in Rattus (Rowe et al. 2011), phylogenetic analyses based on both the mitochondrial genome and genome-wide single-nucleotide polymorphisms (SNPs) are becoming important taxonomic tools.
2 Materials and Methods
Taxonomic ranks of some rat taxa are not stable across publications. We used ranks from Aplin et al. (2011). Since we found no morphological differences between R. pyctoris and R. turkestanicus (see Section 3), and since we did not have the opportunity to evaluate the genetic material of the type specimens, we identified the specimens based on genetic integrity and geographical location. No other similar species are currently known from the region in question (Musser and Carleton 2005).
2.1 Morphometrics
The skulls of the rat specimens, including types of vicerex, pyctoris, rattoides (Figure S1) were measured at three museums. The list of museums and measurements that were taken with a calliper is listed in the Table S1. The measurements from the three museums were taken by three different people. We have therefore shortened the list of measurements, leaving only very stable measurements that are difficult to take in different ways. Body measurements were taken from the museum labels.
We analysed cranial measurements with principal components analysis (untransformed measurements) and performed factor analysis with maximised between-species difference on the basis of an age-reduced dataset (details in Lissovsky et al. 2022). Sexual dimorphism was not found in the dataset (nested design two-factor MANOVA, sex nested in species, p = 0.98). Statistical analyses were performed in Statistica, version 13 (Statsoft Inc.).
2.2 Molecular Sampling
We constructed a genome-wide data set for 50 specimens: R. norvegicus (Berkenhout, 1769) (n = 9), R. pyctoris (n = 11), R. andamanensis (E. Blyth, 1860) (n = 8), R. rattus (Linnaeus, 1758) (n = 1), R. r. tanezumi (Temminck, 1844) (n = 7), R. nitidus (Hodgson, 1845) (n = 6), R. turkestanicus (n = 6), Niviventer fengi Ge, Feijó et Yang, 2020 (n = 1) and Apodemus chevrieri (A. Milne-Edwards, 1872) (n = 1). Among them, whole genome sequencing data of R. turkestanicus (n = 6), R. rattus (n = 1), R. pyctoris (n = 2), N. fengi (n = 1), and A. chevrieri (n = 1) were newly generated by this study. Wild-caught specimens were immediately dissected, and the extracted muscle tissues were stored in 95% ethanol at −80°C. Genome-wide data for R. r. tanezumi (n = 7) and R. nitidus (n = 6) were downloaded from public databases as supplements. Genomic data for the remaining samples were obtained from previous studies (Liu et al. 2024): R. norvegicus (n = 9), R. pyctoris (n = 9), R. andamanensis (n = 8). Collection information on these specimens is provided in the Table S2. The detailed information and accession numbers of samples from the previous study and public databases as supplements are given in Table S3.
2.3 Extraction Methods for Ancient Animal DNA
The five museum skin samples (Table S2) were used for whole-genome sequencing. A single claw from each sample was carefully excised from the skin using sterile techniques to avoid contamination. Surface contaminants were removed using sterile instruments. Samples were then pulverised using a sterilised drill to increase surface area and thereby improve DNA extraction efficiency. Lysis buffer containing Proteinase K was added to the powdered samples; Proteinase K facilitates the digestion of proteins that bind to DNA. The mixture was incubated at 56°C for 12 h to ensure complete lysis. After lysis, the DNA was purified using silica-based columns or magnetic beads, which effectively bind DNA while washing away inhibitors and contaminants. The purified DNA was eluted in TE buffer. For quantification, the concentration of extracted DNA was measured using Qubit fluorometry. Due to the highly fragmented nature of ancient DNA, a bioanalyser was used to assess fragment sizes. To authenticate the ancient DNA, PCR amplification of short fragments was performed, followed by sequence analysis. Extracted DNA was stored in small aliquots at −20°C to prevent degradation by repeated thawing. All preparation steps were carried out in a UV-sterilised environment to minimise the risk of contamination. All work was performed in a dedicated ancient DNA laboratory with strict contamination control measures, including full-body suits, face masks, and gloves.
2.4 DNBSEQ Short-Read Library Preparation
DNA extracted from muscle tissues and skin specimens was sent to the Beijing Genomics Institute (Beijing, China) for whole-genome sequencing. DNA libraries of 300–400 base pairs (bp) in length were constructed using the DNBSEQ platform for whole genome sequencing of plants and animals. First of all, the concentration of the DNA samples was quantified through fluorescence measurement, and the integrity of the DNA samples was evaluated using 1% agarose gel electrophoresis. Samples that passed these tests could be used for library preparation. Next, the DNA samples were fragmented using ultrasound waves, and the fragmented samples were selected using magnetic beads to concentrate the sample bands around 300–400 bp; the amount of purified DNA samples was measured using a fluorescence quantifier. End repair, “A” tailing, and adapter ligation were then performed. The polymerase chain reaction (PCR) reaction system was prepared, the ligated products were amplified, and the amplified products were screened for fragmentation using magnetic beads. The PCR products were denatured to single-stranded, and then a cyclization system was prepared to obtain single-stranded cyclic products. The final library was obtained by digesting the linear DNA subfractions that had not been cyclized.
2.5 Sequencing and Data Quality Control
The single-stranded circular DNA was replicated by rolling, forming a DNA nanoball (DNB) containing more than 300 copies. The resulting DNBs were added to the grid of small holes in the core using high-density DNA nano-core technology. Sequencing was performed by co-probe anchored polymerisation (cPAS). After sequencing, the low-quality raw READS were filtered. The filtering parameters -n 0.001 -l 10 -q 0.5 --adaMR 0.25 --polyX 50 --minReadLen 150 of the SOAPnuke software (Chen, Chen, et al. 2018) were used. Reads matching 25.0% or more of the adapter sequence, less than 150 bp in length, N content of 0.1% or more of the total read, polyX (X can be A, T, G, or C) greater than 50 bp, and low-quality reads were primarily removed. Finally, high-quality clean reads were obtained for subsequent analyses. The whole genome sequences obtained in this study were submitted to the China National GeneBank (CNGB) database with accession numbers CNS1350534–CNS1350543. Detailed information on the clean data of the newly generated data in this study is provided in Table S4.
2.6 Single Nucleotide Polymorphism Calling and Filtering
The raw data downloaded from the public database were filtered to obtain clean reads using fastp version 0.20.1 (Chen, Zhou, et al. 2018). The BWA version 0.7.17 (Li and Durbin 2009) was then used to map the paired-end clean reads to the R. norvegicus reference genome (GCF_015227675.2_mRatBN7.2 from the National Center for Biotechnology Information, NCBI). The mapped bam files were then sorted, and polymerase chain reaction duplicates were removed using Samtools version 1.12 (Li et al. 2009). Initial single-nucleotide polymorphism (SNP) variants were obtained using BCFtools version 1.12 (Li 2011). The initial SNPs were filtered using VCFtools version 0.1.16 (Danecek et al. 2011), retaining only high-quality SNP loci with genotype quality > 30, sequencing depth 10–1000, missing rate < 10%, and biallelic sites. After filtering, we obtained 69,168,038 high-quality SNP loci for subsequent analyses.
2.7 Phylogenetic Reconstruction Using the Mitochondrial Genome
Mitochondrial genomes were assembled using high-quality data from 50 samples using the GetOrganelle-master software (Jin et al. 2020). They were annotated using MitoZ 3.6 (Meng et al. 2019). After annotation, individual genes were organised into separate files using mitoz-tools (part of the MitoZ software) with the ‘group_seq_by_gene’ subcommand. Sequences of each annotated gene were aligned using Mafft 7.525 (Nakamura et al. 2018) with a maximum of 1000 iterative refinements. The resulting alignments were used to generate an edge-linked proportional partition model file (Chernomor et al. 2016) for phylogenetic reconstruction. Maximum likelihood analysis was performed in IQTree 2.3.6 (Nguyen et al. 2015) with extended model selection followed by tree inference (“-m MFP” option), 10,000 ultrafast bootstrap replicates with optimisation of UFBoot trees (Minh et al. 2013; Hoang et al. 2018) by nearest neighbour exchange operation (“-B 10000 --bnni” Options), and 10,000 replicates for Shimodaira-Hasegawa (SH) approximate likelihood ratio test (“--alrt 10,000” option). The mitochondrial genomes obtained in this study have been deposited in the CNGB under accession numbers N_002027891–N_002027890.
2.8 Phylogenetic Reconstruction Using the Genomic SNP Data
The high-quality SNPs were used to construct the phylogenetic tree using neighbour-joining (NJ) and maximum likelihood (ML) methods. Niviventer fengi and Apodemus chevrieri were used as outgroups. The P-distance matrix was generated using VCF2Dis version 1.5 (https://github.com/BGI-shenzhen/VCF2Dis). The generated distance matrix files were submitted to the online platform Fastme (Lefort et al. 2015) for the construction of NJ trees. In addition, the format conversion tool vcf2phylip.py (Ortiz 2019) was used to convert the VCF file containing the SNP loci to the PHY format. The PHY file was used as input to IQtree version 2.3.6 (Nguyen et al. 2015) to construct the ML tree using the GTR model with a bootstrap value of 1000.
2.9 Calculating Genetic Distances
Mitochondrial and genomic patristic distances were calculated in Treefinder (Jobb 2011) using maximum likelihood trees calculated on the basis of the mitochondrial genome and the whole genome as described above.
In addition, genome-wide pairwise differentiation index (Fst) values between populations were calculated using vcftools with a sliding window size of 100 kb and a step size of 50 kb. The final calculated mean Fst values between the two pairs were used to measure the degree of differentiation between species.
2.10 Tree Cover
Tree cover patterns were calculated using the Global Tree Cover dataset (https://glad.umd.edu/dataset), downloaded from the Google Earth Engine (https://code.earthengine.google.com). We used combined data for the year 2015. As forests in Turkestan are confined to very narrow mountain gorges, we used a raster spatial resolution of 200 m. Raster data were vectorised with two categories: 5%–39% and 40%–100% of tree cover.
3 Results
We did not find any diagnostic morphological characters. Tail length, which is always mentioned as a character separating R. pyctoris and R. turkestanicus, did not show a different distribution in the two species (Figure S2). Cranial features showed no tendency to separate the two species (Figures S3–S4).
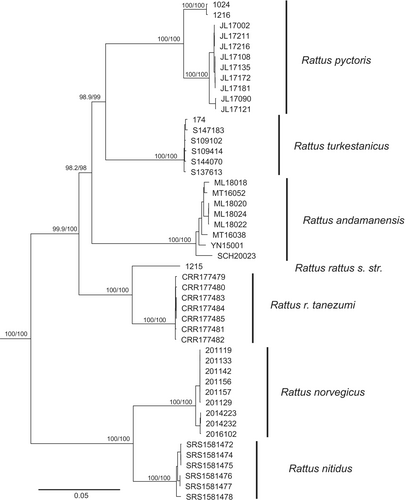
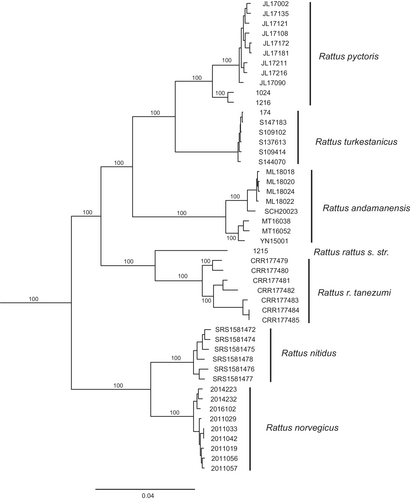
The clade composition and topology of the mitochondrial genome-based and the whole-genome-based trees were identical (Figures 1 and 2). Furthermore, there were no cases of mito-nuclear discordance. Our trees supported two groups of species: the black rat group (Rattus rattus (including R. r. tanezumi), R. andamanensis, R. pyctoris, and R. turkestanicus) and the brown rat group (R. norvegicus and R. nitidus).


| R. pyctoris | R. turkestanicus | R. andamanensis | R. rattus | R. norvegicus | R. nitidus | |
|---|---|---|---|---|---|---|
| R. pyctoris | 4.88 | 8.22 | 9.22 | 11.52 | 11.51 | |
| R. turkestanicus | 10.89 | 8.51 | 9.50 | 11.81 | 11.80 | |
| R. andamanensis | 13.61 | 12.47 | 9.41 | 11.72 | 11.71 | |
| R. rattus | 12.97 | 11.83 | 12.84 | 10.17 | 10.16 | |
| R. norvegicus | 20.96 | 19.82 | 20.84 | 18.60 | 3.70 | |
| R. nitidus | 19.73 | 18.60 | 19.61 | 17.37 | 6.76 |
The Himalayan rat (R. pyctoris) showed inter-sample variation, with mitochondrial distance values between samples from the Western and Central Himalayas (mitochondrial distance 3.19%, genomic—1.82%) being slightly shorter than the distance between R. rattus and R. r. tanezumi (Table 1).
The Turkestan rat was well separated from all other species in the study. Both mitochondrial and general genomic genetic distances (Table 1) to the closest relative R. pyctoris are greater than those between R. norvegicus and R. nitidus. In the case of R. rattus and R. r. tanezumi, the between-groups mitochondrial distance (5.67%) is smaller than the distance between R. pyctoris and R. turkestanicus, while the genomic distance (6.18%) is comparable. Genome-wide paired Fst values demonstrated a similar trend (Table 2): the Fst values between R. turkestanicus and R. pyctoris were greater than those between R. norvegicus and R. nitidus, as well as R. rattus and R. r. tanezumi.
| R. pyctoris | R. turkestanicus | R. andamanensis | R. rattus | R. tanezumi | R. norvegicus | R. nitidus | |
|---|---|---|---|---|---|---|---|
| R. pyctoris | |||||||
| R. turkestanicus | 0.3844 | ||||||
| R. andamanensis | 0.4421 | 0.5259 | |||||
| R. rattus | 0.5049 | 0.7518 | 0.4966 | ||||
| R. tanezumi | 0.4403 | 0.4713 | 0.4281 | 0.1856 | |||
| R. norvegicus | 0.5864 | 0.7350 | 0.6091 | 0.7514 | 0.5273 | ||
| R. nitidus | 0.5179 | 0.6022 | 0.5256 | 0.5426 | 0.4423 | 0.3782 |
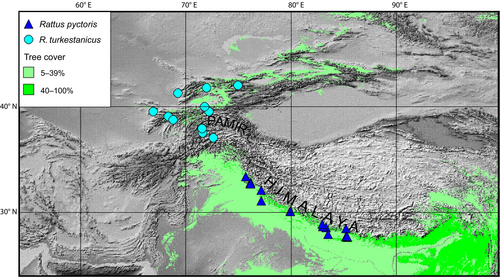
Both species, R. pyctoris and R. turkestanicus, are forest dwellers. The entire region under consideration is quite arid and is rich in high elevation areas (> 4000 m asl), which are above the tree line in this part of Asia. The distributions of the two rat species are separated by a wide band of treeless landscapes, including the Pamir and Karakorum mountains (Figure 3).

4 Discussion
Two Asian mountain forest species, R. pyctoris and R. turkestanicus, are found in the Himalayas and Turkestan (Tian Shan and Alai mountains), respectively. Both species are known to be less dependent on anthropogenic habitats (Argyropulo 1936; Gromov and Erbajeva 1995), so their distribution is expected to be restricted to natural forests, unlike invasive rat species.
The Turkestan rat R. turkestanicus has clearly diverged along an independent evolutionary lineage, with its genetic distances from its closest relative, R. pyctoris, consistently exceeding those observed between R. norvegicus and R. nitidus, or between R. rattus and R. r. tanezumi. This evidence strongly supports the classification of the Turkestan rat as a distinct species.
The long-running discussion about the number of taxa within the composite ‘Himalayan rat’ finds an interim solution in our study. The previous discussion had two main branches: whether the Turkestan rat sensu stricto penetrates the Himalayas (Chakraborty 1983) and how many taxa of ‘Himalayan rat’ inhabit this huge mountain range. The answer to the first question is clear for today: we did not find R. turkestanicus sensu stricto in the Himalayas. The second question is more complicated and needs additional investigations. Nevertheless, the more popular point of view on the taxonomy of R. pyctoris s. Lato (Musser and Carleton 2005) included two subspecies in the Himalayas: R. p. vicerex (Bonhote, 1903) (described from Shimla, Himachal Pradesh, India), and R. p. rattoides (Hodgson, 1845) (described from the Central region of Nepal). The name R. p. rattoides (Hodgson, 1845) was found to be preoccupied, but the name R. pyctoris (Hodgson, 1845) described from the same locality and in the same nomenclatorial act, was decided to be the oldest name in the group under discussion (Musser and Carleton 1993, 2005). Thus, two proposed subspecies of R. pyctoris are R. p. pyctoris and R. p. vicerex.
Our data were collected in Himachal Pradesh and close to central Nepal, so we can contribute to the discussion about the number of subspecies of R. pyctoris. The heterogeneity of R. pyctoris found in this study supports the existence of the two subspecies of this species.
The important point of this study is to discuss the possible pathway of speciation in the rats under discussion. As both species are sylvatic, the most direct scenario is that of population divergence following the disjunction of the forest during the recent uplift of the Tibetan Plateau and other neotectonic processes. The Palaearctic forest belt and the disjunction of mammalian ranges confined to it have been described in detail previously (Matyushkin 1982). However, this paper does not include a discussion of this (Pamir–Himalayan) faunal split.
There are no other species of small mammals characteristic of deciduous forests in either Turkestan or the Himalayas. In general, there is very little overlap between the faunas of these two mountain regions. Excluding species associated with arid landscapes, the only shared faunal elements are representatives of the genera Alticola, Sylvaemus, and Ochotona. All three are typical of the stony landscapes of this region. The most similar distribution to the rats under discussion has a pair of pikas, Ochotona. Turkestan red pika O. rutila (Severtsov, 1873) inhabits the peripheral western ranges of the Tian Shan and Pamir-Alai mountains, similar to R. turkestanicus. The sister species (Lissovsky et al. 2022), Royle's pika O. roylii (Ogilby, 1839), lives on the southern, forested slope of the Himalayas, like R. pyctoris. However, O. rutila is clearly associated with the talus higher above the tree line; O. roylii descends into forests, but is not a forest species. Thus, the two rats, R. turkestanicus and R. pyctoris, are the unique faunistic elements for the Tian Shan–Himalayan mountain belt; they are the only typical sylvatic species shared by both mountain systems.
The genus Rattus was generally thought to have originated in Southeast Asia (Robins et al. 2010). Despite the considerable attention given to notorious invasive species, such as R. norvegicus and R. rattus, many native species with restricted distributions remain under-investigated. The studies of genetic differentiation and adaptive evolution in Turkestan and Himalayan rats could shed light not only on the genetic mechanisms of speciation, but also on the history of this important mountain region.
Acknowledgements
We would like to express our gratitude to Xichao Zhu and Yang Yang for their invaluable assistance in examining the specimens housed at the National Zoological Museum, Institute of Zoology, Chinese Academy of Sciences. This study was supported by grants from the National Natural Science Foundation of China (Grant Nos. 32170426, 32350410408), and the Institute of Zoology, Chinese Academy of Sciences (Grant No. 2023IOZ0104); A.A.L. and E.V.I. were supported by the research project of the Severtsov Institute of Ecology. Evolution (FFER-2024-0012), E.V.O. was supported by the state assignment of Lomonosov Moscow State University.
Open Research
Data Availability Statement
The whole genome sequences obtained in this study were submitted to the China National GeneBank (CNGB) database with accession numbers CNS1350534-CNS1350543. The mitochondrial genomes obtained in this study have been deposited in the CNGB under accession numbers N_002027891-N_002027890.


