Comparison of STA-NeoPTimal (Stago) and STA-Neoplastine CI Plus (Stago) thromboplastin reagents using a STA Satellite Max analyzer to measure prothrombin times in dogs
Abstract
Background
Different thromboplastins are available to measure prothrombin time (PT). Stago coagulation analyzers and reagents are currently used in veterinary laboratories and enable PT measurements to explore the coagulation cascade (extrinsic pathway).
Objectives
The main objective was to compare PT measurements obtained with the STA-NeoPTimal reagent with the commonly used STA-Neoplastine CI Plus reagent. The secondary objective was to compare the PT ratio with the international normalized ratio (INR) calculated from our derived clotting times.
Methods
Analytical performance was evaluated with intra-assay and inter-assay precision. Seventy-two individual canine plasma samples were collected. Each sample was tested with both thromboplastins, using an STA Satellite Max analyzer. The PT, PT ratio, and INR values obtained with the two reagents were compared using Passing-Bablok regression for correlations and Bland-Altman plots for method agreements.
Results
The analytical performance of STA-NeoPTimal reagent was acceptable. Compared with the STA-Neoplastine CI Plus reagent, the STA-NeoPTimal reagent showed a positive proportional bias for PT values. Narrow range analyses showed good agreement for normal PT values (less than 9.5 seconds, internal reference cutoff with STA-Neoplastine CI Plus), and clinical concordance was achieved. When PT was prolonged (more than 9.5 seconds), PT increases were more marked with the STA-NeoPTimal reagent. Agreement was good for INR values across the whole range of PT results.
Conclusion
STA-NeoPTimal can be reliably implemented in veterinary laboratories for canine PT measurements, as agreement between the PT results measured with the two reagents was clinically acceptable.
1 INTRODUCTION
Prothrombin time (PT) is routinely performed in laboratories worldwide since it evaluates the extrinsic pathway factor activities of the coagulation cascade (ie, factors II, V, VII, X, and fibrinogen). In veterinary medicine, PT is usually included in coagulation profiles, together with the activated partial thromboplastin time, fibrinogen concentration, and platelet counts, to diagnose bleeding disorders or evaluate the risk of hemorrhage during invasive procedures (eg, biopsy, surgery). Prolonged PTs are observed in various clinical settings: vitamin K insufficiency and vitamin K antagonist (VKA) intoxication (eg, rodenticides), hepatic insufficiency, disseminated intravascular coagulation, and congenital deficiencies of factors II, V, X, and VII, or fibrinogen.
Prothrombin time is the measured clotting time of citrated platelet-poor plasma incubated with an excess of calcium ions and tissue thromboplastin (tissue factor), which activates the extrinsic pathway of the coagulation cascade. The origin of thromboplastin varies among commercial reagents, which can lead to differences in PT measurements. Published PT upper reference interval limits in dogs are usually <10 seconds.1 However, these upper limits can differ among laboratories depending on the method used and the characteristics of the population used to generate the reference interval. For example, the Cornell University Comparative Coagulation Laboratory website provides a reference interval for canine PT of 11-16 seconds, while a recent publication in dogs in Sri Lanka gives a reference interval of 7-11 seconds.2-4 Published lower and upper reference interval limits for canine PT are 6.9 and 8.8 seconds, respectively.5
The PT results might also vary with different thromboplastin batches. Whenever possible, PT should be normalized to the laboratory reference for the reagent that was used. The PT ratio is the ratio of a subject's measured PT value (in seconds) to the normal laboratory reference PT value (batch). The normal control time is calculated by the geometric mean of a minimum of 20 healthy-patient plasma samples not measured in the same run (mean normal prothrombin time, MNPT). Moreover, as each thromboplastin reagent has a different sensitivity to factor deficiencies, mainly depending on its origin; the international normalized ratio (INR) has been devised to monitor VKA treatments in human patients and standardize PT results measured using different thromboplastins. Manufacturers assign an ISI (International Sensitivity Index) value for each thromboplastin batch. This ISI value indicates how a batch of thromboplastin compares with an international standard tissue factor. The ISI of a thromboplastin reagent, as determined by a manufacturer, is usually between 0.94 and 1.4 for the most sensitive ones. INR is the ratio of a patient's PT to a normal control time raised to the power of the thromboplastin ISI used.
While INR is widely used in human medicine to monitor VKA treatments, the INR or PT ratio is not currently used in routine in veterinary medicine. This might be explained by the fact that VKA treatments are not commonly performed in veterinary medicine. Furthermore, collecting 20 healthy animal samples for each batch of reagent is difficult to achieve. Prothrombin time is given in seconds in veterinary medicine; and therefore, results given by different laboratories are not easily comparable.
Stago coagulation analyzers and reagents are widely used in human and veterinary medicine, and Stago technology is used as a reference method to assess other veterinary coagulation analyzers.4 To measure PT, the STA-Neoplastine CI Plus reagent (rabbit brain thromboplastin reagent with ISI close to 1.3) is routinely used and reported in several publications.4, 5 Recently, a new reagent, STA-NeoPTimal (rabbit brain thromboplastin reagent with an ISI close to 1.0), was developed by Stago to measure PT. The analytical performance of the STA-NeoPTimal reagent and the comparison with the STA-Neoplastine CI Plus reagent have already been conducted in people with good agreement for the PT ratio and INR using the Bland and Altman method.6
The aim of the present study was to compare canine PT obtained with the STA-NeoPTimal reagent with that obtained with STA-Neoplastine CI Plus reagent, which is routinely used in our laboratory to measure PT on an STA Satellite Max analyzer.
2 MATERIALS AND METHODS
2.1 Sample collection
This study was conducted from January 2019 to February 2020. Citrated plasma samples of 72 dogs submitted to our laboratory for coagulation profiles to assess the risk of hemorrhage during invasive procedures or to explore bleeding disorders were included in the study. After completing the prescribed analysis, the remaining plasma samples were frozen at −20°C until the day of experimentation. Time from collection to analysis did not exceed 3 months. All analyses were performed on leftover plasma samples. Few collected samples were excluded from the study for various reasons: (i) three samples had an insufficient remaining plasma volume to perform two PT measurements after thawing; (ii) one sample had a preliminary PT of >60 seconds with the STA-Neoplastine CI Plus reagent (even if PT values were also >60 seconds with the STA-NeoPTimal reagent); and (iii) four samples had a PT > 40 seconds with the STA-Neoplastine CI Plus reagent, which resulted in a PT > 60 seconds with the STA-NeoPTimal reagent.
Seventy-two samples comprised of 36 samples with normal PT values (<9.50 seconds measured with the STA-Neoplastine CI Plus reagent [range 8.22-9.48 seconds]) and 36 samples with prolonged PT values (PT > 9.50 seconds measured with STA-Neoplastine CI Plus reagent [range 9.51-30.10 seconds]). Age was reported for 48 dogs and ranged from 3 months to 16.5 years (mean 7.6 years). Samples were from 32 different canine breeds, and the sex ratio was 0.94 (calculated from the 60 samples for which sex was reported).
2.2 PT measurements
Prothrombin time measurements were performed with an STA Satellite Max analyzer (Stago). Two reagents were compared, the STA-Neoplastine CI Plus (Stago) and STA-NeoPTimal (Stago, Asnières-sur-Seine, France). Both reagents were precalibrated. Two levels of a human control (STA Coag Control N and P) were used for daily quality control assessments and analytical performance evaluations. Reagents and controls were reconstituted according to the manufacturer's recommendations.
To assess the repeatability when using the STA-NeoPTimal reagent, a single pooled canine plasma sample was used to measure PT 20 times within 1 hour. For both reagents, measurement imprecision was estimated over a long time interval by duplicate measurement analyses of each control solution performed twice daily, using 4-hour intervals for 5 consecutive days.
On the day of analysis, plasmas were thawed at room temperature for 30-60 minutes depending on the remaining volume, as routinely performed in our laboratory. Prothrombin times were measured with an STA Satellite Max analyzer using the two different reagents.
2.3 PT ratio and INR calculation
The MNPTs used to calculate the PT ratio and INR were determined by calculating the geometrical mean of the normal PT values, defined by all PT values under 9.50 seconds measured with the STA-Neoplastine CI Plus or STA-NeoPTimal reagents, with each batch of the thromboplastin reagents. Although MNPTs should be calculated in at least 20 samples, it was not possible to reach this number for all thromboplastin batches; however, at least 16 samples were used to calculate the MNPT. Two different batches were run with the STA-NeoPTimal reagent, and three different batches were run with the STA-Neoplastine CI Plus reagent. The ISI value was provided by Stago, according to World Health Organization recommendations.7 The PT ratio corresponded to the PT/MNPT ratio, and the INR corresponded to the PT ratio raised to the power of the ISI of the thromboplastin used.
2.4 Statistical analysis
Analytical performance was assessed by calculating the mean, SD, and CV for intra-assay and inter-assay precision, in accordance with the American Society for Veterinary Clinical Pathology (ASVCP) guidelines.8 As recommended, inter-assay SD should be <0.33 TEa (total error allowable, expressed in test units). Intra-assay SD performed on pooled canine plasma samples was compared with the recommended limit of 0.25 TEa. The TEa recommendation for the analytical quality of PT measurements is 15% as determined by the Westgard QC recommendations for Clinical Laboratory Improvement Amendment requirements.9 However, this TEa value is for normal human PTs of around 14 seconds. As normal PTs in dogs are usually lower, TEa was calculated as 1.63 x SD +bias.10 Acceptable bias for PTs <17 seconds was 8.2% according to the French Group of Hemostasis and Thrombosis (GFHT) recommendations, and the SD for control (N) was 0.22 in regard to our performance results using the STA-NeoPTimal reagent.11 TEa was then fixed at 8.6%. This threshold is suitable for clinical settings, as it corresponds to a variation of <1 second for normal canine PT. For the INR, TEa calculated from the same formula was 7.3% for the INRs between 1.6 and 1.9, and 20.7% for the INRs > 3 (acceptable bias according to GFHT recommendations and SDs of 0.03 and 0.08, respectively).11
For comparison purposes, results obtained with the two reagents were assessed using Passing-Bablok regression and the Spearman correlation test. Agreement between the two methods was evaluated using Bland and Altman plots when possible (when the repartition of the differences was Gaussian).8, 12 A P < 0.05 was considered statistically significant. Statistical analysis was performed using MedCalc software, version 17.4.4 (https://www.medcalc.org). According to ASVCP recommendations, total error observed (TEo) was compared with TEa to determine if the agreement between two methods was clinically acceptable. Performance was considered acceptable if TEo < TEa. Total error observed was calculated using relative bias, and between-run CVs were determined for the STA-NeoPTimal reagent. The normalized decision chart was used to characterize the comparison performances.8
3 RESULTS
3.1 Analytical performance
The performance of STA-NeoPTimal and STA-Neoplastine CI Plus reagents to measure PT using the STA Satellite analyzer at our laboratory is presented in Table 1. Two human control solutions (STA Coag Control N + P) were used to test reagent performance. The SD for STA-NeoPTimal was 0.22 seconds for Control N and 0.64 seconds for Control P; both these SDs were less than 0.33 TEa (expressed in seconds [0.42 seconds for Control N and 0.74 seconds for Control P]). Moreover, CVs did not exceed 3%, which was the acceptable limit recommended by the GFHT. Short repeatability for the STA-NeoPTimal reagent of pooled canine plasma samples gave a CV of 0.67%, which was <0.25 TEa (2.15%).
| Reagent | Level of control | Target Value (s) | Mean (s) | SD (s) | CV (%) |
|---|---|---|---|---|---|
| STA-Neoplastine CI Plus | Control N | 14.0 | 13.89 | 0.29 | 2.09 |
| Control P | 22.5 | 22.44 | 0.61 | 2.73 | |
| STA-NeoPTimal | Control N | 14.2 | 14.74 | 0.22 | 1.51 |
| Control P | 25.0 | 26.11 | 0.64 | 2.47 |
- Control N, normal human control; Control P, abnormal human control (STAGO coagulation controls)
3.2 Method comparison analyses
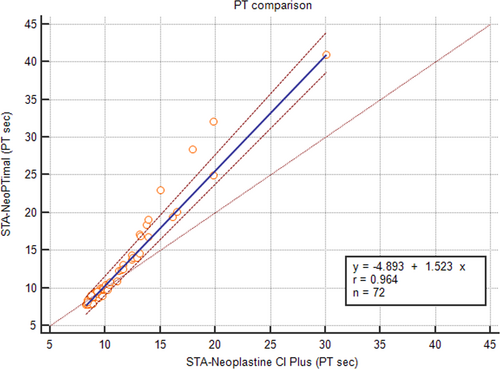
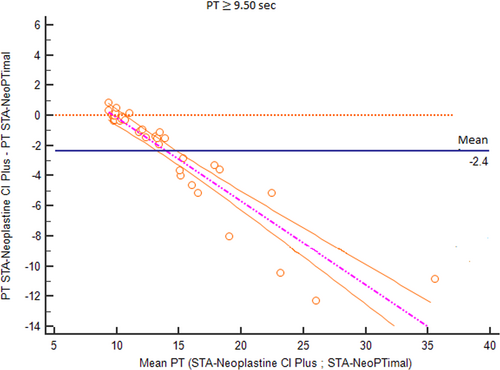
The correlation of PT results obtained using the two methods assessed with Passing-Bablok regression is shown in Figure 1. A correlation was found between the two methods, although the regression line showed a proportional bias. The average bias between the two methods was –1.1 seconds (Figure 2). Negative bias was caused by PT values >10 seconds. For shorter PT values, measurements were closer to one another, and the difference was closer to zero.
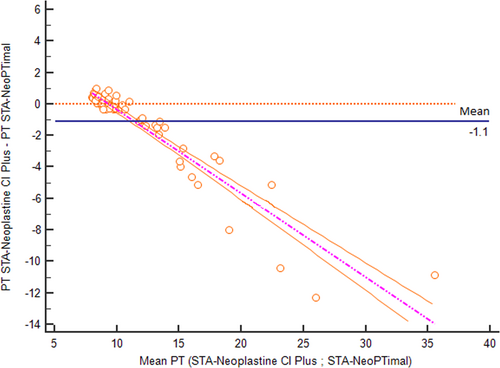
To better analyze these results, the data were separated into two groups according to clinical relevance: (1) samples with normal PT values using the STA-Neoplastine CI Plus reagent (less than 9.50 seconds, which is the cutoff routinely used to discriminate between normal or increased PT in dogs); and (2) samples with prolonged PT values using the STA-Neoplastine CI Plus reagent (above 9.50 seconds).
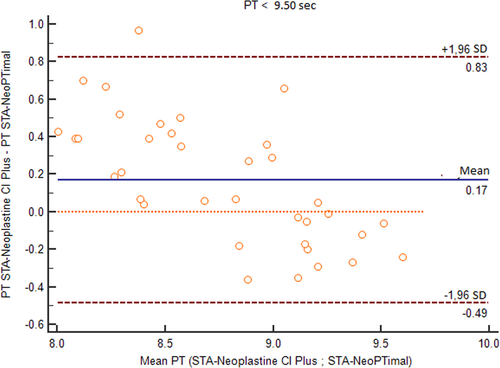
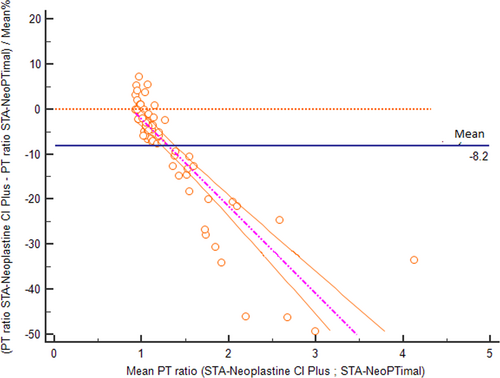
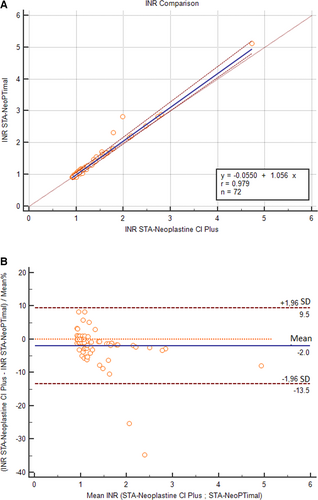
For samples with normal PT values, the Bland-Altman plot showed an average bias of 0.17 seconds (Figure 3). TEo was 5.1% (calculated as relative bias [2.1%] + 2CV [2 × 1.5%]), which was lower than the TEa value. Using a normalized method decision chart, the comparison of samples with PTs <9.50 seconds was classified as good (with an observed inaccuracy value of 24 and an observed imprecision value of 17). For samples with prolonged PTs, the plot of the difference against the mean showed a proportional negative bias (Figure 4). The Bland-Altman analysis for the PT ratio continued to reveal a proportional negative bias (Figure 5) when the analysis was performed with the PT measurements standardized with the INR; agreement between the two methods was good across the whole range of the PT values (Figure 6A) with a constant mean relative bias of −2.0% (Figure 6B). The TEo varied from 5.1% for a mean INR of 1.7 to 7.08% for a mean INR of 3.1 (calculated using the formula: relative bias [2.0%] + 2CV), which were lower than TEa. Using the normalized method decision chart, the comparison of samples using the INR was classified as good to excellent (with an observed inaccuracy value of 27 and an observed imprecision value of 21 for an INR between 1.6 and 1.9; and an observed inaccuracy value of 10 and an observed imprecision value of 12 for an INR > 3).
4 DISCUSSION
Our results showed acceptable values for intra-assay and inter-assay precision of PT measurements using the STA-NeoPTimal reagent.
Throughout this study, a cutoff value of 9.50 seconds was used to discriminate between normal and prolonged PTs when measured with the STA-Neoplastine CI Plus reagent. For normal PTs, results were clinically comparable between the two reagents. Therefore, the data support this cutoff when PT was measured with the STA-NeoPTimal reagent and might, therefore, be useful in clinical practice. Nevertheless, reference intervals or cutoff values used for the clinical interpretation of PT values measured with the STA-NeoPTimal reagent must be more strictly evaluated by each laboratory.
For clinical situations where PT values are increased, the method using the STA-NeoPTimal reagent gave longer clotting times than the method using the STA-Neoplastine CI Plus reagent. This bias has no clinically significant impact on result interpretations. Conversely, it likely emphasizes the detection of pathologic situations with more marked increases in PT values using the STA-NeoPTimal reagent. Nevertheless, these two reagents are not interchangeable, and laboratories could use either reagent. Moreover, for practitioners wanting to monitor PT on serial panels, we recommend measuring PT with the same reagent to avoid misinterpretation.
The results also showed that the standardization of PT results using the INR, which takes into account thromboplastin sensitivity, would be optimal to compare PT values measured with different reagents, as agreement between the two methods was good for the whole range of PT values (normal and prolonged). Unfortunately, this standardization is not easily performed in routine veterinary laboratories. However, it could be an aim for future laboratory protocols.
In conclusion, this study shows that the STA-NeoPTimal reagent can be implemented in veterinary laboratories to replace the STA-Neoplastine CI Plus reagent for PT measurements in dogs. Further studies are needed to evaluate the sensitivity of the STA-NeoPTimal reagent for clinical situations where patients with prolonged PTs are assessed.
DISCLOSURE
The authors have indicated that they have no affiliations or financial involvement with any organization or entity with a financial interest in, or in financial competition with, the subject matter or materials discussed in this article.


