Expression and therapeutic targeting of BMI1 in canine gliomas
[Correction added on 24 August 2022, after first online publication: The funding source “U01 CA224166-01” was deleted in this version.]
Funding information: National Institutes of Health/National Cancer Institute, Grant/Award Number: P30CA093373-14S4; Maxine Adler Endowed Chair Funds; UC Davis Center for Companion Animal Health; Student Training in Advanced Research (STAR) Program
Abstract
The BMI1 proto-oncogene, polycomb ring finger protein (BMI1) is a key component of the epigenetic polycomb repressor complex 1, and has been associated with aggressive behaviour and chemotherapeutic resistance in various malignances including human gliomas. Similar to humans, spontaneous canine gliomas carry a poor prognosis with limited therapeutic options. BMI1 expression and the effects of BMI1 inhibition have not been evaluated in canine gliomas. Here, we demonstrate that BMI1 is highly expressed in canine gliomas. Although increased BMI1 protein expression correlated with higher glioma grade in western blot assays, this correlation was not observed in a larger sample set using immunohistochemical analysis. The BMI1 inhibitor, PTC-209, suppressed BMI1 expression in established canine glioma cell lines and resulted in antiproliferative activity when used alone and in combination with chemotherapeutic agents. PTC-209 targeting of BMI1 activated the retinoblastoma (RB) pathway through downregulation of total and phosphorylated RB, independent of INK4A/ARF signalling, likely through BMI1-inhibition mediated upregulation of p21. These data support the rationale for targeting of BMI1 signalling and the use of canine glioma as a translational therapeutic model for human disease.
1 INTRODUCTION
Polycomb-group (PcG) proteins are epigenetic regulators that play a pivotal role in the development and progression of cancers primarily through transcription repression.1 PcG proteins are composed of two core complexes, polycomb repressive complex 1 (PRC1) and polycomb repressive complex 2 (PRC2). The BMI1 proto-oncogene, polycomb ring finger (BMI1) protein is a core component of PRC1 and is involved in cell cycle regulation, development of stemness, self-renewal and tumour malignancy.2 BMI1 is also an important regulator of the INK4A/ARF (CDKN2A) locus which codes tumour suppressors p16INK4A and p14ARF (known as p19/ARF in the mouse).3, 4 In the central nervous system, BMI1 overexpression has been shown to induce self-renewal properties by the generation of neural stem cells from astrocytes.5
Canine gliomas, which include oligodendrogliomas and astrocytomas, have an estimated prevalence rate of 0.9% and account for 36.6% of primary intracranial neoplasms in dogs,6 with oligodendrogliomas being the most common subtype.7-9 Prognosis for canine glioma patients is generally poor, with a <1-year expected survival time for the majority of patients, regardless of treatment.10 Canine and human gliomas have many similarities including histologic and imaging characteristics, and recent studies have identified common abnormalities in oncogenic signalling pathways including p53, PDGF, INK4A/ARF, retinoblastoma (RB) and PTEN/PI3K/AKT.11, 12 As such, spontaneous canine gliomas represent a clinically relevant translational model to study the biology and treatment of human gliomas and numerous canine clinical trials have been established to investigate novel therapeutics with the potential to benefit both species.13, 14
BMI1 is overexpressed in human glioma, and in human and dog osteosarcoma.15, 16 The overexpression of BMI1 in many cancers has been correlated with aggressive behaviour, advanced disease stages, resistance to radiation treatment and chemotherapy and poor prognosis,17-22 making it a rational therapeutic target in disease where overexpression has been validated. Inhibition of BMI1 by RNAi, CRISPR knockout or the small molecular inhibitor of BMI1 (PTC-209) have resulted in in vitro and in vivo antitumor efficacy in human glioma models23-26 with inhibition of glioma tumour growth and cancer stem cell self-renewal.27 Interestingly, inhibition of BMI1 has been shown to cause an absence of tumour formation in mice independently of a functional INK4A/ARF locus.15 PTC-209 has been found to suppress BMI1 protein expression resulting in cell-cycle arrest, apoptosis and inhibition of proliferation, self-renewal and migration in human derived glioma cell models.23, 25 Expression of BMI1 and its validation as a potential therapeutic target in canine glioma have not been reported. We therefore set out to evaluate the expression of BMI1 in tissues from naturally occurring canine gliomas and also evaluate the effect of BMI1 inhibition by PTC-209 in multiple spontaneous canine glioma derived cell lines.
2 METHODS
2.1 Glioma and tissue samples
Tissues were obtained with owner consent at necropsy or from surgical or CT-guided biopsy of clinical cases presented to the University of California, Davis Veterniary Medical Teaching Hospital. Archived snap frozen tumour used for western blotting consisted of 6 low grade gliomas (4 astrocytomas II, 1 oligodendroglioma II and 1 undefined glioma) and 17 high grade gliomas (1 astrocytoma III, 6 astrocytomas IV [glioblastoma, GBM], 10 oligodendrogliomas III). Tissue samples from neurologically normal adult canine cerebrum (frontal/parietal) containing both white and grey matter were similarly collected at necropsy. Archived formalin fixed paraffin embedded tumour blocks were used to generate tissue microarrays (TMAs) as previously described.28 TMAs consisted of normal canine brain controls and glioma samples listed in Table 1. All tumours were histologically classified by a board-certified pathologist according to the WHO classification of human tumours of the central nervous system29 and the revised diagnostic classification system of canine glioma adopted by Koehler et al.7
| Glioma type and grade | BMI1 + / total samples | Avg. (%) + nuclei |
|---|---|---|
| Grade II oligodendroglioma | 3/3 (100%) | 60.0% |
| Grade III oligodendroglioma | 28/33 (85%) | 52.9% |
| Grade II astrocytoma | 9/12 (75) | 47.9% |
| Grade III astrocytoma | 8/8 (100%) | 58.1% |
| Grade IV astrocytoma (GBM) | 11/12 (92%) | 60.0% |
| Low grade (II) gliomas | 12/15 (88%) | 54.0% |
| High grade (III-IV) gliomas | 47/53 (92%) | 57.0% |
- Abbreviations: GBM, glioblastoma; IHC, immunohistochemistry.
2.2 Cell line culture and validation
Established canine glioma cell lines (J3Tbg, G06A and SDT-3G) were cultured at standard conditions in Dulbecco's Modified Eagle Medium (DMEM) supplemented with 10% FBS and antibiotics as previously described.30 J3Tbg cell line was derived from a high grade astrocytoma (grade III)31 and G06A and SDT-3G were derived from high grade astrocytomas (grade IV, glioblastoma).32 Cell lines were validated as canine by analysing on an Illumina CanineHD BeadChip (Neogen, Lincoln, NE) and were tested negative for mycoplasma.
2.3 Western blot
Protein expression was assessed by western blot as previously described.33 Samples were lysed using RIPA buffer and protein was quantified using a BCA assay. Anti-BMI1 rabbit monoclonal antibody (Cell Signaling #6964S) was used at a dilution of 1:1000. Actin was used as a loading control. Images were captured and optimized using a Protein Simple FluorChem E (Bio-Techne, San Jose, CA). BMI1 bands were quantified densitometrically and normalized to actin using Image J software (v1.48, National Institutes of Health, Bethesda, Maryland). Gliomas were grouped by subtype or grade and statistical significance was determined using Mann–Whitney or t tests with GraphPad Prism Software (v9.1.2).
In separate experiments, canine glioma cell lines were treated with Ambion's Silencer Negative control #1 siRNA or custom designed BMI1 siRNA (Sense: 5′ GACCUAAAUUUGUACAGUATT 3′, Antisense: 5′ UACUGUACAAAUUUAGGUCAA 3′) for 24 h as previously described16 or treated with 400 nM PTC-209 for 48 and 72 h before protein extraction and western blot analysis. Additional antibodies were used as previously described30 and a full list is included in the supplemental files (Table S1). Protein band normalization and quantification was as described above, and percent (%) change in expression relative to vehicle was determined. Experiments were repeated at least three times and representative blots are shown.
2.4 Quantitative PCR
Cells were treated with 400 nM PTC-209 for 48 h similarly as above and RNA was extracted using the Qiagen RNEasy Plus kit. RNA concentration and purity was measured by NanoDrop (A260/280 > 1.90). cDNA was generated using the Qiagen Quantitect Reverse transcription kit, and qPCR was carried out using Applied Biosystems Taqman Fast Advanced Master Mix and run on an Agilent AriaMx real-time PCR system. Taqman probes used were Cf02693025 (CDKN1A/p21), Cf02623148 (TP53) and Cf02690456 (HPRT1, control). Expression was normalized to HPRT1 and fold expression change was determined using the ΔΔCt method. Duplicate wells were used in each run and experiments were performed in triplicate. Mann–Whitney tests were used for statistical comparisons.
2.5 INK4A/ARF (CDKN2A) characterization
Genomic DNA was extracted from normal canine brain tissue and the three glioma cell lines using the Qiagen Puregene Core Kit. DNA concentration and purity was measured by NanoDrop (A260/280 > 1.80). Primers flanking a 518 bp region of exon 2 of the canine CDKN2A gene encoding components of both p16INK4A and p14ARF proteins were as follows: GGGGTAGGGGCTTCACAAAT (sense) and TACAGGTTGGCAGTGAGAGC (anti-sense). Primers amplifying an 808 bp region of the canine ERBB4 gene were used as a control. A 50 ng of DNA was added to 15 μl PCR reactions using the Qiagen Taq PCR Core Kit. PCR reactions were carried out using an Applied Biosystems SimpliAmp Thermo Cycler set to an initial denaturing of 4 min at 95°C, followed by 35 cycles of 95, 60 and 72°C for 30 s each, followed by a final 5 min elongation at 72°C. A 7 μl of PCR product was resolved on a 1% agarose gel containing ethidium bromide and imaged using a Protein Simple FluorChem E.
2.6 Immunohistochemistry
Immunohistochemistry (IHC) was performed on canine glioma tissue microarrays (TMA) as previously described34 with some modification. Steam heat citrate buffer (pH 6.0) was used for antigen retrieval and 2.5% normal goat serum for blocking. Primary antibody incubation was performed overnight at 4°C with rabbit anti-human BMI1 monoclonal antibody (Cell Signalling #6964). The isotype control used was non-specific rabbit IgG (SouthernBiotech #0111-01). Secondary antibody incubation, chromogen visualization (NovaRed, Vector), haematoxylin staining and coverslipping were as previously described.34 Images (40× magnification) were captured using a Leica DM2000 microscope and Jenoptik ProgRes C5 camera. The percentage of positively stained nuclei were manually determined for each sample (2 × 1.5 mm2 cores per sample), and independent scores from 2 investigators were averaged. Nuclei were marked positive irrespective of staining intensity and samples with staining in >20% of nuclei were considered BMI1 positive. Statistical comparisons were performed using Fisher's exact test with GraphPad Prism.
2.7 PTC-209 and chemotherapeutic drugs
PTC-209 was purchased from Sigma Aldrich (Cat # SML1143) and was dissolved in DMSO (10 mM PTC-209) and aliquoted and stored at −80°C. Temazolomide (TMZ, Cat# B1399) and Lomustine (CCNU, Cat# B1963) were purchased from ApexBio and dissolved in DMSO (TMZ 200 mM; CCNU 10 mM) and used immediately.
2.8 Cell proliferation assay
Cell proliferation was quantified using the Promega CellTiter 96 Aqueous One Solution Cell Proliferation Assay. Based on historical cell line growth kinetic data, 1000 (J3Tbg), 2000 (SDT-3G) or 3000 (G06A) cells were seeded into 96 well plates and allowed to adhere overnight. Vehicle (DMSO) or PTC-209 (100–1200 nM) was added and plates were incubated for 72 h. For combination treatments, J3Tbg and G06A cells were seeded as above followed by a 72 h incubation with vehicle, PTC-209 (200 nM), TMZ (250 μM), CCNU (10 μM) or a combination of PTC-209 and TMZ or CCNU. Assays were performed 3 times with 6 replicates for each treatment group and absorbance at 490 was measured using a Biotek Synergy H1 microplate reader. IC50 values were determined using non-linear regression analysis and statistical comparison was performed using the extra sum of squares F test. Significant effects of combination treatments were determined using one way ANOVA and Tukey's multiple comparison's test. All statistics were performed using GraphPad Prism.
2.9 Colonogenic assays
For colony forming assays, 1000 (J3Tbg), 2000 (G06A) or 3000 (SDT-3G) cells were seeded into 6 well plates and allowed to adhere overnight. Vehicle or PTC-209 (100–600 nM) was added for 24 h and then wells were washed and fresh media was added. After an additional 6 (J3Tbg) or 7 (G06A and SDT-3G) days of incubation, cells were fixed in cold methanol and stained with Crystal Violet as previously described.16 Images were obtained using a Protein Simple FluorChem E.
3 RESULTS
3.1 BMI1 protein expression in canine gliomas
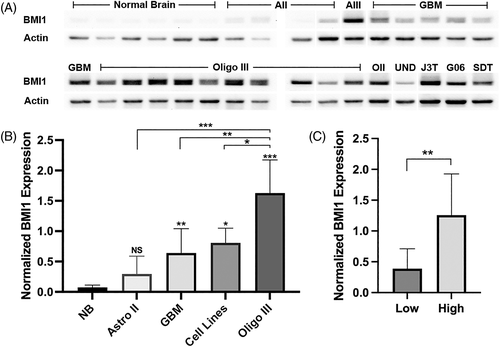
Western Blot analysis revealed increased BMI1 protein expression in canine glioma samples relative to normal cerebral brain tissue (Figure 1A). When grouped per subtype, the highest expression was observed in the grade III oligodendrogliomas, which was significantly higher than the normal brain and all other glioma subtypes (Figure 1B). GBMs and the glioma cell lines also showed significantly higher expression compared to normal brain. When samples were grouped by tumour grade, higher grade tumours (III and IV) had significantly more BMI1 expression compared to low grade (II) gliomas (p = .0063, Figure 1C).
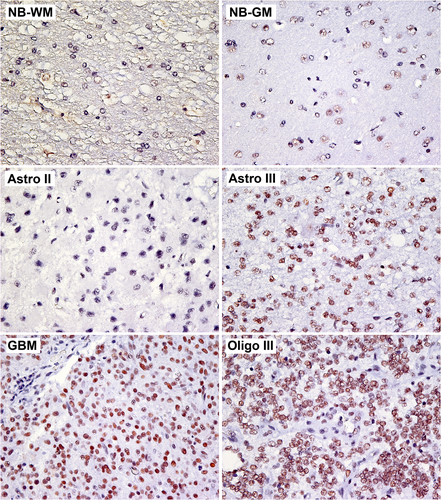
Similar to western blot data, IHC analysis revealed nuclear BMI1 staining in the majority of gliomas analysed. Staining was also observed in normal canine cerebral tissue, primarily in regions of grey matter (Figure 2, Table 1). Compared to low grade gliomas, a slightly larger percentage of high-grade gliomas showed positive BMI1 staining in at least 20% of nuclei, but this difference was not significant (p = .036).
3.2 PTC-209 inhibits canine glioma cell growth in vitro
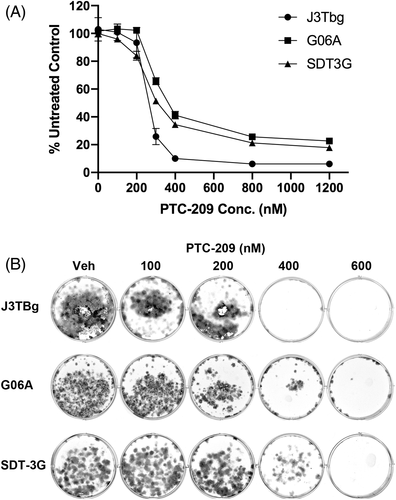
A concentration-dependent decrease in cellular proliferation was observed in all three canine glioma cell lines when treated with PTC-209 for 72 h (Figure 3A). Non-linear regression analysis showed that G06A (IC50 = 352 nM) was significantly more resistant to PTC-209 treatment compared to SDT-3G (IC50 = 310 nM, p < .0001), which was significantly more resistant to treatment compared to J3Tbg (IC50 = 260 nM, p < .0001). Clonogenic assays revealed a similar concentration-dependent decrease in the number of colonies for all three cell lines (Figure 3B).
3.3 PTC-209 enhances anti-proliferative effects of standard chemotherapies TMZ and CCNU
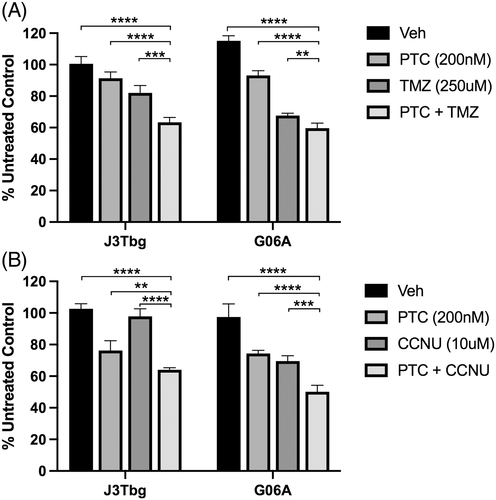
To evaluate whether PTC-209 could be effective when used in combination with commonly used chemotherapeutic drugs, cell lines were treated with a combination of PTC-209 and TMZ or CCNU. A significant decrease in cell proliferation was observed on J3Tbg (p < .001) and G06A (p < .01) with combination PTC-209 (200 nM) and TMZ (250 μM) treatment, compared to vehicle or either treatment alone (Figure 4A). A similar effect was observed in J3Tbg (p < .01) and G06A (p < .001) when treated with a combination of PTC-209 (200 nM) and CCNU (10 μM) (Figure 4B). At PTC-209 concentrations of 400 nM and above, however, no additional significant effects on proliferation were observed with combination treatments (data not shown).
3.4 Effects of BMI1 inhibition on cancer pathway proteins
3.4.1 BMI1
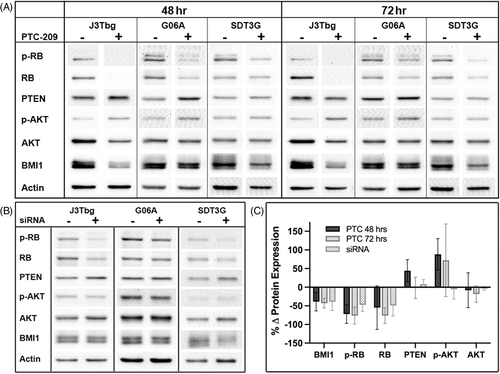
Relative to vehicle control, notable decreases in BMI1 protein expression were observed in all cell lines after 48 (mean = −38.7%) or 72 h (mean = −42.8%) of PTC-209 treatment (Figure 5), and similar decreases in BMI1 protein expression were observed following 24 h of siRNA mediated BMI1 silencing (mean = −39.1%).
3.4.2 Phospho-RB/RB
Normalized protein levels of phospho-RB and total RB decreased in all cell lines after 48 (mean p-RB = −72.2%, RB = −54.7%) or 72 h (mean = −76.1%, −76.2%) of PTC-209 treatment (Figure 5) and similar decreases in RB proteins were observed following 24 h of siRNA mediated BMI1 silencing (mean = 47.2%, 49.0%).
3.4.3 PTEN
PTEN expression increased in all cell lines after 48 h of PTC-209 treatment (mean = +44.2%), and remained elevated after 72 h of treatment in SDT-3G cells (30.8%), but dropped below baseline in the J3Tbg (−21.7%) and G06A (−14.0%) cell lines (mean = −1.8%, Figure 5). Mixed changes in PTEN expression were also observed following siRNA mediated BMI1 silencing (Figure 5), with slight increases in J3Tbg (+8.68%) and SDT-3G (+20.1%) and a slight decrease observed in G06A (−4.46%, mean = +8.1%).
3.4.4 Phospho-AKT/AKT
When treated with PTC-209, phospho-AKT expression increased in all cell lines at 48 (mean = +88.1%) and 72 h (mean = +72.2%, Figure 5). Changes in total AKT expression varied between cell lines after 48 h of treatment, with decreased expression observed in J3Tbg (−50.7%) and G06A (−15.4%) and increased expression observed in SDT-3G (+41.7%, mean = −8.1%) and this pattern was also observed after 72 h of treatment. The ratio of phospho-AKT to total AKT increased in all cell lines at 48 (mean = +162%) and 72 h (mean = +130%) of PTC-209 treatment. Following 24 h of siRNA mediated BMI1 silencing, phospho-AKT was increased in SDT-3G cells (+23.8%), but decreased in J3Tbg (−22.3%) and G06A (−19.2%, mean = −5.9%), and minimal changes in total AKT were observed (mean = −4.1%, Figure 5).
3.4.5 P53 pathway
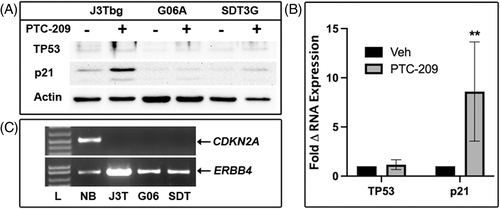
All cell lines were previously confirmed to be wildtype for TP53.32 A notable induction of p21 protein expression was observed in J3Tbg cells following PTC-209 treatment, while weak induction was observed for G06A and SDT-3G (Figure 6A). At the same time, minimal changes, if any, were observed for TP53 protein. Except for J3Tbg p21, protein bands for p21 and TP53 could only be observed after prolonged image exposure resulting in increased background noise. Consequently, densitometric quantification of these blots was unreliable. qPCR analysis, however, showed a significant increase in p21 mRNA (p = .0022) after PTC-209 treatment and no significant changes in TP53 mRNA expression (Figure 6B).
3.5 Amplification of INK4A/ARF (CDKN2A) locus in glioma cell lines
Control genomic DNA from normal canine brain was used to amplify exon 2 of the CDKN2A gene (common to both p16INK4a and p14ARF) and an amplicon of appropriate molecular weight was observed using agarose gel electrophoresis (Figure 6C). The same CDKN2A sequence was not amplified from the three glioma cell lines. Homozygous deletion of the INK4A/ARF locus was previously documented by whole genome sequencing from the parental tumours for the G06A and SDT-3G cell lines11 and in the J3Tbg cell line (unpublished data).
4 DISCUSSION
Here we report that BMI1 is highly expressed in high-grade canine gliomas and in established canine glioma cell lines. Suppression of BMI1 expression in canine glioma cells following treatment with the small molecule BMI1 inhibitor PTC-209 results in decreased proliferation in canine glioma cells alone and in combination with standard chemotherapeutic drugs and is characterized by decreased total and phosphorylated RB, and increased p21.
Protein analysis using WB revealed BMI1 expression in low- and high-grade canine gliomas. High-grade gliomas showed significantly elevated BMI1 expression compared to normal brain, and grade III oligodendrogliomas showed the highest expression relative to all other glioma subtypes. In addition, we observed significantly higher BMI1 expression in high (III and IV) grade gliomas compared to low (II) grade. IHC analysis also showed BMI1 expression in both high- and low-grade gliomas, but no significant difference between groups was observed using this method. The IHC data are in line with previous human IHC studies that also found no correlation between BMI1 immunoreactivity and glioma grade.35, 36 The discrepancy observed between WB and IHC assays can be attributed to several factors, including different sample sets, the fewer number of low grade gliomas available for WB analysis, and differences in the methodology of the assays themselves. Independent of grade, increased frequency of BMI1 immunoreactivity in human gliomas has been associated with poor patient prognosis.36 Correlation of BMI1 expression with canine patient outcome was outside the scope of this study, although such analysis should be considered in the future.
We further evaluated the role of BMI1 as a therapeutic target using the well-known small molecule BMI1 inhibitor, PTC-209, which has been shown to decrease BMI1 expression and inhibit cell growth in human glioma cell lines.23, 25 Although the mechanism through which PTC-209 inhibits BMI1 is not well understood, studies suggest it may induce post transcriptional repression and protein degradation.18, 37, 38 Our data show that PTC-209 can reduce BMI1 protein expression in canine glioma cell lines and inhibit cell growth in a dose-dependent manner. In addition, PTC-209 showed additional cytotoxic potential when used in combination with glioma chemotherapies CCNU or TMZ. Together, these data support the role for BMI1 as a valid therapeutic target for canine gliomas. It is important to note that while PTC-209 is a commercially available BMI1 inhibitor, studies have suggested that its high molecular weight and predicted liposolubility may limit its ability to pass the blood brain barrier.25 Although it has demonstrated efficacy in mouse glioma models, those results may be attributed to leaky tumour vasculature resulting from the GBM growth.25 As such, additional studies may be needed to identify the optimal small molecule BMI1 inhibitor candidate for clinical trials in dogs.
BMI1 is known to directly repress the INK4A/ARF locus which encodes the p16INK4A and p14ARF proteins. p16INK4A inhibits CDK4 and CDK6 kinase activity resulting in hypophosphorylation of RB, therefore preventing G1 to S phase progression and leading to cell cycle arrest.39 As such, BMI1 inhibition should result in increased p16INK4A expression and subsequent decreased RB phosphorylation. Although BMI1 inhibition resulted in decrease RB phosphorylation, we were unable to confirm p16INK4A as an intermediary for this mechanism. To the contrary, we previously reported homozygous deletions of the INK4A/ARF locus in the parent tumours from which SDT-3G and G06A were derived,11 which was later confirmed on both derived cell lines and J3Tbg (unpublished data), and a previous study was also unable to detect p16 at the protein level in these cell lines.30 These historical data were confirmed in the cell lines by the inability to detect CDKN2A exon 2 using PCR amplification. Together, these findings suggest the observed PTC-209 induced decrease in RB phosphorylation occurred via INK4A/ARF-independent mechanisms. In support of this, previous studies have reported that functional INK4A/ARF locus is not necessary for BMI1 oncogenic functions in a mouse glioma model15 or PTC-209 mediated inhibition of human derived glioma cell growth.27
An alternate explanation for the observed decrease in RB phosphorylation involves p21, a member of the TP53 pathway, which is known to block CDK4/CDK6 activity and RB phosphorylation in human glioblastomas and neural progenitor cells.27, 40 In the canonical TP53 pathway response, TP53 activates p21 and MDM2 inhibits TP53. Normally, BMI1 can regulate the TP53 pathway through inhibition of p14ARF, which is a suppressor of MDM2. Without functional p14ARF, however, BMI1 can still regulate the p53 pathway through direct suppression of downstream p21.27 PTC-209 treatment of canine glioma cells resulted in elevated p21 at both the RNA and protein level, with minimal, if any, observable changes in TP53. These data not only support BMI1 as a direct inhibitor of p21, but also supports a mechanism through which BMI1 inhibition may activate the RB pathway in canine gliomas. Interestingly, J3Tbg, which showed the largest induction of p21 coupled with complete abrogation of phospho-RB expression after PTC-209 treatment, was also the most susceptible to PTC-209 induced cytotoxicity. While not directly analyzed in this study, cell cycle arrest resulting from RB hypophosphorylation is one likely mechanism through which PTC-209 decreased proliferation in these cell lines. In support of this, previous studies evaluating biliary tract and cervical cancers show that PTC-209 induces cell cycle arrest at the G1/S checkpoint.41, 42
Another target of BMI1 is PTEN, a well-known regulator of the PI3K/AKT oncogenic pathway.43, 44 Inhibiting BMI1 should increase PTEN expression and subsequently, decrease AKT phosphorylation.43, 45 Consistent with this, all three cell lines showed increased PTEN expression following 48 h of PTC-209 treatment. AKT phosphorylation, however, was elevated following treatment, while total AKT expression decreased with treatment over time. These observations are counter to canonical PTEN/PI3K/AKT pathway regulation and suggest aberrant pathway signalling in these cell lines that warrants further investigation. These observations are consistent with our previous report, which found no association between PTEN expression and AKT phosphorylation in canine gliomas.30
In conclusion, BMI1 is highly expressed in canine gliomas, and increased expression may be correlated with higher glioma grade, although this observation was not consistent across assays. In addition, the BMI1 inhibitor PTC-209 demonstrates anti-proliferative activity in vitro and can be used in combination with chemotherapy, making BMI1 a promising therapeutic target for treating canine glioma patients. Furthermore, targeting BMI1 in canine glioma cells activates the RB pathway through downregulation of phosphorylated RB, potentially through BMI1 inhibition mediated upregulation of p21 and independent of INK4A/ARF signalling. Although the PTEN/P13K/AKT pathway is also affected by PTC-209 treatment, it's influence on therapeutic response is unclear.
ACKNOWLEDGEMENTS
The authors would like to thank Amber Marie Villarreal and the UC Davis VMTH pathology service for their help with immunohistochemistry and Dr Renee Amorim for her help evaluating the images.
FUNDING INFORMATION
UC Davis Center for Companion Animal Health, Maxine Adler Endowed Chair Funds, Student Training in Advanced Research (STAR) Program, National Institutes of Health/National Cancer Institute grant P30CA093373-14S4.
CONFLICT OF INTEREST
The authors declare no conflicts of interest.
Open Research
DATA AVAILABILITY STATEMENT
Data available upon request.


