The contribution of the individual blood elements to the variability of thromboelastographic measures
Abstract
BACKGROUND
Thromboelastography (TEG) is widely advocated as a rapid method for obtaining critical blood coagulation data to guide resuscitation, but the method suffers well-known limits in sensitivity, repeatability, and interpretability.
STUDY DESIGN AND METHODS
Mixtures of fresh human blood components were prepared that represent the range of blood element concentrations seen in health and disease and after injury. These mixtures were tested in a TEG device after kaolin, tissue factor and phospholipid, or tissue factor and phospholipid with abciximab activation. The results were measured as reproducibility and nonlinear effects in regression analysis and evaluated for interpretability.
RESULTS
Clot strength was associated with increased platelet (PLT) content and plasma fibrinogen concentration and content. Increasing hematocrit (Hct) reduced while increasing PLT or plasma concentration increased TEG clot strength. The abciximab dose used to block PLT activity did not fully inhibit the PLT contribution to clot strength. Clot strength is logarithmically correlated in the absence and linearly correlated to PLT concentration in the presence of abciximab. TEG clot strength with or without abciximab is dependent on Hct, PLT, and plasma (fibrinogen) concentrations in complex patterns.
CONCLUSION
Interpretation of TEG variables is limited without knowledge of the concentration of the blood components present. When “normal” TEG values are known for a certain PLT-plasma-red blood cell concentration, the assay can be used to assess PLT and plasma function in coagulation. The TEG “functional fibrinogen” assay should be used only as a gross estimate of the fibrinogen concentration in whole blood.
ABBREVIATIONS
-
- APTT
-
- activated partial thromboplastin time
-
- INR
-
- international normalized ratio
-
- MA
-
- maximum amplitude
-
- PT
-
- prothrombin time
-
- ROTEM
-
- rotational thromboelastometry
-
- TEG
-
- thromboelastography.
Thromboelastography (TEG) is used in surgical situations to provide a rapid assessment of blood clotting functions. However, the utility of TEG is limited by poor sensitivity, limited repeatability of measures, lack of external standards, and disagreement about the meaning of results. Two recent reviews, one from the British National External Quality Assessment System (NEQAS) addressing the accuracy and standardization issues finding the device essentially impossible to calibrate1 and the other from the Viscoelastic Testing in Trauma Panel2 addressing clinical usage, suggested only two situations in which the viscoelastic testing is possibly useful. TEG and a similar system called rotational thromboelastometry (ROTEM, Tem International GmbH) are comparable devices, both operating on the same basic principles. A recent Cochrane review found “no evidence for the accuracy of TEG and very little evidence for the accuracy of ROTEM.”3 For a simple device measuring force transduced through angular rotation of a small cup of coagulating blood and a pin suspended in the cup, evidence of accuracy of measurement or consistency of opinion about interpretation of the majority of results is lacking.
Part of the problem of measuring coagulation with TEG is that blood is not a homogeneous fluid. Concentrations of its components are subject to wide variability. Hematocrit (Hct), the fraction of the blood that is red blood cells (RBCs), can vary from less than 20% in patients with severe anemia to 80% in children with severe congenital heart disease. The remaining fraction, the plasma, then also varies from 20% to 80% in volume and its total content of coagulation factors, normally measured as concentrations in plasma, increases as plasma fractional volume increases. The normal concentrations of individual plasma coagulation factors are subject to wide variations which are exacerbated by injury and disease. Platelets (PLTs), the third major component of blood, also vary widely in concentration and activity but have little direct effect on the concentrations of the other components because of their small size and total volume. A major problem with interpreting TEG is that the actions of the individual components and their interactions are not linear functions of concentrations. Moreover, the way blood clotting works mechanistically in the TEG device bypasses many aspects of physiologic plasma coagulation and PLT function.
To understand these interactions better, we conducted a series of experiments mixing blood components to mimic concentrations of blood elements seen in traumatically injured and resuscitated patients and measured the results with both conventional coagulation tests and in several different commercial TEG tests. We made these measures in high replicate number and at close intervals to observe both reproducibility and natural variability. Here we describe the results.
MATERIALS AND METHODS
Human blood used in these experiments came from samples of units donated to Sanquin, the Netherlands' national blood system. Donors in the Netherlands acknowledge that part of their donations may be used for quality control (QC) and research when they donate. The Netherlands Military Blood Bank procures leukoreduced whole blood, leukoreduced apheresis PLTs, and leukoreduced apheresis plasma from Sanquin to process into −80°C frozen blood components.4 In the experiments in this study, all the blood came from aliquots left over from specimens normally used in the prefreeze QC testing performed on each product by the Military Blood Bank. Only the AB plasma pool was not from prefreeze QC testing but made from postthaw −80°C frozen apheresis AB plasma units; units were thawed for post–freeze-thaw periodic QC. After QC testing of the units, the products were pooled, split, and frozen in 10- or 50-mL tubes to −80°C.
For RBCs and plasma, leukoreduced whole blood units, stored overnight at 22°C after donation, were sampled for QC before production of −80°C frozen RBC units by the Military Blood Bank. After measurement of QC data, remaining sample volumes were stored in their sample tubes overnight at 4°C. The next day tubes were centrifuged (1408 × g, 10 min, 22°C), supernatant plasma was removed and pooled (Hct 0%), and RBC pellets were pooled (Hct 70%-80%). Samples from leukoreduced apheresis PLTs (<24-hr-old units, stored at 22 ± 2°C under continuous agitation) were drawn before the production of −80°C frozen PLTs. After QC, the tubes were pooled and part of the pool was centrifuged (18,000 × g, 10 min) to obtain PLT supernatant.
In Experiment 1, RBCs were washed and suspended in AB plasma at a Hct level of approximately 65%. Apheresis PLTs (90% plasma 10% anticoagulant) at a starting concentration of approximately 1012/L were processed to make PLT-free PLT suspending solution. RBCs in AB plasma and AB plasma with a final volume of 1.4 mL with PLTs and PLT suspending solution with a final volume of 0.6 mL were combined to make a series of reconstituted mixtures with Hct levels of approximately 0, 24, 38, and 45% and PLT counts of approximately 0 × 109, 17 × 109, 50 × 109, 100 × 109, 200 × 109, and 277 × 109/L. TEGs were measured after tissue factor activation in the presence and absence of abciximab, a monoclonal antibody (MoAb) blocking the PLT IIb/IIIa fibrinogen receptor. In two series (n = 35 samples), fibrinogen concentration was also measured (Clauss method, see below).
Thus, RBC–PLT–plasma mixtures were made in such a way that only RBC and PLT concentration varied and plasma coagulation factor concentrations remained constant. The total amount of fibrinogen present is then proportional to the plasma volume or 1 – Hct. Coagulation of blood component mixtures was measured on a TEG device (TEG5000, Haemonetics) after kaolin (TEG, Haemonetics); tissue factor and phospholipid (rapid TEG, Haemonetics); or abciximab, tissue factor, and phospholipid (functional fibrinogen TEG, Haemonetics) activation.
To study the effect of addition of fibrinogen (Experiment 2), lyophilized fibrinogen (Kordia; Enzyme Research Laboratories human fibrinogen, plasminogen depleted, lyophilized) was dissolved in saline to a concentration of 4.2 g/dL. Saline or fibrinogen in saline was added to RBC, plasma, and PLT mixtures (final Hct 25%) made as described (n = 2) and these mixtures were measured with citrated kaolin TEG.
To study the effect of plasma dilution (Experiment 3), concentrated RBCs were washed twice with thawed pooled AB plasma or saline (centrifuged at 1408 × g, 10 min, 22°C). RBCs, pooled AB plasma, saline, and different concentrations of PLTs suspended in their supernatant plasma were mixed and measured in the TEG (see Table 1 for the description of the different dilutions). Results of five separate experiments were combined.
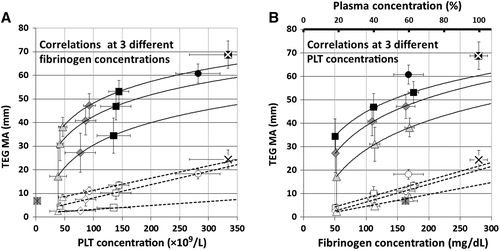
| Sample | In the presence of abciximab | Without abciximab | Plasma variables | |||||
|---|---|---|---|---|---|---|---|---|
| Plasma% | PLTs (×109/L) | R (min) | Angle (°) | MA (mm) | R (min) | Angle (°) | MA (mm) | Fib (mg/dL); pH; APTT, PT(sec); INR |
| 100% | 334 ± 67 | 1.1 ± 0.1 | 64 ± 3 | 24 ± 4 | 0.5 ± 0 | 77 ± 3 | 69 ± 6 | Fib 280 ± 14; pH 7.2 ± 0; APTT 32 ± 3; PT 15 ± 0; INR 0.9 ± 0 |
| 57% | 282 ± 39 | 1.4 ± 0.3 | 46 ± 5 | 18 ± 2 | 0.8 ± 0.2 | 68 ± 4 | 61 ± 4 | Fib 168 ± 15; pH 7 ± 0; APTT 40 ± 3; PT 20 ± 1; INR 1.4 ± 0.1 |
| 57% | 144 ± 18 | 1.5 ± 0.3 | 46 ± 6 | 13 ± 2 | 0.8 ± 0.2 | 60 ± 5 | 53 ± 5 | |
| 57% | 93 ± 11 | 1.4 ± 0.2 | 47 ± 6 | 11 ± 2 | 0.8 ± 0.2 | 54 ± 6 | 47 ± 5 | |
| 57% | 47 ± 7 | 1.5 ± 0.3 | 45 ± 5 | 8 ± 1 | 0.8 ± 0.1 | 47 ± 6 | 38 ± 4 | |
| 57% | 3 ± 2 | 1.7 ± 0.2 | 46 ± 3 | 7 ± 1 | 0.9 ± 0.1 | 45 ± 8 | 7 ± 2 | |
| 37% | 139 ± 27 | 1.9 ± 0.5 | 29 ± 5 | 10 ± 3 | 0.9 ± 0.1 | 54 ± 9 | 47 ± 6 | Fib 112 ± 7; pH 7 ± 0; APTT 55 ± 5; PT 27 ± 1; INR 2 ± 0.1 |
| 37% | 86 ± 18 | 2 ± 0.4 | 28 ± 4 | 7 ± 3 | 1 ± 0.2 | 46 ± 9 | 41 ± 6 | |
| 37% | 42 ± 5 | 2.1 ± 0.5 | 28 ± 6 | 5 ± 1 | 1.1 ± 0.3 | 39 ± 5 | 31 ± 7 | |
| 17% | 135 ± 29 | 9.3 ± 2.9 | 5 ± 2 | 4 ± 1 | 1.8 ± 0.4 | 38 ± 13 | 34 ± 7 | Fib 51 ± 2; pH 6.9 ± 0; APTT NA; |
| 17% | 77 ± 26 | 14 ± 6.3 | 3 ± 1 | 3 ± 0 | 1.9 ± 0.6 | 30 ± 11 | 27 ± 8 | |
| 17% | 38 ± 15 | 13.6 ± 1.2† | 3 ± 0† | 2 ± 0† | 3.4 ± 2.4 | 19 ± 9 | 17 ± 12 | PT 52 ± 4; INR 4.5 ± 0.4 |
- *The effect on MA is depicted also in Fig. 3.
- †n = 2 because only two of five started clotting APTT.
- NA = not achieved, no clot was formed in APTT test.
To study the potential use of TEG as a surrogate measure for plasma fibrinogen and PLT activity, Experiments 4 and 5 were performed. In Experiment 4, measures of maximum transmitted rotational force in blood element mixtures of Experiments 1 and 3, activated with tissue factor and inhibited with abciximab were compared with fibrinogen concentrations measured by the Clauss method. In Experiment 5, the maximum clot rotational force of the blood element mixtures of Experiments 1 and 3 activated with tissue factor but not exposed to abciximab were compared with their PLT count.
Mixtures were treated as citrated blood samples and measured by TEG after CaCl2 addition according to manufacturer's instructions. Different activators were used as noted above. PLT count and Hct were measured with a blood cell counter and analyzer (Sysmex KX); pH was measured with a clinical pH meter (ISTAT Abbott G3+ cartridge, Abbott Laboratories). Coagulation times (activated partial thromboplastin time [APTT], prothrombin time [PT], international normalized ratio [INR]) and fibrinogen concentration (Clauss method) were measured on the supernatant of the samples (17,000 × g for 10 min) with commercial reagents on an automated analyzer (Destiny plus, Amelung) according to manufacturer's instructions.
Data were maintained on a microcomputer spreadsheet (Excel 2007, Microsoft Corp.). Data are presented as individual measurements or mean ± standard deviation. Calculations, figures, and curve fittings were performed with intrinsic functions. Curve fitting was performed using the following functions: Linear regression y=a*x + b; logarithmic regression y=a*ln(x) + b. Statistical comparisons were performed using intrinsic statistical functions, the two-sample t test for paired data, and an analysis of variance constructed from the sum of squares functions and F-function in the spreadsheet program.
RESULTS
Experiment 1
In the first experiment, the Hct and PLT count were systematically varied while the plasma protein concentration was maintained constant (Fig. 1). Under these conditions, total plasma protein increases as the plasma fractional volume increases (Hct decreases). Tested this way, the increasing amount of fibrinogen in the cup (volume times concentration) led to a successively stronger clot as Hct declined (Fig. 1A). However, the increase in fibrinogen content did not translate into a linearly stronger clot, going from 22 to 50 mm at a PLT count of approximately 25 × 109 PLTs/L to 55 to 70 mm at approximately 170 × 109 PLTs/L. At each Hct, increasing PLT concentration led to increasing clot force transmission in a seemingly logarithmic relationship between total PLT number and increasing clot strength.

In the second part of the first experiment (Fig. 1B), the same mixtures were activated with tissue factor and phospholipid in the presence of abciximab, a MoAb interfering with the interaction of PLTs and fibrin in clot retraction. Under these conditions, force transmitted increased as Hct declined and total fibrinogen content in the cup increased, but also linearly increased as PLT count increased. Again clot strength increased more than fibrinogen content increased, so the differences represent both a negative effect of the RBCs and a positive effect of the PLTs.
In a third part of the first experiment the effect of Hct on the rate of clot force transmission development (TEG angle) was measured (Fig. 1C). Despite identical plasma protein concentrations, the rate of force development was lower in the presence of increasing amounts of RBCs, but this effect was partially offset by increasing numbers of PLTs.
Experiment 2
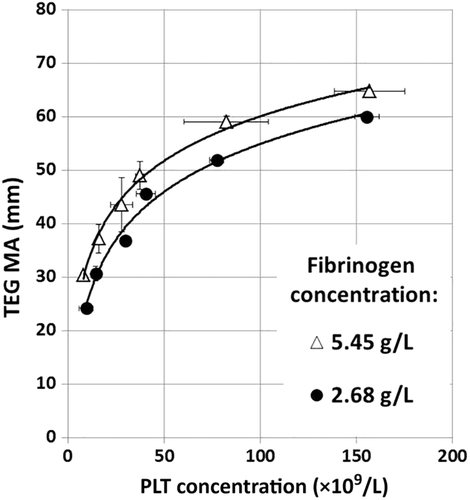
In the second experiment, commercial fibrinogen concentrate was added to increase the plasma concentration to twice normal (approx. 540 mg/dL) and this was compared to plasma samples with normal fibrinogen concentrations (approx. 270 mg/dL) in blood mixtures with a constant Hct (Hct 24% ± 0.4%) and increasing numbers of PLTs. Under these conditions, clots transmitted approximately 5 mm more force at each PLT concentration, showing the same nonlinear effects of both fibrinogen and PLT concentration (Fig. 2).
Experiment 3
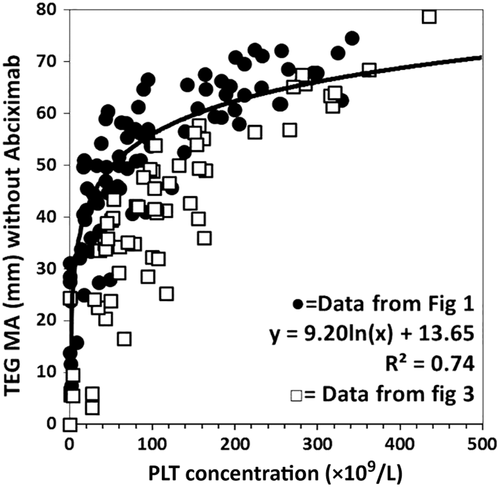
In the third experiment, the Hct was kept constant at approximately 32% while the PLT count and the plasma protein total amount were varied independently (Table 1, Fig. 3). When activated with tissue factor, the maximum amplitude (MA) of transmitted force increased as the logarithm of the PLT count or fibrinogen concentration when the other was held constant. When the system was activated with tissue factor and simultaneously poisoned with abciximab, the amplitude of maximal transmitted force was markedly reduced. The response to increasing concentrations of PLTs or fibrinogen in the presence of fixed concentrations of the other was linear.
Experiment 4
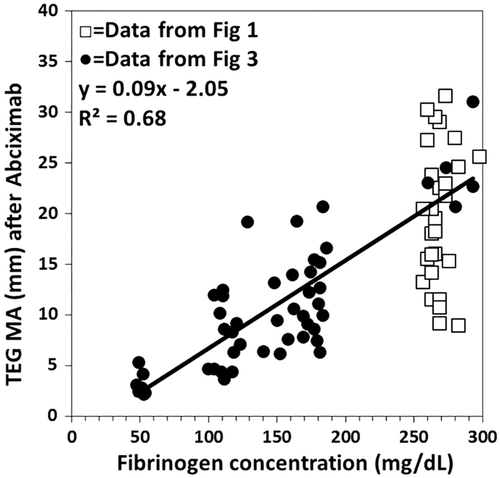
In the fourth experiment, the MA of transmitted force of individual TEG runs from Experiments 1 and 3 activated with tissue factor in the presence of abciximab was compared to the fibrinogen concentration measured on the mixture by the Clauss method (Fig. 4). While there was a significant correlation of the data from samples of Experiment 3 where the Hct was kept constant, it was poor enough to have little discriminant value over the clinically significant range of 100 to 200 mg/dL of fibrinogen due to differences in PLT concentration. When the data of Experiments 1 and 3 were combined the correlation was reduced due to differences in Hct and PLT concentration.
Experiment 5
Finally, the relationship between the PLT count and maximum force transmitted was investigated on the same set of TEG runs without abciximab (Fig. 5). In both Experiment 1 and Experiment 3 the same logarithmic relation of PLT count to transmitted force was found as noted above and accounted for approximately 70% to 74% of the variability in the observed measures. When the data of Experiments 1 and 3 were combined the correlation was reduced due to differences in Hct and plasma concentration.
DISCUSSION
TEG has been available for more than 60 years and has gone through cycles of enthusiasm and disrepute.5, 6 Simple review of the histogram of the year of publication of the 5221 articles listed in PubMed under “thromboelastography” in August 2017 showed an increasing number of yearly publications from its invention in 1948 to 1970, a subsequent 92% decrease in publications between 1970 and 1988, and another increase between 2004 and 2015 to 315 articles in that year. We interpret the recent publication activity as reflecting the behavior of the manufacturers in giving away TEG machines to surgical investigators who promised to publish their results or ROTEM equipment if promising to buy fibrinogen concentrate for clinical use.
At present there is enthusiasm for the clinical use of TEG at the end of cardiopulmonary bypass where a reduced clotting response can indicate a need for component therapy leading to faster hemostasis and reduced overall blood use and, conversely, where a normal TEG leads to renewed efforts at surgical hemostasis resulting in faster hemostasis and reduced overall blood use.7, 8 There is also enthusiasm for its use in trauma surgery to provide early goal-directed therapy in massive transfusion situations to address specific deficits in early plasma coagulation factors, PLTs, or fibrinogen or excessive fibrinolysis.9 The Cochrane database review showed, however, that the level of evidence to justify this enthusiasm for TEG use in trauma remains low.8 Pathologists have generally been less enthusiastic about TEG testing because of poor reproducibility of TEG results in split-sample testing, as well as further problems in day-to-day, machine-to-machine, and operator-to-operator variability.10, 11 Hematologists have been concerned with the questions of what observed abnormalities mean and how one uses observed abnormalities to guide rational therapy.12
In our series of experiments, we confirmed a number of previously observed problems with the TEG as diagnostic test and therapeutic guide. First, the effects of the concentration of fibrinogen and PLTs, the major constituents of clot, are not linearly related to the critical output, the MA of generated force. Second, increasing Hct displaces plasma, increasing the relative concentration of PLTs in the remaining plasma at fixed PLT counts in the total blood volume and decreasing the total content of fibrinogen. Third, blocking the PLT fibrinogen receptor with abciximab does not completely eliminate the effect of PLT count on MA of transmitted force. This means that, fourth, the measured MA of force has little discriminate value to assess the fibrinogen concentration. Fifth, the PLT concentration is also poorly correlated with the MA of measured force such that TEG has limited ability to discriminate PLT counts or that PLT function is highly variable from one individual to the next.
In the similar ROTEM device, Hct affects clot strength13 and the ROTEM inhibitor used to visualize the fibrinogen contribution to clot strength, cytochalasin D, does not completely eliminate the PLT contribution to clot strength.14 Neither TEG nor ROTEM can be used to measure fibrinogen concentration or PLT function reproducibly, especially not if the Hct is not stable.
But if TEG appears to perform so poorly as a clinical test of coagulation, why does it work well to reduce blood usage in cardiac surgery? The answer would appear to be that TEG provides a signal that something is wrong rather than a specific indication of what is wrong with coagulation.15 By indicating that coagulation is normal, it leads to a reinspection for surgical causes of bleeding and by indicating coagulation dysfunction, to earlier provision of plasma and PLTs leading to an earlier balanced hemostatic resuscitation with better outcomes.16
Equally rapid guidance for hemostatic resuscitation is available with a “super stat” emergency hemorrhage panel as described by Chandler.17 This combination of a Hct and PLT count from a hematology analyzer and PT and Claus fibrinogen on a coagulation analyzer can have a 12-minute turnaround time. It is more accurate and more directly indicative of treatment than the TEG, as there is a one-to-one correspondence with the Hct and administration of RBCs, PLT count and administering PLTs, PT and plasma, and fibrinogen and cryoprecipitate. The emergency hemorrhage panel does require a laboratory organized to provide it quickly.
TEG is promoted to surgeons and anesthesiologists as a tool for guiding component-specific therapy in hemostatic resuscitation. It generally performs poorly in that role because it has limited sensitivity, reproducibility, and interpretability. More accurate and directly interpretable tests are available. TEG can be used in research settings where paired or repeated measures reduce variance18, 19 and as a marker of severe coagulopathy or fibrinolysis in clinical care.20
ACKNOWLEDGMENTS
The authors thank Lt Col M. Zoodsma, PhD, Military Blood Bank, the Netherlands for her critical review and Sgt J. van Wingerden and Sgt M. Maarsseveen, Military Blood Bank, the Netherlands, for their technical support.
CONFLICT OF INTEREST
The authors have disclosed no conflicts of interest.


