Mapping urban large-area advertising structures using drone imagery and deep learning-based spatial data analysis
Abstract
The problem of visual pollution is a growing concern in urban areas, characterized by intrusive visual elements that can lead to overstimulation and distraction, obstructing views and causing distractions for drivers. Large-area advertising structures, such as billboards, while being effective advertisement mediums, are significant contributors to visual pollution. Illegally placed or huge billboards can also exacerbate those issues and pose safety hazards. Therefore, there is a pressing need for effective and efficient methods to identify and manage advertising structures in urban areas. This article proposes a deep-learning-based system for automatically detecting billboards using consumer-grade unmanned aerial vehicles. Thanks to the geospatial information from the drone's sensors, the position of billboards can be estimated. Side by side with the system, we share the very first dataset for billboard detection from a drone view. It contains 1361 images supplemented with spatial metadata, together with 5210 annotations.
1 INTRODUCTION
In the literature, visual pollution is defined as any element in the landscape that is mismatched with the place and causes an unpleasant, offensive feeling (Nagle, 2009). “Visual pollution is also the result of design out of context with the environment or already existing elements” (Sumartono, 2009). With cities' continued growth and evolution, visual pollution from advertising has become an increasingly pressing issue in urban environments. What is more, as indicators suggest, the advertising market will grow. Popular indicator, Out-of-Home (OH) Advertising (Wilson, 2023), estimates that the market value grew from $29.8 billion in 2023 to $31.7 billion in 2024 and is expected to develop from $38.39 billion in 2028.1 While these numbers do not indicate it directly, they can suggest a potential increase in visual pollution. However, the issue has attracted the attention of researchers and the need to investigate the impact of visual pollution on perceived environmental quality was discussed (Cvetković et al., 2018). The researchers identified and compared legal provisions on advertising policy to find risks and opportunities (Szczepanska et al., 2019). Some researchers also tried to measure visual pollution levels, contributing to land planning improvement (Chmielewski, 2020; Wakil et al., 2019).
Urban environments typically exhibit a diverse array of visual stimuli. However, not all of these are necessarily positive or desirable. One specific type of urban visual pollution is billboards located along roads, mounted on dedicated infrastructure, or on the walls of buildings. Although billboards can serve as effective advertising tools (Gebreselassie & Bougie, 2019; Taylor et al., 2006), they can also pose significant hazards to traffic. The literature has focused, among others, on pedestrian distraction on road crosses, showing that environmental complexity affects the dispersion of visual attention (Tapiro et al., 2020). The influence of near-road advertisements has also been investigated for drivers' behavior (Madlenák & Hudak, 2016). The results showed an impact on drivers' inattention, increasing the distraction time from 0.25 to 2.0 s compared with the road signage. A similar effect was observed in another research (Edquist et al., 2011), in which a simulator study showed that attention was being absorbed by advertisements, which increased reaction times to road signs and the number of driver errors. Even though it is not possible to conclude that there is a direct relationship between changes in driving behavior that can be attributed to roadside advertising and subsequent road accidents (Oviedo-Trespalacios et al., 2019), urban planners try to limit visual pollution caused by billboards (Płuciennik, 2018; Rahmat, Purnamawati, et al., 2019; Wakil et al., 2021). As highlighted, the visual pollution caused by advertising structures extends beyond illegal placements (Sedano, 2016). Legally placed advertisements often exceed permitted standards and regulations, exacerbating the problem, especially when new regulations are introduced, like the “landscape resolution” in Poland (Czajkowski et al., 2022). To efficiently assess and monitor the presence of these structures regularly, it is necessary to develop methods to automatically measure their location and size accurately, enabling their comparison with the database and checking for conformance with the local law regulations. This automatization can help better manage advertising structures and mitigate the negative impacts of visual pollution in urban environments, especially in cities with limited data availability. One way to meet these requirements is thanks to the utilization of unmanned aerial vehicles (UAVs), which have become increasingly popular for performing various tasks, including automatic mapping and monitoring of outdoor environments (Guan et al., 2022; Tsouros et al., 2019). Although local restrictions can limit their usage in some cities, their popularity and usage still increase (Mohsan et al., 2023). UAVs are not subject to the same traffic restrictions as ground vehicles, allowing for more efficient data collection and periodic analysis. Another benefit of using UAVs is the larger field of view (FOV), which allows the analysis of wider areas in a single pass, enabling monitoring of large-scale outdoor environments.
- We collected the dataset of 1361 images with 5210 labels (segmentation masks and bounding boxes) of billboards in urban environments from UAV view.
- We performed the research in methods of efficient deep neural networks for billboard detection with instance segmentation of their surface.
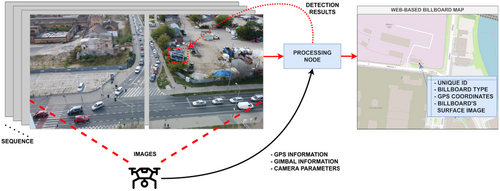
- We proposed a spatial system that detects billboards in video recordings and maps them to GPS coordinates based on UAV's sensors. The estimated coordinates were compared with the ground-truth locations.
2 RELATED WORK
2.1 Billboard recognition systems
In 2018, a method for automatic video frame classification to identify frames that include outdoor advertisements was proposed (Hossari et al., 2018). This method represents the first effort to use deep neural networks to identify advertisements in video frames. It identifies billboards' presence in video frames through the binary classification task. Next, a deep learning algorithm was presented to classify the presence of the ad in the image (Rahmat, Dennis, et al., 2019). It is combined with geolocalization data from mobile phones to provide location in the wild. Another method employs machine learning and OCR to extract information from billboard images taken by phone and compare them with a database, allowing to classify whether the billboard placement is legal or not (Liu et al., 2019).
The development of deep neural networks and the growth of computational capabilities pushed the research of object detection methods forward (Zou et al., 2023). Initially, the Single Shot MultiBox Detector (SSD) and You Only Look Once (YOLOv3) were compared in the detection of ad panels task, “Both detectors have been successfully able to localise most of the test panels” was written (Morera et al., 2020). The SSD model was also used with the transfer learning technique (Chavan et al., 2021). The authors created a private dataset of billboards captured in first-person view, resulting in 1052 images, and prepared annotations of each one using bounding boxes. The proposed model reached an average precision (AP) of 59.79 on their dataset. In recent years, an in-depth study was presented (Motoki et al., 2021) where authors constructed two models: for object detection targeting billboards in images and for extracting multiple features from billboards, such as “genre,” “advertiser,” and “product name.” The authors compared two model architectures: YOLOv4 (Bochkovskiy et al., 2020) and YOLOv5 (Jocher et al., 2020) on their in-house dataset, reaching the AP of 0.53 and 0.57, respectively. The authors of (Palmer et al., 2021) proposed the procedure of detecting and analyzing urban advertising on 360° street view images. The large-scale collection of images was prepared to classify unhealthy ads. They utilized the out-of-the-box tool for semantic segmentation of street view images (Porzi et al., 2019) and classified the billboards' pixels. The validation dataset consisting of 4562 billboards with an area >2000 pixels was created to evaluate this approach. The model achieved the Intersection over Union (IoU) score of 0.458. Moreover, their analysis shows that “143 items were falsely classified as billboards, consisting of street signs, blank surfaces, traffic lights, and interestingly clock faces.”
Despite algorithms development using deep learning to detect billboards in images, none currently fulfill the criteria for automatically or semi-automatically mapping large-area advertising in drone imagery. The analysis of images acquired by drones necessitates addressing a series of challenges (Srivastava et al., 2021), particularly stemming from the diverse perspectives and varying sizes of objects. One major limitation is the spatial resolution of captured images, which is typically limited due to the UAV altitude and specific camera perspective, allowing to capture only large-size ads. This contrast is particularly noticeable compared with earlier datasets that did not involve drones (see Figure 2). Considering those challenges, we propose the first approach aimed at detecting billboards from UAVs and using both spatial and temporal information to improve the estimation of billboard locations.

2.2 Efficient instance segmentation methods
Recent developments in the computer vision field have significantly advanced the accuracy and efficiency of object detection models. Among these advances, the YOLO (You Only Look Once) family of models has garnered significant attention due to its good balance between high accuracy and inference speed (Terven & Cordova-Esparza, 2023). YOLOv7 (Wang et al., 2022) and YOLOv8 (Jocher et al., 2023) are the latest iterations of the YOLO model, and they build upon the success of their predecessors by introducing a new network architecture and the “Trainable Bag of Freebies.” These enhancements have resulted in higher accuracy and faster processing times, making them a viable choice for various applications such as autonomous operation, surveillance systems, and object tracking (Chen et al., 2023).
However, one limitation of these models is that they only provide bounding box predictions, which can lead to the imprecise computation of the object's extent, especially when its shape is not rectangular. To overcome this limitation, the extension has been proposed (Bolya et al., 2019). This model's modification involves adding an instance segmentation head to the network architecture of the previous YOLO version. This head computes pixel-wise segmentation masks that provide a more detailed understanding of the spatial distribution of the object in the image. The instance segmentation head calculates prototypes that represent the average feature vectors of all the pixels within each object and then, based on those prototypes, generates the instance segmentation masks. It is more efficient than classical pixel-wise segmentation because it significantly reduces the number of trainable parameters in the network, affecting more effective feature representations.
3 DATASET
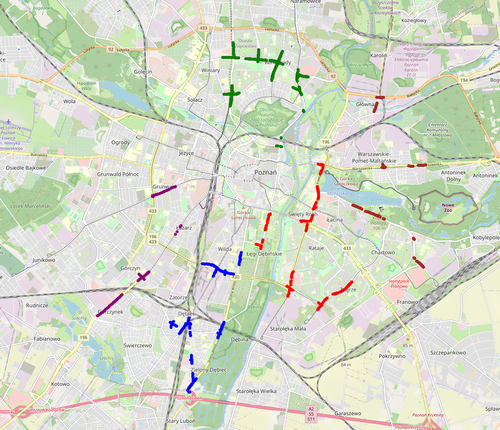
The newly introduced UAVBillboards dataset contains images of billboards captured in urban environments, within the city of Poznan, Poland (located 52.4005308, 16.7457885 in decimal degrees). This medium-sized city exhibits a compact urban core, transitioning to peri-urban zones characterized by expanding residential areas and wide roads, interspersed green spaces. The recordings were performed using an inexpensive DJI Mini 2 consumer drone at an altitude between 28 and 35 m, enabling monitoring of most of the city's main roads in compliance with local flight limitations and general European regulations (https://www.easa.europa.eu/en/the-agency/faqs/drones-uas). The drone's flight paths were designated along the centers of roads with a speed of about 10 m/s, and the camera oriented forward in line with the direction of flight, performing double passes in opposite directions to capture images of both sides of billboards. The gimbal orientation was set to within the range of (−30, −20) degrees in the pitch axis, providing a good trade-off between a wide FOV and a low perspective distortion at those altitudes. Images were collected in various weather conditions and during daylight hours at different times of day, generating bright and dim sunlight or cloudy environments, covering the period of autumn 2022 and spring 2023. Monitoring each of these regions only once during this time and mixed weather and lighting conditions contributed to the diversity of the dataset. The monitored roads are chosen due to the largest concentration of wide-area advertising, following the main thoroughfare of each road. Using GPS coordinates, a map of images containing billboards was generated (see Figure 3). This map also includes color indications of the five GPS-based splits, each representing a different landscape view characterized by varying levels of greenery (from none to high), building heights (townhouses, apartment blocks, and low-rise buildings), road types (streets, and multi-lane arteries), and architectural styles (industrial, residential, and recreational). The dataset comprises 1361 images with resolutions of 3840 × 2160 and 4000 × 2250 pixels, each enriched with additional geolocation metadata to identify the image capture location. Additionally, 5210 manually annotated labels were prepared for the instance segmentation task and stored in the commonly used COCO format (Lin et al., 2014). Our labeling process involved two independent labelers, limiting the considerable errors that can occur and ensuring data quality through individual validation for each image.
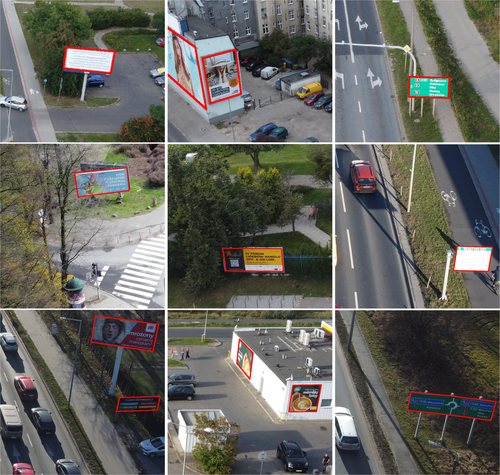
- free-standing—the billboard stands as an individual construction, often on one or two supports. For the class, there are no significant sources of labeling uncertainties. They are usually legible and turned perpendicular to the road.
- wall-mounted—the billboard is placed on the wall of some other structure, for example, a building. For the class, many sources of uncertainty exist in labeling, especially in missing labels because of difficulty in identifying them caused by high yaw rotation between camera and object or advertisements on bus stops that are relatively small and could be missed during the labeling process.
- large road sign—additional class. The class represents road signs whose position and size are similar to billboards. For the class, uncertainties of labeling can occur in missing labels when their size is recognized as not too large (not similar to billboard size). These class labels are used in the training process to help differentiate between road signs and advertisements and can be ignored in the final application.
The example fragments of images with labels for each object class are displayed in Figure 4. As shown in Table 1, free-standing objects constitute a significant majority, accounting for 70.9% of all labels. Despite this class being characterized by the highest size average, it still occupies a relatively small portion of the overall image. Their average size is 306.8 × 202.4 pixels, encompassing a mere 9.7 × 6.4 percent of the entire image area. The second most common class, wall-mounted billboards, are markedly less numerous (24.6%) and smaller on average, posing more of a challenge for the algorithms. The last class is large road signs, which are similar in size to the previous class and may provide notable improvement in dealing with false-positives.
| Label category | Count | Mean size | Mean size (relative) |
|---|---|---|---|
| Free-standing billboards | 3694 | (306.8, 202.4) | (0.097, 0.064) |
| Wall-mounted billboards | 1284 | (171.7, 145.7) | (0.049, 0.042) |
| Large road signs | 232 | (131.4, 102.0) | (0.039, 0.032) |
4 BILLBOARD DETECTION AND MAPPING SYSTEM
This section provides a detailed description of the application. The process begins with camera calibration to reduce image distortion. Next, the application segments object instances to identify billboards within the frame. Following that the in-frame assignment of detected billboard instances is performed between successive images. Finally, the application estimates the relative position of the billboards based on the calibrated camera data and UAV sensors. It calculates their GPS coordinates. The below-described calculations are performed for each video frame separately, considering each billboard instance. Then, to group the appearances of the same billboard, the aggregation based on object tracking is used. Finally, to obtain the GPS coordinates of billboards, the median values of predictions are selected.
4.1 Camera calibration
Camera calibration is crucial for the computer vision application that measures real-world distances, especially in drone imagery, because camera distortions caused by the lens can significantly contribute to imprecise determination of spatial localization of objects. Therefore, camera calibration corrects these lens distortions and determines the camera's intrinsic parameters. These intrinsic parameters define the inherent optical characteristics, such as focal length and lens distortion coefficients, that influence how the 3D world is projected onto the camera's 2D image plane. With accurate intrinsic parameters, mapping the 2D image coordinates of the billboard back to its accurate real-world measurements becomes possible. As described in Zhang (2000), the camera calibration process typically involves capturing images of a special calibration target with a known pattern of points. The algorithm can estimate the intrinsic camera parameters that minimize the re-projection error by analyzing these images. Re-projection error refers to the average distance between the established and estimated point's location on calibration images based on the estimated intrinsic parameters and the known 3D location of the point on the calibration target. Our calibration process reached the re-projection error of 0.0456 pixels, indicating the estimated intrinsic parameters accurately model the camera's distortions.
The calibration process is required for each individual camera, even within the same drone model, as slight manufacturing variations can affect their intrinsic properties. Furthermore, the camera sensor must be autofocus-free or set to autofocus-free mode to ensure a constant focal length. Any focal length or zoom changes would require re-calibration because these parameters influence image formation and distort the computed distances.
4.2 Instance detection and surface segmentation
When the camera is calibrated and each obtained frame is rectified from distortions, the billboard detection model is applied to recognize objects in an image. However, instead of classical object detection with bounding boxes, an instance segmentation algorithm is applied to determine the billboards' surface. Aside from detecting the bounding boxes, it provides pixel-wise segmentation of an object, allowing for a more fine-grained understanding of the spatial distribution and characteristics. For example, it can be used in the future to estimate ad sizes, as it provides a precise indication of the exact border of the area covered by each billboard in an image.
4.3 Inter-frame association
Since the instance segmentation model operates on individual images, the inter-frame association becomes necessary to match detected billboards across consecutive frames. Accurate association between frames is crucial for maintaining the consistency and continuity of object tracking, avoiding duplicates. This association strategy follows the “detect to track” approach (Feichtenhofer et al., 2017). Consequently, the tracking quality heavily relies on the detection precision, significantly influencing the overall system performance. To address this challenge, the current state-of-the-art method called ByteTrack (Zhang et al., 2022) is applied. The method associates bounding boxes by measuring the mutual coverage area and calculating the visual similarity of learnable features. It differs from the previous methods by matching every detected bounding box, including those with low detection scores, which improves performance with occluded objects. Due to the similarities between low-scoring detection boxes and tracks, it recovers true objects and eliminates background false-positives.
4.4 Billboard localization estimation
When a billboard is detected, and the camera is calibrated, its relative position to the camera can be estimated. The following section describes this estimation process step by step. Additional information from drone sensors is required to calculate real-world billboard position. Various measurements, such as the coordinates of latitude (lat) and longitude (lon), as well as altitude above ground (alt) can be easily obtained from the drone GPS sensor. Furthermore, the drone software provides information about its orientation, expressed as three angles: roll, pitch, and yaw. In the same way, the information about the gimbal's tilt, indicated by the angle α, is obtained. The camera FOV on both the horizontal and vertical axes denoted as FOVH (74.3°) and FOVV (46.2°) are taken from drone documentation. Those values are presented in Figure 5 and are used in the following section to estimate the billboard's position in the real world.
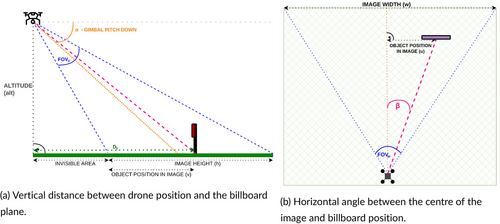
When the relative D distance and the angle β are estimated, the GPS coordinates of the billboard are calculated. This transformation is based on the actual drone's GPS position (lat, lon) and the drone's flight path forward azimuth (az) that describes the drone's flight direction. This information is read from the drone sensors. Then, the billboard GPS coordinates are obtained by incorporating those variables and geodetic forward transformation.
5 INSTANCE SEGMENTATION MODEL EVALUATION
In this section, three popular neural network architectures: YOLOv7, YOLOv8-L, and YOLOv8-X were selected for evaluation of the billboard instance segmentation task. A series of experiments was conducted to select the best model for our dataset.
5.1 Models evaluation metrics
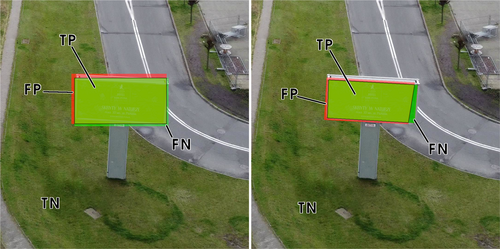
The mask mean average precision (mask mAP) is used as the evaluation metric to assess the precision of instance segmentation models. It measures how good the predicted billboard masks are, measuring mask intersection over union (mask IoU). Unlike the classical IoU for bounding boxes (used in object detection tasks), the mask IoU metric is computed between two masks, providing a more fine-grained and accurate assessment of the model's performance. The mask IoU is calculated based on the overlap between the positive values of the ground-truth mask and the predicted one. It is mathematically defined as: IoU = TP/(TP + FP + FN), where TP, FP, and FN represent True-Positives, False-Positives, and False-Negatives, respectively. The visual representation of the differences between IoU for bounding boxes and masks can be found in Figure 6. Mask mAP is calculated by considering detections at different confidence score thresholds, typically ranging from 0.5 to 0.95. A precision-recall curve is generated for every threshold level, and the AP is calculated as the area under this curve. Finally, the mask mAP is computed as the mean AP across multiple IoU thresholds. This incorporates the trade-off between precision and recall and provides a more complete evaluation of the model's performance. In addition, one specific value reported mask [email protected], which refers to the mask mAP calculated using an IoU threshold of 0.5 and represents a balance between how precise and how well-recalled the detections are, being sufficient to consider a detection accurate for many real-world applications.
5.2 Dataset preparation
Referring to Section 3, the dataset has sequential characteristics and was collected in five separate city areas. Therefore, we perform a 5-split geolocalization-based division into five subsets for training purposes. Unlike classical random data shuffling, this approach is closer to real-world use cases, allowing one to examine the models' generalization abilities to handle overfitting issues and indicate how the models handle images from other regions. Table 2 shows the statistics for each split.
| Split 1 | Split 2 | Split 3 | Split 4 | Split 5 | |
|---|---|---|---|---|---|
| Images | 218 | 117 | 510 | 261 | 255 |
| Free-standing billboards | 655 | 212 | 1590 | 352 | 885 |
| Wall-mounted billboards | 99 | 207 | 444 | 172 | 362 |
| Large road signs | 27 | 30 | 41 | 65 | 69 |
5.3 Training process details
All experiments were conducted with the identical hyperparameters. The SGD optimizer (Sutskever et al., 2013) was used with an initial learning rate of 0.01, along with a learning rate scheduler with a warm-up phase was applied. Because we consider single-stage models, the training process was performed jointly for the backbone and both heads—for bounding boxes and mask prototypes.
Additionally, several regularization techniques were employed to address the relatively small dataset size challenge and enhance the method's generalizability. All model parts, such as the backbone, the object detection head, and the instance segmentation head, were initially pre-trained to benefit from large datasets (Huh et al., 2016; Risojević & Stojnić, 2021), like the COCO dataset (Lin et al., 2014). In the data preprocessing step, the upper part of the image is cut out due to distortions from a high-perspective view to be divisible into two squares. Next, the image squares are resized to 960 × 960 pixel to match the resolution required by the model input layer. Lastly, augmentations were used to improve model performance. In particular, both single-image augmentations (rotations, translations, color jitter) and multi-image augmentations (mosaic, as introduced in Bochkovskiy et al. (2020)) were applied to enhance generalization and reduce overfitting.
5.4 Models evaluation results
Each model was evaluated in 5-split cross-validation, according to the GPS-based division described in Section 3. Each split contains three subsets for training, one for validation, and one for the testing step. Then, the average and standard deviation of the metrics were calculated.
Model performance analysis shows that free-standing billboard detection is generally more accurate with all models compared with wall-mounted billboards for the test subset. The difference may be because free-standing billboards are statistically larger and more frequent in the dataset. In addition, they are more visually distinct from their surroundings, while wall-mounted billboards can blend in with the background or be partially obscured by other objects. Free-standing billboards often have a more consistent orientation and placement, making them easier to detect and classify accurately. The detailed results are in Table 3. It is observed that YOLOv8-X reaches better test mask [email protected] (0.751 ± 0.121) and mask mAP (0.601 ± 0.121) for the free-standing class, having, at the same time, the lowest standard deviation. However, for the wall-mounted class, the results are not conclusive. Focusing on mask [email protected], YOLOv7 achieved better metrics (0.389 ± 0.096) compared with YOLOv8-X (0.376 ± 0.097). Similar conclusions can be observed for the second metric, where YOLOv7 (0.293 ± 0.096) is better than YOLOv8-X (0.291 ± 0.085).
| Model | Mask [email protected] | Mask mAP | ||
|---|---|---|---|---|
| Free-standing | Wall-mounted | Free-standing | Wall-mounted | |
| YOLOv7 | 0.742 ± 0.153 | 0.389 ± 0.096 | 0.572 ± 0.128 | 0.293 ± 0.096 |
| YOLOv8-L | 0.719 ± 0.151 | 0.362 ± 0.099 | 0.575 ± 0.129 | 0.275 ± 0.089 |
| YOLOv8-X | 0.751 ± 0.121 | 0.376 ± 0.097 | 0.601 ± 0.121 | 0.291 ± 0.085 |
5.5 Final model for the application
Ultimately, to train the final model for the application, the YOLOv8-X was selected because it achieved the best overall metrics for the free-standing billboard class, the most important class for our application, and exhibited the most consistent performance across all models as indicated by the lowest standard deviation. Concentrating on selected architecture, the new training, validation, and testing splits were created. This is motivated by creating a model trained in all city regions, increasing generalization ability. Considering dataset splits and their sequential characteristics, the first and last 20 samples are selected for new validation (100) and testing (100) subsets. The rest of the images are used as a training set, resulting in 1161 images.
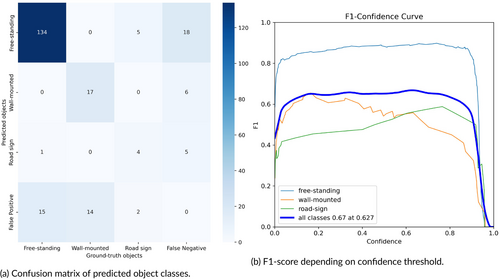
Table 4 summarizes the results for the final model. The results are higher than those obtained during the training on splits, but direct comparison is not possible due to the use of different test sets. For the free-standing billboard, the mask [email protected] is 0.927 and mask mAP is 0.778, showing good generalization ability. For the wall-mounted billboards, the results are worse. mask [email protected] and mask mAP are 0.611 and 0.432 for this class. Referring to the confusion matrix plot (Figure 7a), these lower metrics are likely caused by the higher rate of false-positives. This could be due to cluttered backgrounds around wall-mounted billboards or limitations in the data for this category caused by their size and installation method. In this evaluation, the results for large road signs are also reported to demonstrate their influence on misclassifications with other classes, indicating the model's robust ability to distinguish between them and billboards. Analyzing the F1-Confidence plot (Figure 7b), it is observed that the confidence threshold has no significant impact on free-standing, while a higher threshold decreases the results of wall-mounted, illustrating the model's lower confidence for this billboard type.
| Mask [email protected] | Mask mAP | ||||
|---|---|---|---|---|---|
| Free-standing | Wall-mounted | Large road sign | Free-standing | Wall-mounted | Large road sign |
| 0.927 | 0.611 | 0.472 | 0.778 | 0.432 | 0.408 |
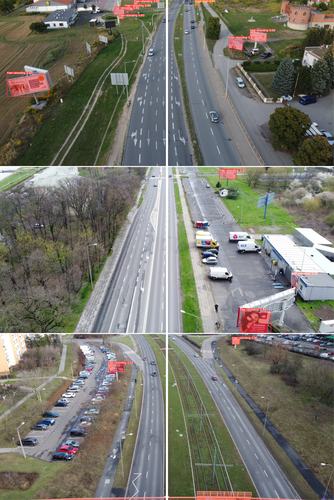
Sample model outputs with visualized segmentation masks are presented in Figure 8. They demonstrate the correctness of predicted bounding boxes and object masks in images from the test subset. We observe that the precision of the model drops, especially in two cases: when the object is too close and is too large to fit entirely in the image and when the object is too small due to perspective and distance from the camera.
6 MAPPING SYSTEM EVALUATION
In this section, the application performance in a real-world setting was validated. The evaluation is conducted by comparing the predicted GPS coordinates of billboards with ground-truth coordinates.
6.1 Methodology
The ground GPS coordinates of 25 free-standing billboards were estimated based on recorded videos. The reference locations of objects were inferred from the precise orthophoto (with a ground sampling distance of 3 cm/px) of the city of Poznań (SIP Poznań, 2023). Using the geodetic distance (in meters), which uses the shortest curve between those two points along the surface of the Earth model, the distances between predicted and ground-truth coordinates were calculated. Then, the mean absolute error (MAE) is employed to analyze the system's performance in the real world and provides a quantitative measure of the estimation method's performance.
6.2 Real-world coordinates evaluation
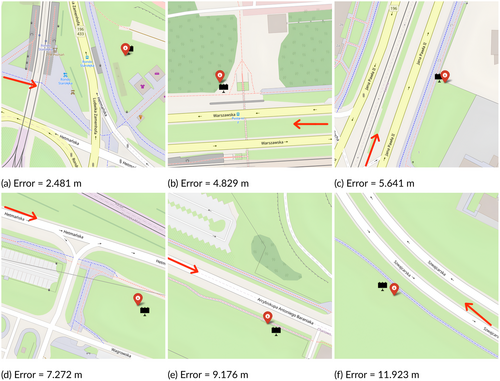
The evaluation results in the average distance error of 6.31 m for this setting, demonstrating the accuracy achieved in determining the coordinates of interest. The smallest and largest obtained errors are 2.481 and 11.923 m, highlighting the range of potential localization errors that may occur using this method. Figure 9 presents some evaluation examples, giving a visual overview of reached errors. Specifically, it presents a visual difference between ground-truth localization (red marker) and estimated (black mark) relative to the local map.
6.3 Measurement uncertainty analysis
Using consumer-grade vehicles to estimate objects' positions can result in higher errors due to the inaccuracy of on-board sensor measurements. Therefore, the impact of variations in sensor readings was addressed. Table 5 illustrates how the mean estimation error fluctuates in response to shifts. The values in the “Amount” column were chosen according to the precision of the drone's sensors. The calculations were performed for an example scenario that is a good representation of the measurements in the dataset. In this scenario, it was assumed that the drone flew at 35 m at a consistent speed of 1 m/s, with the gimbal oriented at a 30-degree downward angle. Furthermore, it' is worth acknowledging that these errors have the potential to accumulate.
| Change | Amount | Mean error [m] | Difference [m] |
|---|---|---|---|
| – | – | 6.31 | – |
| GPS lat | +5 m | 8.03 | +1.72 |
| GPS lat | −5 m | 7.12 | +0.81 |
| GPS lon | +5 m | 7.79 | +1.48 |
| GPS lon | −5 m | 8.00 | +1.69 |
| Altitude | +1 m | 7.03 | +0.72 |
| Altitude | −1 m | 7.11 | +0.80 |
| Azimuth | +1° | 6.36 | +0.05 |
| Azimuth | −1° | 6.39 | +0.09 |
| Gimbal pitch | +1° | 7.43 | +1.12 |
| Gimbal pitch | −1° | 7.91 | +1.60 |
7 APPLICATION
Concurrently with the research, the open-source application has been developed. This application is written in Python and utilizes a deep learning model and predefined configurations to process each frame in the input video. Subsequently, the billboard detections are aggregated and stored in the JSON format for each video file. The application's deep learning engine is based on the Ultralytics framework (Jocher et al., 2023), computer vision calculations are executed using OpenCV (Itseez, 2015), and geographic transformations are facilitated by the PyProj library (Snow et al., 2023).
7.1 Use cases
- Citizens, community groups, and environmental organizations can actively engage with the system to advocate for and educate about visual pollution. By contributing to the identification and monitoring of billboards, individuals can raise awareness regarding the impact of visual pollution on the environment and public well-being.
- Municipalities and urban planners can harness the system's capabilities to enforce zoning regulations concerning billboard placement and adherence to visual pollution guidelines.
- Municipalities can utilize item the system's capabilities to optimize tax revenue collection related to billboard advertising.
- Urban beautification initiatives can utilize the system to identify hotspots of visual pollution and prioritize cleanup or replacement efforts, thereby enhancing the overall aesthetics of a city.
- Computer vision researchers can utilize the dataset and tool to evaluate new data collections and extend existing ones with new features.
7.2 Performance
The performance benchmark was conducted on our host machine equipped with NVIDIA RTX3090 GP-GPU to evaluate the system's operation in real-world cases while processing long videos. Using floating-point precision, the host machine allows for reaching a mean level of 38 frames per second (FPS). Additionally, the profiling process showed that any memory pick does not exceed 2 GB of GPU memory during the benchmark when running inference with single-image batches.
7.3 Web-based visualization
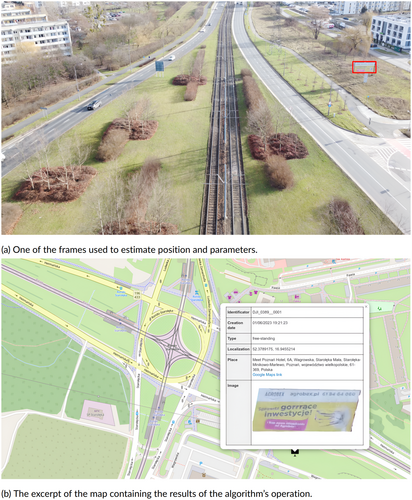
An example of a billboard detected by the system in a recorded video is presented in Figure 10. Figure 10a displays the middle frame of the video, with the billboard located on the right side (red bounding box). Figure 10b presents a screenshot of the web application, featuring a black marker representing the estimated position of the ad and pop-up information that shows the parameters detected, like the unique index, the type of billboard, the GPS coordinates, the location information, and the appearance of the advertisement. This application utilizes JSON files generated for each video file and visualizes them on the map. The application is developed using Python's Flask framework (Grinberg, 2018) and is supported by the most popular browsers.
8 CONCLUSIONS
The research presents the first deep-learning-based system for automatic billboard detection in urban environments on videos recorded by UAVs. The system employs the modified YOLO model, enhanced with an instance segmentation module for generating pixel-wise segmentation masks of billboard surfaces. It calculates billboard GPS coordinates using geospatial information provided by the drone's sensors. Additionally, the authors share the novel dataset designed for billboard detection from a drone perspective, consisting of 1361 images with spatial metadata, along with 5210 handcrafted annotations prepared for the instance segmentation task.
The YOLO instance segmentation models were evaluated, resulting in mask mAP of 0.778 and 0.432 for free-standing and wall-mounted billboards, respectively. Along with the evaluation of instance segmentation models, the evaluation of whole system precision was conducted. The MAE between ground-truth coordinates and the estimated coordinates was used to calculate the quantified metric using geodetic distance as the assessment metric. The system reached the MAE of 6.31 m, demonstrating its potential for billboard localization in drone-based applications.
The findings of this study highlight the potential of using deep learning and UAVs to address the problem of monitoring billboards from UAVs in cities. By accurately detecting and localizing these advertising media, urban planners can implement more effective management strategies, reducing visual pollution. Overall, this work contributes to the progress in automated billboard detection and offers insights into the potential applications of drone-based systems to address visual pollution in urban environments and smart cities. Furthermore, the newly introduced dataset can be a valuable resource for future research and development in the drone imagery field.
8.1 Limitations
While the drone's imagery usage to detect billboards with the system is promising, it is important to acknowledge some limitations of the current study.
8.1.1 Object localization limitations
The system relies on the drone's flight path to infer the forward azimuth (heading). Therefore, any rotations of the drone relative to its flight direction (for example, resulting from the drone's initial yaw orientation or caused by a gust of wind) will introduce errors in billboard location data, because the system assumes a direct correlation between the image direction and the drone's flight path.
8.1.2 System aggregation limitations
The system's billboard aggregation relies on inter-frame association, meaning it can only match billboards within a single drone video. Consequently, the system cannot correctly identify the same billboard across different videos from separate drone flights. Furthermore, the system cannot correctly assign the billboard again when it is invisible for a long time.
8.1.3 Generalization limitations
While the study demonstrates the system's ability to generalize to some extent, the training data consisted solely of images captured within a single city area. This limited data scope could decrease performance in other urban environments, particularly in cities with different building styles and climates. Furthermore, the system's performance may be significantly impacted in non-urban scenes, or across different countries and regions with varying advertising conventions. This limitation may be overcome with additional training using more diverse data.
8.1.4 Drone usage limitations
Local regulations governing drone flight can significantly restrict the areas and altitudes accessible for data collection. Therefore, these limitations may reduce the system's ability to survey billboards across cities.
8.2 Future work
In future work, we will examine some system limitations and propose a dedicated aerial platform for precise sensing and measuring. First, accuracy can be improved using the differential global positioning system (DGPS) instead of the classical GPS, which provides centimeter-range precision. Second, the LiDAR-based sensor can be used for accurate billboard distance measurement and 3D relative pose estimation. Additionally, we plan to create a module that enables billboard aggregation from different videos and enables content and style analysis through re-identification and OCR (optical character recognition) methods.
ACKNOWLEDGMENTS
The authors thank Jan Dominiak for his support in drone operation, data collection, and labeling.
CONFLICT OF INTEREST STATEMENT
We have no conflicts of interest to disclose.
Endnotes
Open Research
DATA AVAILABILITY STATEMENT
The data supporting the findings of this research are publicly available at https://doi.org/10.5281/zenodo.8366970.


