The effects of miRNA-27a-3p on human epidermal melanocytes
Yue Li and Suqin Wang contributed equally to this work and should be considered co-first authors.
Abstract
Objective
To characterize the effects of miRNA-27a-3p on the biological properties of human epidermal melanocytes (MCs).
Methods
MCs were obtained from human foreskins and transfected with miRNA-27a-3p mimic (induces the overexpression of miRNA-27a-3p), mimic-NC (the negative control group), miRNA-27a-3p inhibitor, or inhibitor-NC. After transfection, the proliferation of MCs in each group was evaluated by cell counting kit-8 (CCK-8) at 1, 3, 5, and 7 days. Twenty-four hours later, the MCs were transferred onto a living cell imaging platform and cultured for another 12 h to detect their trajectories and velocities. On days 3, 4, and 5 after transfection, the expression of melanogenesis-related mRNAs, protein levels, and melanin contents were measured using reverse transcription-polymerase chain reaction (RT-PCR), Western blotting, and NaOH solubilization, respectively.
Results
The RT-PCR results showed that miRNA-27a-3p was successfully transfected into MCs. The proliferation of MCs was restrained by miRNA-27a-3p. There were no significant differences in the movement trajectories of MCs in the four transfected groups, but the cell movement velocity in the mimic group was slightly lower; that is, the overexpression of miRNA-27a-3p inhibited the speed of MCs. The expression levels of melanogenesis-related mRNAs and proteins were decreased in the mimic group and were increased in the inhibitor group. Melanin content in the mimic group was lower than that in the other three groups.
Conclusions
Overexpression of miRNA-27a-3p inhibits the expression of melanogenesis-related mRNAs and proteins, reduces the melanin content of human epidermal MCs, and slightly impacts their movement speed.
1 INTRODUCTION
Human epidermal melanocytes (MCs) produce melanosomes (MSs) that are responsible for melanogenesis and are transported from the perinuclear regions to the dendritic tips and then transferred to surrounding keratinocytes, providing the skin with a protective barrier against ultraviolet radiation (UVR). Several key genes, including microphthalmia-associated transcription factor (MITF), tyrosinase (TYR), tyrosinase-related protein 1 (TYRP1), and tyrosinase-related protein 2 (TYRP2), and their encoded proteins are involved in melanin synthesis.1 As we all know, melanogenesis is modulated by the hormonal environment, inflammation, UVR, environmental pollution, and other factors.2 However, a more elaborate regulation of melanogenesis comes from the action of miRNAs and lncRNAs. miRNAs are single-stranded non-coding RNA molecules containing 18–24 nucleotides that can inhibit the expression of protein-coding genes and play key roles in regulating a variety of biological processes, such as cell proliferation, migration, differentiation, and apoptosis.3 Many miRNAs have been found to be associated with pigmentation and coat color formation in mammals.4-7 It has been reported that miRNA-27a-3p is expressed at significantly higher levels in white skin than in brown skin of alpacas.8 miRNA-27a-3p can bind and regulate Wnt3a specifically, and its overexpression inhibits Wnt3a expression at the protein level, which inhibits melanogenesis in murine MCs.9 In our previous studies, we identified miRNA-27a-3p as one of the potential regulators of human epidermal melanogenesis by comparing the miRNA expression profiles of human epidermal keratinocyte exosomes (to be published). In order to further investigate the effects of miRNA-27a-3p on human epidermal MCs, we designed this study to detect the morphological and functional changes in MCs after transfection with miRNA-27a-3p.
2 MATERIALS AND METHODS
2.1 Culture of primary epidermal cells
Human foreskin specimens (healthy men aged 15–25 years) were obtained after patient's informed consent and were soaked in 0.5% iodine for 5 min and then rinsed three times with phosphate-buffered saline (PBS) containing 400 U/mL penicillin and 400 μg/mL streptomycin. The subcutaneous and adipose tissues were then trimmed and removed. The remaining skin was cut into strips of approximately 3 mm × 3 mm and incubated with 0.25% dispase II (cat. no. 4942078001, Roche, Basel, Switzerland) for 2 h. After digestion, the epidermis was separated from the dermis and was then cut into smaller pieces and further incubated with 0.25% trypsin for 15 min. The epidermal cells obtained were cultured in M254 medium (containing 1% Human Melanocyte Growth Supplement-2 [cat. no. S0165, Gibco, USA], 100 U/mL penicillin, 100 μg/mL streptomycin [cat. no. SV30010, Hyclone, USA]) at 37°C with 5% CO2. The medium was changed every 2 days.
2.2 Immunofluorescence staining of MCs
When the primary epidermal cells reached 80% confluence, they received differential trypsinization to obtain MCs, which were seeded in six-well plates containing M254 medium and then cultured at 37°C with 5% CO2. The culture medium was changed every 2 days. In order to perform immunofluorescence staining, the MCs were subcultured in 24-well plates at a density of 1 × 10⁵ cells per well. The adherent cells were fixed with 4% paraformaldehyde and permeabilized with 0.2% Triton X-100. The primary antibodies (HMB45 [1:500, cat. no. ab787, Abcam, UK] and TYR [1:1000, cat. no. ab738, Abcam]) and their corresponding fluorescent (Alexa Fluor 647) conjugated secondary antibodies, isotype-matched donkey anti-mouse immunoglobulin G (IgG, 1:400, cat. no. ab150105, Abcam), and donkey anti-rabbit IgG H&L (1:400, cat. no. ab150075, Abcam) were used. Counterstaining with 4', 6-diamidino-2-phenylindole (DAPI) (1:100, cat. no. MA0127, Meilunbio, Dalian, China) was performed to identify nuclei. Images were taken using a fluorescence microscope (Olympus, Japan).
2.3 Transfection of MCs with miRNA-27a-3p
Before transfection, MCs were inoculated and expanded in six-well culture plates until they reached approximately 50% confluence. Liposome 3000 (3.75 μL) was diluted with 125 μL Opti-MEM medium. Five microliters of mimic, mimic-NC, inhibitor, and inhibitor-NC were diluted with 125 μL of Opti-MEM medium, and then 125 μL of diluted Liposome 3000 was added separately. A total of 250 μL of the mixed transfection solution (per well) was added to the six-well plate. The MCs were cultured in the mixed transfection medium for 2–5 days and then collected for subsequent analysis.
2.4 Proliferation of MCs
After transfection, MCs were inoculated in 96-well plates at 3000 cells per well and cultured at 37°C with 5% CO2. The proliferation rates of MCs were detected using a cell proliferation and toxicity detection kit (CCK-8, cat. no. MA0218-500T, Meilunbio). The absorbance in each group was measured at 450 nm using a Multiscan Spectrum microplate reader (Thermo Fisher, Waltham, MA, USA). This experiment was performed three times.
2.5 The trajectory and velocity of MCs
The MCs were cultured in six-well plates containing the mimic, mimic-NC, inhibitor, or inhibitor-NC for 24 h. The plates were then transferred into a living cell platform for continuous culture at 37°C with 5% CO2. Two fields in each culture well were randomly selected (12 fields in total) and served as time-lapse photography areas. The MCs in those fields were photographed every 10 min for 12 h. The image data acquired were analyzed using ImageJ software. The coordinates of the target cells were located, and the trajectories of 12 MCs in each field of vision were tracked and then drawn using MATLAB software. The moving distance of the target MCs was calculated and divided by the time (12 h) to determine the cell velocity.
2.6 Reverse transcription-polymerase chain reaction
Total RNA was extracted from cells using an RNAeasy Animal RNA Isolation Kit with a Spin Column (cat. no. P0103, Beyotime, China). The purity and concentration of each total RNA were determined using a UV spectrophotometer. A RevertAid First Strand cDNA Synthesis kit (cat. no. K1621, Thermo Scientific, NY, USA) was used for the efficient synthesis of first strand cDNA for melanogenesis-related mRNAs. A miRcute enhanced miRNA cDNA first strand synthesis kit (TIANGEN, cat. no. KR211, China) was used for the efficient synthesis of first strand cDNA for miRNA-27a-3p. Reverse transcription-polymerase chain reaction (RT-PCR) was performed by TaKaRa TB Green Premix Ex TaqTM II (Tli RNaseH Plus) (cat. no. RR420A, TaKaRa, Japan; for melanogenesis-related mRNAs) and a miRcute enhanced miRNA fluorescence quantitative detection kit (TIANGEN, cat. no. FP411; for miRNA-27a-3p) on a LightCycler (Version 480II, Roche). Primers used are shown in Table 1. This experiment was performed three times.
| Primers | Sequences (5′−3′) |
|---|---|
| MITF forward | CTCACAGCGTGTATTTTTCCCA |
| MITF reverse | ACTTTCGGATATAGTCCACGGAT |
| TYR forward | CAATGTCCCAGGTACAGGGAT |
| TYR reverse | GTAGGATTCCCGGTTATGTCCA |
| TYRP1 forward | GCTGCAGGAGCCTTCTTTCTC |
| TYRP1 reverse | AAGACGCTGCAGTGCTGGTCT |
| TYRP2 forward | GGATGACCGTGAGCAATGGCC |
| TYRP2 reverse | CGGTTGTGACCAATGGGTGCC |
| β-Actin forward | TCACCCACACTGTGCCCATCT |
| β-Actin reverse | TTCTCCTTAATGTCACGCACGAT |
| miRNA-27a-3p forward | CGCGTTCACAGTGGCTAAGT |
| miRNA-27a-3p reverse | GTGCAGGGTCCGAGGTATTC |
| U6 forward | CTCGCTTCGGCAGCACA |
| U6 reverse | AACGCTTCACGAATTTGCGT |
- Abbreviations: MITF, microphthalmia-associated transcription factor; TYR, tyrosinase; TYRP1, tyrosinase-related protein 1; TYRP2, tyrosinase-related protein 2.
2.7 Western blot
Total protein was extracted using protein extraction reagent (BEIBO, cat. no. 3101-50T, China), and protein concentrations were determined using a NanoDrop 1000 spectrophotometer. Western blots were performed according to the usual protocol. In short, proteins were separated by 10% SDS-PAGE, and transferred to polyvinylidene difluoride membranes. The membranes were cut prior to hybridization with antibodies and then probed with antibodies against TYR (1:1000, cat. no. ab738, Abcam), TYRP1 (1:1000, cat. no. ab 235447, Abcam), TYRP2 (1:1000, cat. no. ab 221144, Abcam), and MITF (1:1000, cat. no. ab140606, Abcam). The membranes were then briefly washed and incubated with a fluorescent secondary antibody. Finally, the membranes were washed and visualized using super enhanced chemiluminescence (ECL) plus (Boster, Wuhan, China). This experiment was performed three times.
2.8 Melanin content measurement
MCs were collected after transfection for 72 h, digested with 0.25% trypsin for 8 min, and then centrifuged at 1000 rpm for 10 min at 4°C. They were then resuspended in PBS and counted using a hemocytometer. The cells were pelleted again and 1 mL of 1 M NaOH was added, followed by mixing and incubation at 85°C for 10 min. Melanin content was then measured at 475 nm using a Multiscan Spectrum microplate reader (Thermo Fisher). This experiment was performed three times.
2.9 Statistical analysis
Data are expressed as the mean ± standard deviation, and statistical analysis was performed using SPSS 25 software. Statistical graphs and statistical analysis (t-test) were performed using GraphPad Prism 8.4.1.
3 RESULTS
3.1 Purification of MCs by differential trypsin treatment
The primary epidermal cells were digested with 0.05% trypsin for 3 min, after which the cells that separated from the bottom of the culture plate were MCs. The digested cells were collected, and cells that still adhered to the wall were keratinocytes. The purified MCs and keratinocytes were observed using an inverted microscope. MCs were thinner and longer, had more than two dendrites, and the dendrites were slender. In contrast, the keratinocytes that still adhered to the wall were cobblestone-like.
3.2 The purified cells were MCs identified by immunofluorescence staining
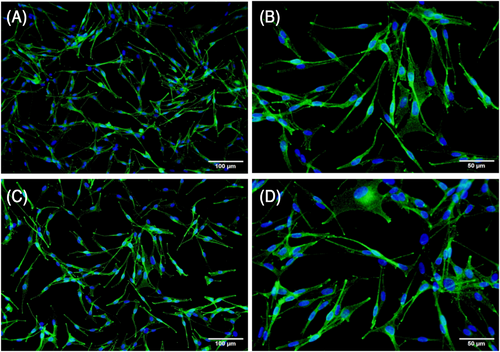
In order to identify the MCs obtained, immunofluorescence staining was performed using specific antibodies for HMB45 and TYR, and the expression of HMB45 and TYR was observed by fluorescence microscopy. TYR- and HMB45-positive cells showed green fluorescence. The purified MCs were HMB45- and TYR-positive (Figure 1), which proved that they were MCs.
3.3 miRNA-27a-3p was successfully transfected into MCs
miRNA-27a-3p mimic, mimic-NC, inhibitor, and inhibitor-NC were transfected into MCs by liposome transfection. When the density of cultured human epidermal MCs reached 50%, the cells were transfected. After transfection, the cell morphology was normal, and the cells grew well. In order to determine the transfection efficiency of miRNA-27a-3p, RT-PCR was used to determine the relative expression level of miRNA-27a-3p in MCs 48 h after transfection. The results showed that the expression of miRNA-27a-3p in the mimic group was significantly higher than that in the mimic-NC group (p < 0.001), and the relative level of miRNA-27a-3p in the mimic group was 1335 times higher than that in the mimic-NC group. The expression of miRNA-27a-3p in the inhibitor group was significantly lower than that in the inhibitor-NC group (p < 0.001) (Figure 2). The relative level of miRNA-27a-3p in the inhibitor group was 46 times lower than that in the inhibitor-NC group. These data indicated that miRNA-27a-3p was successfully transfected into MCs.

3.4 Proliferation of MCs
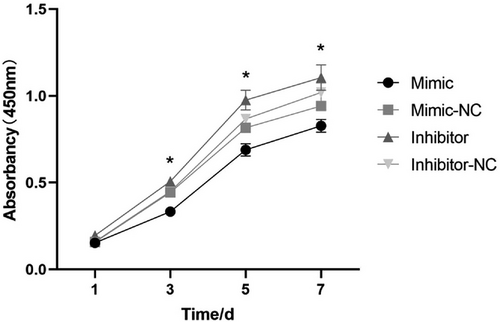
The proliferation rates of MCs were detected using CCK-8 assays at 1, 3, 5, and 7 days after transfection. The number of MCs gradually increased with time in culture, especially on days 3 and 5 (Figure 3). At 3, 5, and 7 days, the absorbance of each group was significantly different from the control (p < 0.05). On the 7th day, the number of MCs in each group reached their peaks. MCs in the inhibitor group had significantly higher proliferation rates than other groups at 3, 5, and 7 days (p < 0.05). These findings indicated that miRNA-27a-3p depresses the proliferation of MCs (p < 0.05).
3.5 Trajectory and velocity of MCs
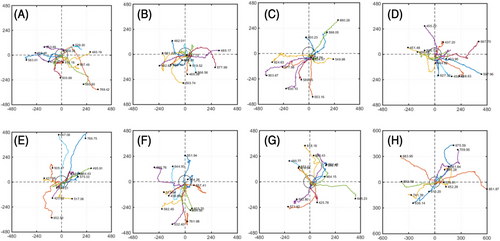
The photos taken for 12 h were processed using ImageJ and MATLAB softwares. The starting points of all cells were unified to the origin in space, and each line represents the movement trajectory of each cell within 12 h. Finally, a normalized cell trajectory map was obtained (Figure 4). There was no obvious preference for the direction of cell movement in any group, no migration movement in a specific direction, and a wide range of movement.
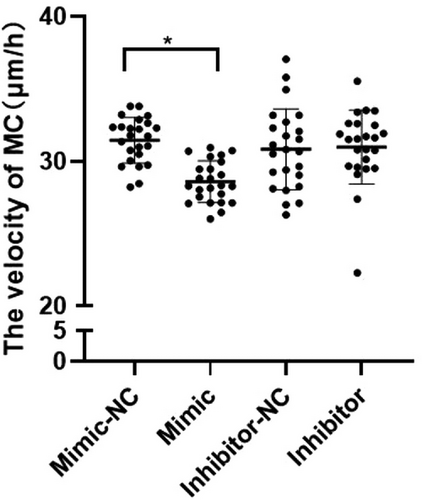
The migration distance (μm) divided by the observation time (12 h) determined the velocity (μm/h) of each target cell in the four groups, and statistical analysis was performed (Figure 5). The results showed that the velocity of the mimic group was significantly lower than that of the mimic-NC group (p < 0.05). There was no significant difference in velocity between the inhibitor group and the inhibitor-NC group.
3.6 Relative mRNA and protein expression levels of melanogenesis-related genes
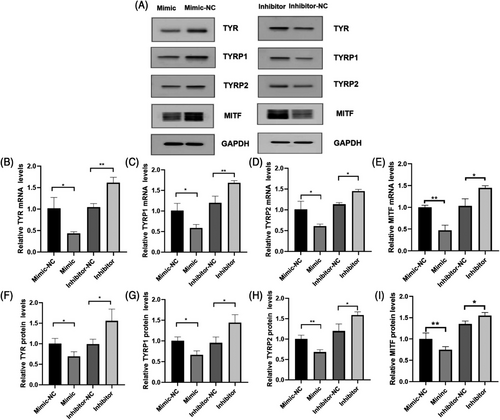
In order to test the effect of miRNA-27a-3p on the expression of melanogenesis-related genes of MCs, RT-PCR was used to detect the relative mRNA expression levels of TYR, TYRP1, TYRP2, and MITF in MCs 48 h after transfection. Western blots were performed on the 5th day after transfection to test the relative protein expression levels of TYR, TYRP1, TYRP2, and MITF.
The results showed that, both the relative expression of mRNA and protein of TYR, TYRP1, TYRP2, and MITF in the mimic group were significantly lower than in the mimic-NC group (p < 0.05), and TYR, TYRP1, TYRP2, and MITF in the inhibitor group were significantly higher than in the inhibitor-NC group (p < 0.05) (Figure 6).
3.7 Melanin content
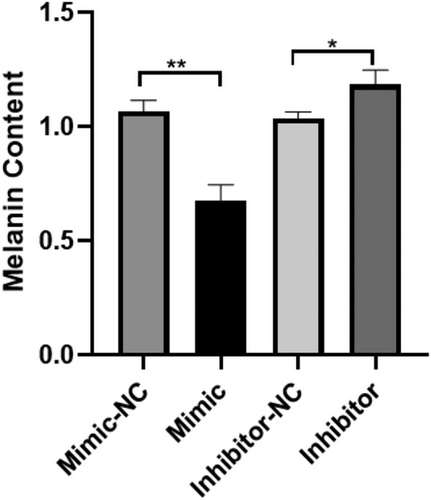
The content of melanin in MCs was measured on the 2nd, 3rd, 4th, and 5th days after transfection. No significant differences were found in the mimic group, mimic-NC group, inhibitor group, or inhibitor-NC group on days 2, 3, 4, or 5. However, on the 5th day, the melanin content of the mimic group was significantly lower than that of the mimic-NC group (p < 0.01), and the melanin content of the inhibitor group was significantly higher than that of the inhibitor-NC group (p < 0.05) (Figure 7).
4 DISCUSSION
MCs are pigment cells located in the basal layer of the epidermis. They form a melanin unit with adjacent keratinocytes and communicate directly or indirectly with surrounding cells through their dendrites, such as keratinocytes and fibroblasts in the dermis.10, 11 Melanin is synthesized in MSs through a series of biochemical and enzymatic reactions. Melanin synthetic enzymes and structural proteins are localized in MSs, which can synthesize melanin from L-tyrosine.12 TYR is the rate-limiting enzyme for the first two important reactions in melanin synthesis. Two other important enzymes, TYRP1, TYRP2, and MITF, are also involved in melanin synthesis.
In the skin, miRNAs are involved in regulating the development of skin tissue, MC formation and migration, and melanin formation. Many miRNAs involved in regulating melanin production have been identified. miRNA-508-3p and miRNA-25 regulate melanogenesis by targeting MITF in alpaca MCs.6, 13 miRNA-143-5p regulates the migration, proliferation, and melanin production of alpaca MCs.14 miRNA-5110 regulates melanin production and transfer in alpaca MCs by targeting the melanogenesis-related protein melanophilin and Wnt family member 1.15
Exosomes are 40–100 nm biofilm structures that are common tools for intercellular communication.16 Exosomes can contain cytokines, transcription factors, proteins, mRNAs, miRNAs, and other active substances.17 miRNAs can transmit extracellular signals through exosomes and can regulate intracellular protein expression and nuclear function and other processes to regulate the fate of distant cells. Studies have shown that miRNA-330-5p that is carried in exosomes secreted by keratinocytes can inhibit the pigmentation of MCs, proving that keratinocytes can communicate with adjacent MCs through miRNAs in exosomes.18 We previously analyzed the expression of miRNA-27a-3p in exosomes secreted by human epidermal keratinocytes. Previous studies also confirmed that miRNA-27a-3p can inhibit melanogenesis of mouse MCs.9 Therefore, we studied the effects of miRNA-27a-3p on human epidermal MCs, which laid a foundation for further studies of the effects of miRNA-27a-3p carried by exosomes secreted by keratinocytes on MCs.
We had used CCK-8 assays to determine the proliferation rates of MCs at 1, 3, 5, and 7 days after transfection. The number of MCs gradually increased with time in culture, especially on days 3 and 5. MCs in the inhibitor group had significantly higher proliferation rates than those in the control and mimic groups at 3, 5, and 7 days, which indicated that miRNA-27a-3p depresses the proliferation of MCs.
miRNA-27a-3p mimic, mimic-NC, inhibitor, and inhibitor-NC were transfected into MCs by Lipofectamine. After 2–5 days of transfection, the morphological changes, trajectories and velocities, expression of melanogenesis-related genes, and melanin content were analyzed in MCs. We observed the growth of MCs every day and found that there were more dendritic cells in the mimic group. In previous studies, we also found that miRNAs can change the morphology of MCs. For example, overexpression of miRNA-379 stimulates dendritic elongation or elongation of MCs.19 In addition, after UVB irradiation, the expression of miRNA-340 increased in MCs, and the number and total length of MC dendrites and MS aggregation increased. This may be related to the overexpression of miRNA-340, which significantly inhibited the expression of RhoA protein related to dendrite formation.20
In experiments measuring the trajectory and velocity of MCs, the velocity of MCs in the mimic group was slower than that in the other three groups. Previous studies have reported that the up-regulation of miRNA-338-3p inhibits the migration and invasion of malignant melanoma cells, and the overexpression of miRNA-379 inhibits the migration of MCs.19, 21 There are many targets for miRNAs to regulate cell migration. The extracellular matrix is a structure and molecular scaffold for cell adhesion and migration. Some miRNAs have been identified as regulators of extracellular matrix-related genes, which regulate remodeling of the extracellular matrix and affect the pattern and efficiency of cell migration. miRNAs can also inhibit the expression of extracellular matrix regulators to affect cell migration. For example, miRNA-146b-5p can inhibit the migration and invasion of glioblastoma cells by reducing the expression of MMP16.22 In addition, miRNAs can also target other migration-related genes, including chemokines, cell surface proteins, and transcription factors.23
In experiments to determine the expression of melanogenesis-related genes, RT-PCR and Western blot results showed that overexpression of miRNA-27a-3p inhibited the mRNA and protein expression levels of TYR, TYRP1, TYRP2, and MITF, while the inhibitor group showed the opposite results. These results indicated that miRNA-27a-3p regulates the expression of melanogenesis-related genes in human epidermal MCs. The transcription factor MITF plays a key role in regulating the development and function of MCs, and it is an important factor that regulates melanin production by MCs. Previous studies have shown that many miRNAs can target MITF to regulate melanin production, such as miRNA-25, miRNA-137, and miRNA-508-3p.24 In the present study, our results showed that overexpression of miRNA-27a-3p inhibited the mRNA and protein expression levels of MITF, while the inhibitor group showed the opposite results.
Finally, we measured the effect of miRNA-27a-3p on melanin production in MCs. The results showed that the melanin content of the mimic group decreased, while that of the inhibitor group increased, which indicates that overexpression of miRNA-27a-3p inhibits pigmentation. The sum of these data shows that overexpression of miRNA-27a-3p inhibits the expression of TYR, TYRP1, TYRP2, and MITF in MCs, thus inhibiting pigmentation, while a decrease in miRNA-27a-3p promotes the expression of TYR, TYRP1, TYRP2, and MITF in MCs, thus promoting pigmentation.
The present study aimed to investigate the regulatory role of miRNA-27a-3p in MC melanogenesis. To this end, we conducted a series of experiments and demonstrated that miRNA-27a-3p can effectively regulate the melanogenesis of MCs. Our previous investigation analyzed the expression of miRNA-27a-3p in exosomes secreted by human epidermal keratinocytes. Furthermore, we plan to expand on our findings by examining the effect of miRNA-27a-3p in exosomes secreted by keratinocytes on MCs in future experiments. These results shed light on the intricate mechanisms underlying melanogenesis regulation and may offer potential avenues for the development of innovative therapeutic strategies for hyperpigmentary disorders.
ACKNOWLEDGMENTS
The authors are very grateful to Professor V.J. Hearing for help with the English language editing. This work was supported by the National Natural Science Foundation of China (grant number 81673078).
CONFLICT OF INTEREST STATEMENT
The authors declare no conflicts of interest.
ETHICS STATEMENT
Approval was obtained from the ethics committee of The Third Affiliated Hospital of Soochow University. The procedures used in this study adhere to the tenets of the Declaration of Helsinki. The patient has consented to the submission of the case report for submission to the journal.
Open Research
DATA AVAILABILITY STATEMENT
All supporting data related to the studies are provided in the manuscript and available from the corresponding authors upon reasonable request.


