Line-field confocal optical coherence tomography—Practical applications in dermatology and comparison with established imaging methods
Cristel Ruini, Sandra Schuh, Elke Sattler and Julia Welzel contributed equally.
Funding information
FöFoLe (Förderprogramm für Forschung und Lehre) Grant of the Ludwig Maximilian University of Munich 1022-2018.
Abstract
Background
Non-invasive diagnostic techniques in dermatology gained increasing popularity in the last decade. Reflectance confocal microscopy (RCM) and optical coherence tomography (OCT) are meanwhile established in research and clinical routine. While OCT is mainly indicated for detecting non-melanoma skin cancer, RCM has proven its usefulness additionally in distinguishing melanocytic lesions. Line-field confocal optical coherence tomography (LC-OCT) is an emerging tool combining the principles of both above-mentioned methods.
Methods
Healthy skin at different body sites and exemplary skin lesions (basal cell carcinoma, malignant melanoma, actinic keratosis) were examined using dermoscopy, RCM, OCT and LC-OCT. Standard features for RCM and OCT and comparable features for LC-OCT were analysed.
Results
LC-OCT has a lower penetration depth but superior resolution compared to OCT. In comparison with RCM, which provides only horizontal sections, LC-OCT creates both vertical and horizontal images in real time and has nearly the same cellular resolution.
Discussion
Our preliminary experiences suggest that LC-OCT combines the advantages of RCM and OCT, with optimal resolution and penetration depth to diagnose all types of skin cancer.
Larger systematic studies are needed to further characterize the field of use of this device and its sensitivity and specificity compared to histology.
1 INTRODUCTION
Optical coherence tomography (OCT) is well established in non-invasive diagnostics, especially for epithelial skin tumours. It enables the visualization of architectural changes down to the middle dermis, but without cellular resolution. Primarily, depth section images are displayed, whereby three-dimensional overview images are possible. This allows basal cell carcinomas (BCCs) to be diagnosed and distinguished from other epithelial tumours and precancerous lesions. It is also possible to determine the tumour thickness and the subtype of basal cell carcinoma. In the case of non-surgical therapies such as photodynamic therapy or topical imiquimod, OCT is also suitable for monitoring the course of the disease.1-5
Reflectance confocal microscopy (RCM) has also been established in routine diagnostics for many years. Its domain is the differential diagnosis of pigmented lesions, as it offers a high resolution with visibility of cytological details. However, its penetration depth is limited to the stratum papillare of the dermis, missing deeper parts of tumours. RCM provides horizontal images of small sections that can be combined to form a larger mosaic.6, 7
Line-field confocal optical coherence tomography (LC-OCT) allows the simultaneous display of horizontal and vertical images with a higher resolution than conventional OCT, but also with a higher detection depth compared to RCM.
A LC-OCT prototype (DAMAE, Paris) was used in this study to image healthy skin at different locations, to display a basal cell carcinoma, an actinic keratosis and a malignant melanoma exemplarily and to compare the findings with OCT and RCM. The intention was to evaluate the potential of LC-OCT in comparison to OCT and RCM regarding diagnosis of skin cancer.8, 9
2 MATERIALS AND METHODS
2.1 Imaging devices
2.1.1 LC-OCT
The LC-OCT system is based on a two-beam interference microscope with line illumination and line detection using a central wavelength of spatially coherent light source and a line-scan camera. The light source is classified as a class 1 supercontinuum laser with a central wavelength of 800 nm. The real-time image acquisition is non-invasive, painless for the patient and provides no tissue damage, so that it is also allowed to be applied in pregnant women and children.
LC-OCT measures the time of flight and amplitude of light, which is backscattered from the tissue microstructures. It substantially combines the principle of OCT interferometry with the spatial filtering of RCM. The device collects multiple A-scans in parallel from the skin surface to a depth of ∼500 μm, constantly adjusting the focus. The LC-OCT device (DAMAE Medical, Paris) has three imaging modalities: vertical or en-coupe (similar to OCT and histology), en-face (comparable with RCM) and 3D stack for a three-dimensional reconstruction. Both short movies and stacks from surface to depth can be recorded. It has an axial resolution of 1.1 μm, a lateral resolution of 1.3 μm and a field of view of 1.2 mm × 0.5 mm (vertical) and 1.2 mm × 0.5 mm (en-face), respectively. Images are displayed in a grey scale. It provides a simultaneous live acquisition and imaging evaluation, thanks to its acquisition speed of 10 images/second (2D) resp. 15 seconds for a 3D stack. The device consists of a central unit connected to a handheld probe and a monitor, with Bluetooth keyboard and mouse. Immersion oil is applied between the glass window of the probe and the skin surface for index matching. It is provided with a wheeled cart, so that it can be easily moved towards the patient. Complete technical details are described elsewhere.10-12
2.1.2 RCM
The commercially available RCM (VivaScope® 1500 and 3000, Mavig GmbH, Munich, Germany), is based on a near-infrared, low-power laser beam (830 nm diode laser, up to 35 mW). The lateral resolution is 1 μm, the axial resolution is approximately 3-5 μm. The penetration depth reaches the superficial dermis at 200-250 μm. Skin images are displayed in a grey scale, where melanin and keratin serve as endogenous chromophores, provide the most contrast and appear bright, in contrast to water (cytoplasm), which appears black. There are essentially two available types of the device (VivaScope® 1500, fixed to a flexible arm, and VivaScope® 3000, a handheld probe) and a combination of both of them. The 1500 device has a field of view of 500 × 500 μm and can build a mosaic grid of single greyscale contiguous images up to 8 × 8 mm (VivaBlock®); a series of vertical stacks from the surface to the depth (VivaStack®) can also be acquired. VivaScope 1500 offers an integrated dermoscopic camera to allow navigation in the mosaic and immediate comparison with dermoscopy. The newest generation has a built-in camera for both clinical and dermoscopic pictures.
In our study, images sized 500 × 500 µm up to 200 µm in depth were collected using the VivaStack® function with a commercially available reflectance confocal microscope (VivaScope®1500 and 3000, Mavig GmbH, Munich, Germany).
Further details on the device are described elsewhere.13
2.1.3 OCT
Three-dimensional OCT images sized 6 × 6 mm down to a skin depth of about 1.5 mm were acquired using the commercially distributed Vivosight® (Michelson Diagnostics Ltd, Maidstone, Kent, UK). This frequency domain OCT is based on Michelson interferometry, has a lateral resolution of 7.5 μm and an axial resolution of 10 μm. Its laser source (HSL 2000; Santec Corporation, Komaki, Japan) has a central wavelength of 1,305 nm. The device has a handheld probe, which is provided with a series of plastic spacers to adjust the focus to different skin sites. The dynamic mode allows the visualization of blood flow simultaneously with the morphologic features of the tissue.
A more detailed description of the device is provided elsewhere.1
2.1.4 DERMOSCOPY
Clinical and dermoscopic images of each lesion were acquired using Fotofinder (FotoFinder Systems GmbH, Bad Birnbach, Germany) and a DermoGenius 2 (DermoScan GmbH, Regensburg, Germany) as well as an ILLUCO IDS-1100 (DermoScan GmbH, Regensburg, Germany).
2.2 Subjects
The study was approved by the local ethics committee (Nr17-699), and informed consent was obtained from each subject. The study was conducted according to the principles of the declaration of Helsinki and international guidelines concerning human studies. Two women aged 33 and 49 were enrolled in the study for measurements of healthy skin in three different locations. In addition, one woman aged 51 with an actinic keratosis on the nose, one man aged 89 with a nodular BCC on his right eyebrow and one man aged 78 with a malignant melanoma on his right thigh were examined in the study.
2.3 Measurements
Healthy skin at different locations (right cheek, right volar forearm and right middle fingertip as well as exemplary neoplastic skin diseases were investigated. The following images were collected for each site: LC-OCT (en-face, vertical and 3D), OCT (vertical and dynamic en-face), RCM (VivaBlock® and VivaStack fully described elsewhere14). An adhesive ring marked the measuring position and guaranteed that exactly the same spot was measured with each method. Skin lesions except for healthy skin were compared with their standard histology in haematoxylin/eosin. Only good quality images were included into the study. Subjects were sitting or lying comfortably while the operator performed the measurements. On the test site, the skin was pre-treated with immersion oil to reduce light reflection from the surface for LC-OCT and RCM, whereas the OCT images were collected without pre-treatment.
Following skin layers were individually evaluated: stratum corneum (SC), epidermis (EPI), dermo-epidermal junction (DEJ), papillary dermis (PD) for all three methods, and reticular dermis (RD) only in OCT.
The measurements were performed between November 2019 and March 2020 at the dermatology departments of the university hospitals of Munich and Augsburg.
3 RESULTS
3.1 Healthy skin
The correlation between LC-OCT images and haematoxylin-eosin sections of normal skin can be seen in Figure 1A vs. B. In LC-OCT, single cells and even nuclei can be distinguished as well as follicular openings and blood vessels. En-face and vertical images showed significant variations depending on the anatomical location. LC-OCT features in vertical mode were visible in OCT, too, although LC-OCT allows a much better definition of cytological details (Figure 1B vs. C).

Figure 1B shows that the SC in vertical mode is composed of corneocytes; sometimes detached hyperreflective scales are visible. Erosions appear as a dark and irregular discontinuity of the surface. Keratinocytes are slightly darker polygonal cells, showing bright contours. They decrease in size passing from SC to stratum granulosum to stratum spinosum. Hair follicles are visible as dark longitudinal shadows, sometimes with a bright hair shaft. The DEJ is a thin dark line constituted of a layer of small basal cells. It separates the clearly distinguishable epidermis from the papillary dermis, the latter appearing hyperreflective. Blood vessels are represented as hyporeflective linear and convolute structures.
In the en-face mode in Figure 2A, hyperreflective single corneocytes of 10-30 μm are displayed on the surface in the SC like in RCM in Figure 2B. The keratinocytes composing the EPI are polygonal cells with dark nuclei and are arranged in a sort of honeycombed pattern appearing regular in Figure 2C and D. More pigmented keratinocytes appear brighter and create a cobblestone pattern. Skin folds are sharply demarcated, non-refractile linear furrows between groups of keratinocytes and can be seen in Figure 2A and C in LC-OCT as well as in Figure 2B, D, F in RCM. Hair follicles are also very well distinguishable concentric round structures, with a dark, round, central opening surrounded by a multilayer of darker epithelial cells like in 2C and E in LC-OCT and in 2F in RCM images. The DEJ of normal skin has a regular ringed architecture, composed of dark round to oval dermal papillae centred by capillary loops, depending on the transversal section of the dermal papillae. These correspond to the edged papillae visible in RCM at the DEJ (in 2 h in RCM images). In 2I in LC-OCT images as well as in 2J in RCM images, hyperreflective collagen fibres and bundles and hyporeflective linear and roundish blood vessels dominate in the PD.
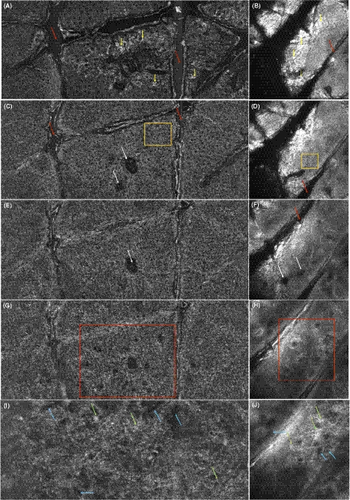
The LC-OCT en-face and vertical images showed significant differences depending on the location, as expected. The above-mentioned main morphological patterns of healthy skin in LC-OCT seem to correspond to the respective OCT and especially to the RCM features.
3.1.1 Cheek
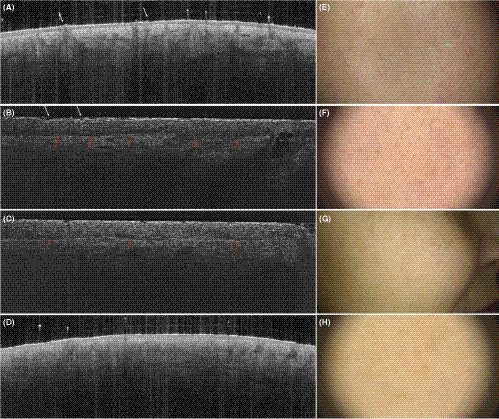
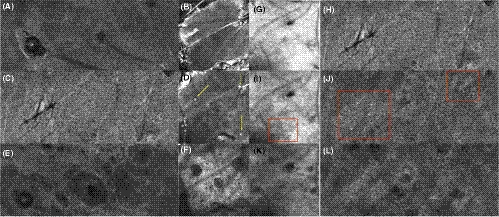
As common on adnex-rich skin, the surface of the (thin) SC, EPI and DEJ in vertical mode appears to be slightly undulated (white arrows) in Figure 3A in OCT and in B in LC-OCT. Sebaceous glands appear as globular bright structures connected to the epidermis, sometimes with an opening into hair follicles (yellow area in Figure 3B). Some bright, roundish and homogeneous comedones, filled with amorphous material, can also be seen (yellow arrows in 4 d). Demodex mites as skin commensals are visible inside the hair follicles as hyperreflective globules in vertical mode and as large, grouped, hyperreflective structures in en-face mode (yellow arrow in Figure 3B, white arrows in Figure 4A and E). The DEJ is slightly more flattened in elderly skin (red arrows) in Figure 3C in LC-OCT and in Figure 3D in OCT. The dermis is brighter in the younger subject compared to the older one, probably due to the more compact structure of collagen fibres (Figure 3B vs. C). The latter appears more rarefied and therefore darker in elderly skin (Figure 3C, Figure 4K in RCM and Figure 4L in LC-OCT) compared to the younger woman (Figure 4E in LC-OCT and Figure 4F in RCM). This can be especially visualized in the en-face mode. As signs of sun damage and therefore more represented in elderly skin, mottled pigmentation (red areas in Figure 4J in LC-OCT and in 4i in RCM) and hyperreflective tubular structures (solar lentigos) are seen in the epidermis and DEJ, respectively.
3.1.2 Forearm
In en-face mode, SC was slightly thicker than on the face, showing a more irregular surface (Figure 2 vs. Figure 4). Numerous hair follicles were visible, as well as dilated blood vessels in the PD (Figure 2C, E, G, I in LC-OCT images, Figure 2F, H and J in RCM images).
3.1.3 Fingertip
In the vertical mode, a thick SC characterizes the fingertip (Figure 5A, B in vertical LC-OCT images and in OCT images) and, in general, the palmo-plantar skin. The entrance signal is very bright, and the surface has a characteristic wavy pattern (Figure 5A, B in vertical LC-OCT images and in OCT images). Hyperreflective, coiled eccrine ducts can be seen in the epidermis in continuity with the skin surface (red arrows in Figure 5A, B in vertical LC-OCT images and in OCT images). The lower layers were less signal intense and corresponded to the stratum lucidum. The DEJ is bright and follows the undulating pattern. Due to the increased epidermal thickness and therefore limited penetration depth of the laser beam, the assessment of the dermis can be less effectively compared to other anatomical sites.

In en-face mode, skin folds are very prominent dark furrows separating islands of polygonal keratinocytes (green arrows in Figure 5C, E in LC-OCT images and Figure 5D, F in RCM images). Roundish hyperreflective structures with a dark centre are regularly distributed among ridges of the skin marks and correspond to eccrine sweat ducts (orange arrows in Figure 5C, E in LC-OCT images and Figure 5D, F in RCM images). Due to skin folds, the images at increasing depth show alternating, parallel layers of polygonal keratinocytes and junctional meshwork (corresponding to the meshwork junctional pattern in RCM terminology) interrupted by bright eccrine ducts.
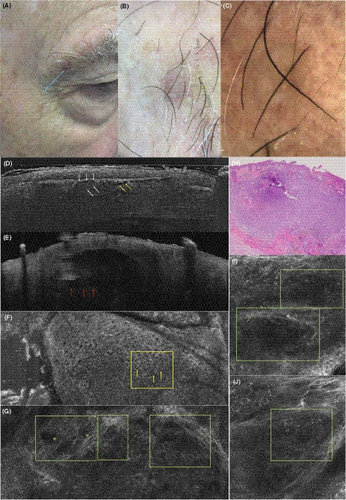
3.1.4 Basal cell carcinoma
In vertical mode in Figure 6, the BCC is clearly visible showing sharply demarcated tumour nests with palisading of the peripheral cells and surrounded by a dark cleft. This nodular BCC shows dark, cystic structures in the centre (yellow arrows in Figure 6D). The resolution is higher compared to OCT, where single cells cannot be distinguished. However, as in RCM, deeper BCC nests might not be identified and the lower border of the tumour is not visible. In en-face mode, slightly altered epidermal architecture with enlarged spaces between keratinocytes shows an atypical honeycombed pattern as in RCM (Figure 6F). Approaching the DEJ and the upper dermis, tumour nests (Figure 6G, I, J) appear both in LC-OCT and RCM as roundish or cord-like nests with peripheral palisading, surrounded by dark clefting and bright stromal reaction (Figure 6G, I). Canalicular blood vessels are also visible.
3.1.5 Malignant melanoma (superficial spreading)
In vertical mode in Figure 7D, irregular conglomerates (red area) of bright ovoid cells (red arrows) corresponding to atypical melanocytes are visible at the DEJ, as an advantage compared to OCT, which resolution does not allow a morphological distinction of melanomas or display of single cells. In Figure 7E) OCT can however provide useful information on the lesion like the tumour thickness and also about vascularization with the dynamic function.
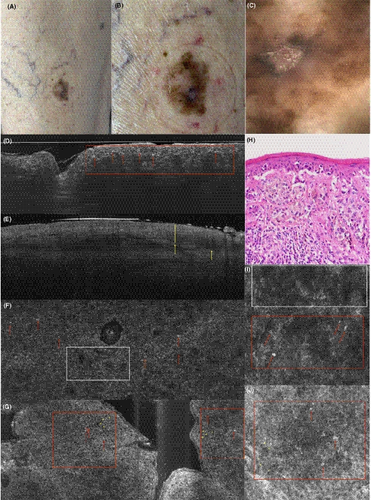
In en-face mode, an atypical honeycombed pattern with altered keratinocytes of different size and shape can be distinguished in both LC-OCT (Figure 7G) and RCM (Figure 7J). The pagetoid spreading of melanoma cells is also visible, showing an invasion of large, hyperreflective round cells with big, dark nucleus and dendritic elements (Figure 7F, G, I, J). The structure of the DEJ is altered, showing irregular non-edged papillae both in RCM and LC-OCT. The PD often also shows irregular, fringed (coarse) collagen fibres, and a prominent vascularization. While RCM resolution for the characterization of single cells remains slightly better, nests of atypical cells and pagetoid spreading are clearly visible in LC-OCT, too.
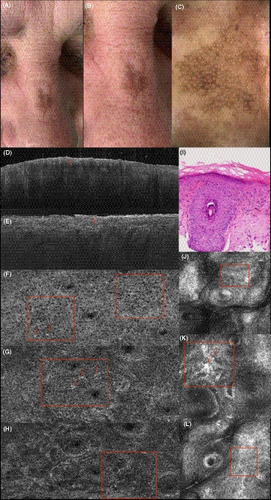
3.1.6 Actinic keratosis
A pigmented actinic keratosis on the nose shows an irregular network of atypical keratinocytes in LC-OCT (Figure 8F, G, H). Individual cells are brighter due to pigmentation, of epithelioid shape (Figure 8G in LC-OCT, K in RCM). In contrast to lentigo maligna, a potential differential diagnosis, they are not grouped around the follicles, In OCT and in the vertical image of the LC-OCT, a thickening of the SC can be seen (Figure 8D in OCT, Figure 8E in LC-OCT). The changes in RCM (Figure 8J, K, L) with an atypical honeycomb pattern correspond to those of LC-OCT.
4 DISCUSSION
In our experience, LC-OCT allows the visualization of single cells in both vertical and en-face mode. Vertical mode is directly comparable with OCT images and histological sections, while en-face mode is overlapping with RCM images and dermoscopy.
As expected, we could evaluate the stratum corneum (SC), the epidermis (EPI), the dermo-epidermal junction (DEJ) and the papillary dermis (PD) using LC-OCT, OCT and RCM. LC-OCT proved to have a higher penetration depth, allowing a more accurate evaluation of PD compared to RCM, a significant advantage for the characterization of, among others, collagen structures and tumour invasion. LC-OCT penetration depth is inferior to OCT (500 μm to about 1.5 mm); this feature can play an important role in the evaluation of the vascular plexus and neoangiogenesis as well as the thickness of invasive tumours, where deeper parts and the lower border can be missed by LC-OCT. The higher OCT penetration depth is however theoretical, since the effective resolution conspicuously decreases in the lower parts of the acquired images (dermis). The lateral resolution of OCT is not sufficient to distinguish single keratinocytes, so that only RCM and LC-OCT allow a cytological evaluation and assessment of atypia. Although the resolution of LC-OCT is slightly lower than RCM, an accurate acquisition free of motion artefacts allows the visualization of single cells, especially in the epidermis and in the en-face mode.
All three diagnostic devices allow a fast and non-invasive in vivo analysis of healthy skin and skin lesions at bedside. They are safe for use in children and pregnant women. They are delivered with a monitor, a mouse, a keyboard and a main computer unit connected to the probe with a cable. They are installed on a wheeled car that can be easily moved to enable bedside diagnostics.
While OCT does not need any interface, both RCM and LC-OCT require the use of immersion oil between the probe and the skin surface to reduce light reflection. Moreover, RCM needs a water-based immersion medium like ultrasound gel to reduce the spherical aberration of the laser beam passing through air and to ensure sufficient penetration of the light to the upper dermis.
Like ultrasound, all techniques are operator-dependent, so that the physician or technician is responsible for selecting the correct location to be analysed: the probe has to be kept stable during the examination in order to ensure a good quality of the acquisition in OCT, LC-OCT and RCM VivaScope® 3000. RCM VivaScope® 1500 requires a plastic window to be fixed to the skin, therefore it allows a more standardized image acquisition and accurate navigation thanks to the attached dermoscopic camera at the cost of a prolonged imaging time of some minutes. The newest version of Vivosight® OCT is provided with a camera, which makes an exact orientation within the lesion easier. A new LC-OCT device with a camera is scheduled for launching in spring 2020. The presence of a dermoscopic and/or clinical camera allows a more accurate examination of selected skin areas and lesions, decreasing the risk of misevaluations due to unwanted relocation or slipping of the probe outside the target area.
Each device provides information about the actual scan depth. However, once the acquisitions have been exported as TIFF or JPEG, the depth is not visible in the single exported images except for RCM.
The short examination time allows the integration of all three devices into the daily routine. The authors observed a mean examination time of around 2-5 min for OCT and LC-OCT, while at least 10 min were needed for RCM due to the complexity of the software and the preparation of the probe.
The provided software is very intuitive in all three devices. The authors found the LC-OCT software the most intuitive and quickest (less than one minute to register a patient´s record, lesion´s location and launch the examination), followed by OCT (around a minute). There are however some software peculiarities for each device. LC-OCT is provided with additional 3D-slicer software, which reconstructs 3D cubes of an acquired stack of en-face images. OCT has extra software for an automated analysis of skin blood flow, skin texture and roughness (beta-version). Images can be easily exported as TIFF or JPEG with all devices. A global export and a single patient/lesion export are possible. An online learning platform and training courses are already available for OCT and RCM and planned for LC-OCT.
5 CONCLUSIONS
The first lesions we measured with all three methods suggest that LC-OCT combines the advantages of RCM and OCT while reducing their disadvantages. LC-OCT seems to have optimal parameters regarding resolution and penetration depth to diagnose all types of skin cancer.
Larger systematic studies are needed to further characterize the field of use of this device and assess its sensitivity and specificity compared to histology.
ACKNOWLEDGMENTS
The authors would like to thank DAMAE Medical for making the LC-OCT system available for this study.
CONFLICTS OF INTEREST
The authors declare that they have no conflicts of interest.


