Characterization of lymphatic malformations using primary cells and tissue transcriptomes
Funding information
This study was supported by the Daland Clinical Investigator Fellowship under the American Philosophical Society (to LKC) and NIH PO1 45548 and private philantrophic funds (to JF).
Abstract
Lymphatic malformations (LMs) are disfiguring congenital anomalies characterized by aberrant growth of lymphatic vessels. They are broadly categorized histopathologically as macrocystic and microcystic. Although sclerotherapy has shown some success in the treatment of macrocystic malformations, there has been less progress with developing treatment strategies for microcystic malformations. In this study, we characterized lymphatic endothelial cells isolated from lymphatic and lymphaticovenous malformations. When compared to cells from normal lymphatic vessels, we found that the primary cultured malformed cells are morphologically different and also exhibited differences in binding, proliferation, migration and tube formation. Transcriptome analysis identified several genes whose expression was substantially higher in malformed compared to normal lymphatic endothelium, including DIRAS3 and FOXF1. Further analysis of LM tissue samples revealed distinguishing gene expression patterns that could pave the way to understanding the molecular pathogenesis of LMs. Based on gene expression signatures, we propose a new hypothesis that the subtype of localized LMs could be formed because of disruptions in lymph node development.
1 INTRODUCTION
Vascular anomalies are deviations from the normal embryonic vascular patterning. Historically, they have been described in terms of their appearance and location and are categorized into two large groups, tumours and malformations.1 Because of the heterogeneity of the endothelium and, until recently, the paucity of known specific markers for arterial, venous or lymphatic endothelial cells (LEC), the current classification is based on clinical, radiologic, immunohistochemical and hemodynamic studies rather than cellular genealogy. Based on their hemodynamics, vascular malformations are further divided into fast- and slow-flow anomalies. Fast-flow anomalies are mainly of arterial origin and slow-flow anomalies are of capillary, venous and/or lymphatic origin.2 Lymphatic malformations (LMs) are characterized as microcystic, macrocystic or combined. The most common sites of LMs are, in the order of prevalence, cervicofacial region, axilla, mediastinum and extremities. Anatomically, they can be grouped into regional/localized LMs, diffuse/generalized LMs or central LMs. The LMs that manifest as soft tissue mass beneath normal skin are the most common cause of soft tissue and skeletal overgrowth. Some patients have combined venous and lymphatic anomalies.
Lymphatic malformations are rare, their frequency has been estimated to be 1:500 live births,3 appearing equally in both sexes. They are evident at birth (50%) or detected before the age of two (80%-90%).4, 5 It is generally believed that LMs develop because of abnormal formation of lymphatic vessels.6 One hypothesis is that LMs are caused by somatic mutations in LEC.7, 8 Lymphatic malformations can also be associated with genetic disorders. Lymphatic malformations can occur in children who have chromosomal abnormalities, such as Turner syndrome (45, X), Trisomy 21 (Down syndrome), Trisomy 18 & 13 and Noonan syndrome.7, 9-11 They can be present in overgrowth disorders, such as Proteus syndrome, which is caused by a somatic activating mutation in AKT1, and CLOVES and Klippel-Trenaunay syndromes that have activating mutations in PI3KCA.8, 12, 13
Lymphatic malformations are disfiguring; since most of them (approximately 80%) are located in the cervicofacial, axillary and mediastinal area, they can also be life-threatening.14 Sclerotherapy is often successful in macrocystic LMs. Surgical resection is the mainstay for microcystic malformations,15, 16 however, removal is often inadequate and there is a high recurrence rate. No drug therapies have been approved for LMs, but ongoing clinical trials compare the efficacies of sirolimus and sildenafil for localized and diffuse LMs (ClinicalTrials.gov).
Despite growing interest, systematic cellular or molecular characterization of these anomalies is scant. Herein, we present a transcriptomic and functional study of LEC derived from two patients with microcystic lymphatic malformation. One patient had a pure microcystic lymphatic malformation, while the other had a combined capillary-lymphatic-venous malformation (Klippel-Trenaunay syndrome). The morphology and growth characteristics of the cultured cells as well as their binding potential for vascular endothelial growth factor (VEGF) -A, -C, and -D were studied. Gene expression profiles of these cells were compared to that of 12 LM tissue pieces. The transcriptomes were analysed to determine whether known gene expression programs could categorize these LM specimens into subgroups and to what extent these LM tissues differed from non-lymphatic tissues.
2 MATERIALS AND METHODS
2.1 Sources of material
Patients were recruited for this study using protocols that were reviewed and approved by the Institutional Review Board at Boston Children's Hospital and Brigham and Women's Hospital in Boston, Massachusetts. Foreskin samples were obtained from newborns undergoing circumcision. Fourteen LM specimens were studied that were excised during indicated operations and otherwise would have been discarded.
2.2 Purification and culturing of normal and pathological lymphatic endothelial cells
Lymphatic endothelial cells were isolated from freshly excised specimens of LMs (LM-cells) or foreskins as described earlier.17 Bead-selected cells were plated on a tissue culture dish coated with 1.5% gelatin (BD Biosciences) and grown in endothelial basal medium (EBM) (LONZA) with 20% human serum (HS) (Irvine Scientific), 30% sarcoma 180-conditioned medium, 10 ng/mL FGF-2 (Scios Nova), 10 μg/mL heparin (Sigma), and 1% GPS, or in full endothelial growth medium (EGM2) (LONZA) with 20% HS. The day after plating, cells were rinsed with PBS and cloning cylinders were placed over colonies of 3-10 LEC, identified by morphology. Prior to placing cloning cylinders, neighbouring non-LECs were removed by aspiration. Once 10-15 colonies had been identified and encircled by cylinders, the entire dish was aspirated to complete dryness. Fresh medium was added and the cloning rings were removed. Future culturing of the cells was in EGM2 with 20% HS. Lymphatic endothelial cells purified from microcystic lymphatic malformation were labelled LM1, and LECs purified from the combined capillary-lymphatic-venous malformation were labelled LM2.
For population doubling studies, all cells were maintained in 6 cm2 plates in a humidified incubator at 37°C and 5% CO2. When cells reached 80%-confluence, they were trypsinized to a single cell suspension, trypsin neutralizer was added, and the cells were counted using a hemocytometer. Depending on the growth characteristics of the individual cell culture, cells were plated at 1500-12 650 cells/cm2. When cell counts at trypsinization were less than or equal to the number of cells plated, the cells were re-plated and their morphology was observed for 1-6 weeks, during which time the medium was changed every 3-4 days. If no change in cellular morphology and growth was observed, they were defined as senescent.
2.3 Flow cytometry analysis of cells
Normal LECs, LM1 and LM2 cells (passage, p4-p6) were harvested and washed with PBS for antigen-specific flow cytometric analysis. Cells were incubated with different monoclonal antibodies against endothelial cell lineage-selective markers, including two LEC specific markers VEGFR3 (EMD Millipore/9D9F9) and D2-40 (Biolegend), three panendothelial cell markers CD31 (Clone JC70A, Dako), CD34 (Clone 581, Dako) and CD146 (S-Endo-1, Abcam), as well as a vascular endothelial-specific marker TIE2 (Clone Ab33, EMD Millipore). All antibodies were directly conjugated to FITC, PE, APC, PERCP for simultaneous analysis in a four-channel flow cytometer. Cells were then washed and analysed on a Cytomics FC500 Flow Cytometry System (Coulter). Flow cytometry measurements were analysed using FlowJo (Tree Star, Inc).
2.4 β-galactosidase staining
Three types of LEC, LEC (p10), LM1 (p6) and LM2 (p7) cells, were cultured in a 24-well tissue culture plate (Fisher). The media was removed when the cells were ~70% confluent, followed by two washes with PBS. The cells were fixed and stained with Senescence β-Galactosidase Staining kit (MSDS 9860, Cell Signaling Technology). In brief, the lymphatics were fixed at room temperature for 10-15 minutes. After washing with PBS, the cells were stained with 1 mg/mL 5-bromo-4-chloro-3-indolyl-βd-galactopyranoside staining solution at 37°C overnight and photographed using a Nikon Eclipse TE 2000E fluorescent microscope (Nikon).
2.5 Binding of VEGFs to lymphatic endothelial cells
Binding assays were performed as described earlier.18-21 Shortly, cells were incubated in binding buffer (EBM, 25 mM gelatin, 25 mM HEPES, pH 7.4) for 3 hours at 4°C with 125I-VEGFA, -C, or -D and then washed with buffer. Bound 125I-VEGF was removed with a high salt (2 M) and low pH (4.0) wash. Binding was quantitated in a gamma counter. Samples were assayed in triplicate and non-specific binding was calculated using excess unlabelled VEGF and subtracted from the total.
2.6 Proliferation assay
For proliferation experiments, cells were seeded at 15 000 cells/well in 24 well dishes in EGM2 medium containing 20% human serum. After 24 hours, the medium was replaced with EBM and 1% serum ± increasing concentrations of growth factors for 72 hours. The cell number was determined by Coulter counter.
2.7 Endothelial cell migration assay
Migration assays were performed as described previously.22, 23 Shortly, the assays were conducted in a modified Boyden chamber. Lymphatic endothelial cells, LM1 and LM2 cells were starved overnight in EBM. Cells were trypsinized and added to the upper wells of the Boyden chamber at a density of 150 000 cells/well in EBM with 0.05% gelatin. The bottom chambers were supplied with medium alone or 1% HS. VEGFA, -C, or -D was added, at either 10 or 50 ng/mL in 1% HS, to the remaining wells. Cells were incubated at 37°C for 6 hours. Cells that had not migrated were removed from the upper chamber by wiping and the cells that had migrated through to the bottom membrane were quantitated using an acid phosphatase colorimetric assay. Standard curves were generated with each cell type using hemocytometer to correlate cell number with acid phosphatase absorbance.20, 24
2.8 Tube formation assay on Matrigel
Cells were plated on Matrigel® (BD Biosciences) coated wells in EGM2 at a density of 100 000 cells/well in 24 well plates, incubated at 37°C and photographed after 24 hours.
2.9 Spheroidal in vitro angiogenesis assay
Multicellular spheroids were generated, as described previously, for blood vessel endothelial cells.25 In brief, subconfluent monolayers of LEC were trypsinized and suspended in Endothelial Cell Growth Medium MV (LONZA) containing 20% filtered HS and 0.2% (w/v) methylcellulose (Sigma). When seeded into non-adhesive 96-well plates (Becton Dickinson) at a density of 500 cells/well and cultured at 37°C (5% CO2, 100% humidity), all cells from each well aggregated to form one single multicellular spheroid. The spheroids were harvested after 24h and embedded into collagen gels as described by Korf and Augustin25 After polymerization of the gel, supplemented EGM2 was added on top of the gel. VEGFA, -C and -D were added in a final concentration of 10 ng/mL for angiogenic stimulation. Serum-free EBM served as a baseline control reference. The gels were incubated at 37°C in 5% CO2 at 100% humidity for 24 hours.
2.10 Oligonucleotide microarray-based gene expression profiling of lymphatic malformations, foreskin samples or purified lymphatic endothelial cells
Total RNA was isolated from lymphatic malformation tissue, foreskin samples, or LEC purified from these tissues using the RNeasy Mini Kit (Qiagen). In specimens of lymphatic malformations and foreskin, frozen tissue was first pulverized using a metal mortar and pestle. Total RNA was preserved at −80°C and was processed in series designed in a stratified way so that inter-series variations would not affect result interpretation (artifactual clustering of samples along anticipated subtypes actually reflecting days of processing). Thus, each processing series contained controls and representatives of the various experimental or clinically discernable groups. 5 μg of total RNA was used for double-strand cDNA synthesis and in vitro transcription/labelling to obtain biotin-labelled cRNA using the GeneChip® IVT Labeling Kit (Enzo Life Sciences) according to the manufacturer's instructions. Labelled RNA was hybridized to oligonucleotide microarrays (GeneChips, U95Av2, Affymetrix) that represent >12 558 transcripts. Hybridization, washing and detection were performed by the microarray core facility at the Massachusetts Institute of Technology.
2.10.1 Low-level analysis
Low-level analysis of expression profile data from these tissue samples was performed using the Microarray Suite (MAS) 5.0 and GCOS from Affymetrix. All signals were first scaled with the MAS 5.0 scaling function to the same target intensity. Both absolute detection analysis (used for sample-centric cluster analysis—see below), as well as comparative analysis with probe-level computing of relative expression (ie, fold change, log2(sample signal/reference signal) = “signal log2 ratio” = SLR, computed by MAS 5.0, for gene-centric analysis of differential expression) was performed. The entire set of genes on the microarray was filtered to eliminate genes that were not expressed above a confidence level in the absolute detection according to probe-level (16 probes per gene) non-parametric statistical analysis in MAS 5.0. For this purpose, the alpha value was set so that P < 0.03. To increase stringency for comparative analysis in the gene-centric setting, a cut-off for fold change (SLR) was set requiring SLR > between 1 and 2 (ie, =2-4 fold), as indicated in the respective context. In the profiles of cell cultures (LEC, LM1, LM2), sufficient RNA could be obtained so that at least three independent replicates (with respect to RNA processing and hybridization) of biologically identical samples were measured permitting establishment of an error model for estimating appropriate cut-offs.
2.10.2 Higher-level analysis
For the sample-centric analysis (comparison with previously published gene expression profiles of other tissues), expression profile data downloaded from GEO were used (GSE1347)26 as well as from the data set analysed in Barnes et al27 (for: haemangioma, lung, brain and muscle. All these data sets are based on the Affymetrix GeneChip U95Av2.
Unfiltered expression profiles were normalized using rank-invariant normalization, implemented in MatLab 6.5, applied to the summarized detection values generated by MAS 5.0/CSOS.28 For the comparison of tissue clustering capacity of the five gene sets, the genes were extracted as follows: (a) whole transcriptome (all 12 558 transcripts on the Affymetrix GeneCHip U95Av array), (b) transcription factors (1090 transcripts, identified based on gene ontology (GO) terms “transcription regulator activity”, “transcription factor activity” and “sequence-specific DNA binding”), (c) genes involved in lymphangiogenesis (31 transcripts, from a manually curated list),29-33 (d) genes involved in vasculogenesis as well as known vascular malformation genes (77 transcripts, manually curated list33-35) and (e) genes expressed differentially in the lymphatic malformation cells when compared to the normal LEC (155 transcripts) - equivalent to higher relative expression in the malformation of at least 4-fold more or lower relative expression of at least 0.6-fold (<0.5 × normal level) less compared to the normal LEC cells as reference. This asymmetrical range reflects the asymmetric deviation of expression in the malformation LEC relative to the normal cells in that only two genes were decreased by more than 4-fold. For this comparison, the average value of two distinct cell lines derived from lymphatic malformations in two different patients was used.
For the hierarchical clustering of the tissue samples, a matrix of the pair-wise distances between all 27 samples based on the dissimilarity metric D = 1 − r, where r is the Pearson correlation coefficient computed from the filtered and normalized data was used. Average linkage was employed for dendrogram generation. The self-organizing maps displaying gene expression patterns was generated using Gene Expression Dynamics Inspector (GEDI program) and were also based on the Pearson correlation coefficient (option in GEDI).36 To compare the robustness of the separation of the LM cluster from the rest of the samples, the Davies-Bouldin index (DBI) was computed for the five gene sets with respect to their capacity to separate these two large clusters.37 In brief, the DBI is the ratio of the sum of the intra-cluster distances between the samples, divided by the sum of the inter-cluster distances between all the samples. The “cluster” refers to the two nominal (a priori known) groups, LM and all other tissues. The distances were computed as D = 1 − r with respect to each of the five gene sets.
2.11 Quantitative real-time RT-PCR
All target transcripts were detected by quantitative real-time RT-PCR assays using SYBR green. β2-microglobulin was used as an endogenous control for normalization. Primers were designed (in Oligo 5) to produce a product length between 100 and 150 bp and positioned in different exons of the gene. The primer sets for detection of the DIRAS3 and FOXF1 are presented in Supplementary Methods. RT-PCR reactions were performed in triplicate according to manufacturer's conditions (see Qiagen OneStep RT-PCR Kit), using the automated Mx4000 Multiplex Quantitative PCR System (Stratagene) and the QuantiTect SYBR Green RT-PCR Kit (Qiagen). Thermal cycling conditions were as follows: 30 minutes at 50°C, 15 minutes at 95°C and 40 cycles of 15 seconds at 94°C, 30 seconds at 60°C, 30 seconds at 72°C. A no template control (NTC) was performed for each primer pair. RT-PCR products were checked on a 2.0% agarose gel to confirm primer specificity. For each sample, the ΔCt values were determined by subtracting the average of triplicate Ct values of the target gene from the average of triplicate Ct values of the reference gene (β2-microglobulin). The relative gene expression level was also normalized relative to a positive calibrator, consisting of one of the samples from the calibration curve. The relative gene expression level of the calibrator (ΔCt calibrator) was also determined by subtracting the average of triplicate Ct values of the target gene from the average of triplicate Ct values of the reference gene. The increase in expression was determined as: Fold-increase = 2−(ΔCt sample − ΔCt calibrator).
3 RESULTS
3.1 Characterization of primary normal and malformation lymphatic endothelial cells
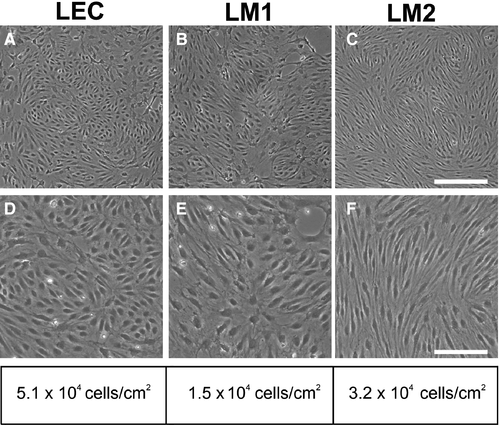
To purify LEC, we used a highly specific and sensitive surface marker, VEGFR3.38 We reported earlier that LEC are larger than blood endothelial cells (BEC).17 The LEC lines derived from LM patients, LM1 and LM2, were 3.4 and 1.5 times larger than normal LECs, respectively (Figure 1A-F).
We next analysed surface marker expression by flow cytometry. Approximately 15%-25% of all cells derived from human foreskin tissue and 40% of all the cells obtained from LMs were positive for the LEC marker VEGFR3 (data not shown). During culturing, VEGFR3 expression on the LM1 cells was lost by passage 4, while normal LECs and the LM2 cells continued to exhibit prominent and sustained VEGFR3 expression (Figure 2). All LEC and LM2 cells stained positive with D2-40, an antibody that recognizes the lymphatic endothelial cell surface marker podoplanin. However, only 30% of cells in the LM1 cell population stained positive for D2-40, consistent with previous reports of partial D2-40 positivity for small lymphatic vessels.4, 38-40
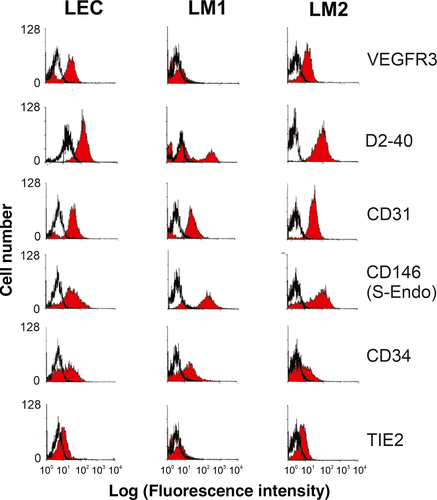
All lymphatic endothelial cell populations contained cells positive for PROX1, the master regulator that is a major determinant of LEC identity,32, 41-46 thus, further supporting their lymphatic endothelial cell origin (Figure S1).
By contrast, a subset of cells was positive for the panendothelial markers CD34, CD31 and CD146. All cells were negative for the blood endothelial marker TIE2 (Figure 2).47
3.2 Response to VEGFs
Because various VEGF-family members are important in vascular development, we systematically examined the effect of VEGFs on our LM-cells and LECs. Equilibrium saturation binding studies using radiolabelled VEGFA, -C and -D were conducted to determine whether the binding profiles of the cell lines were substantially different. The two LM cell types were compared to cells from normal lymphatic vasculature. All cell types exhibited affinities for the three VEGF-family members of interest. Notably, LM1 cells had the highest capacity to bind all three VEGFs. Saturable binding of VEGFA, -C and -D was at least 5-fold higher on LM1 cells compared to normal LECs and LM2 cells (Figure 3A-C). LM2 cells had only weak affinity for VEGFA (Figure 3A). Since confluent cultures were used for these studies and the cells differed substantially in size, the cell number for each different cell type differed, although the total surface area was equal. This means that the greater binding capacity of the larger LM1 cells was due to an increase in total binding sites per area of monolayer and not due to a difference in cellular size.
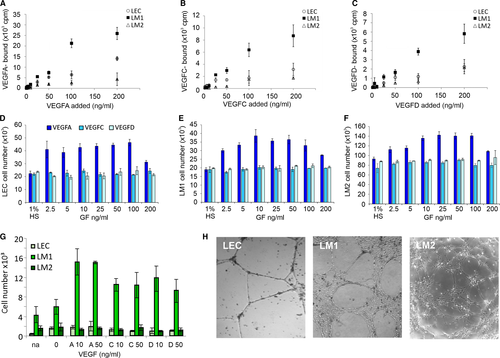
Proliferation assays for the LEC, LM1 and LM2 cells (Figure 3D-F) revealed that all cell types responded strongly to VEGFA. Baseline proliferation of LM2 cells, however, was higher than that of normal LECs or LM1 cells (note the 1% serum control, no VEGF, experiments in Figure 3D-F, and the different scales for cell numbers on the vertical axis). Over 72 hours, after seeding of 15 000 cells in the presence of only 1% HS, LM2 cell numbers increased to 90 000, whereas LM1 cells and LEC only grew to 20 000 cells (Figure 3D-F). Addition of VEGFA enhanced the proliferation of all three cell types by up to two-fold above the basal proliferation rate in a dose-dependent manner. By contrast, there was no proliferative response to VEGFC and -D despite their specific binding to the cells (Figure 3D-F).
Since endothelial cells exhibit high motility and activity associated with vessel formation, we tested their potential to migrate in response to VEGFA, -C or -D using a modified Boyden chamber assay. As shown in Figure 3G, the migration of normal LECs and LM2 cells was low in both under unstimulated conditions cells and in the presence of VEGF. By contrast the LM1 cells exhibited substantial baseline migration that was further enhanced by all three VEGF-proteins, as evidenced by chemotaxis assay, in agreement with finding by Lokmic et al for LMs.44 Thus, unlike the proliferation studies, the migration response correlated with the binding properties observed for VEGFA, -C, and -D (Figure 3A-C, G).
On Matrigel®, LECs formed highly organized networks in serum in the absence of additional growth factors (Figure 3H). LM1 cells formed structures that appeared thick and cord-like, whereas LM2 cells formed severely impaired tube-like cords (Figure 3H). Addition of VEGFA, -C or -D did not enhance the ability to form tubes or extend the life of the tube-like structures (data not shown).
To test the potential of LM-cells to invade into collagen, matrix cells were embedded as spheroids and stimulated with VEGFA, -C or -D (Figure S2). Lymphatic endothelial cells showed little sprouting in the absence of VEGFs but responded well to VEGFA, -C and -D. LM1 cells exhibited prominent sprouting even in the absence various VEGFs. The potential of LM2 cells to sprout was lower than the other cell types. Thus, sprouting ability correlated with migration.
In summary, the biological studies suggest that the pathological cells exhibit distinct properties. They displayed either increased proliferative or migratory activity but not both together, compared to that of normal LECs (Table S1). It is possible that either property may be sufficient to initiate and drive the expansion of the malformation. This finding supports the hypothesis that the pathogenesis of lymphatic malformation has a cell-intrinsic component that governs its altered response to soluble growth factors.
3.3 Transformation Potential
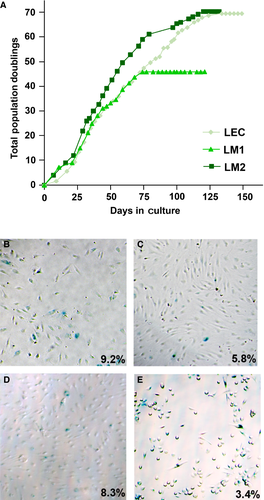
Given the active proliferative state, notably of LM2 cells, we used four assays to determine whether the malformed LECs represent aspects of malignant transformation. We first determined the life span of different LECs by population doubling (PD) studies. The cells underwent senescence at 69.42 (LEC), 45.86 (LM1), and 70.31 (LM2) population doublings (Figure 4A). β-galactosidase assays revealed higher rates of senescence for all the LEC (Figure 4B-D) compared to a control prostate cancer cell line PC3M (Figure 4E). The percentages of β-galactosidase stained cells were, at the indicated passage (P) as follows: 9.2% for LEC P10 (n = 903 cells); 5.8% for LM1 P6 (n = 3046) 8.3% for LM2 P7 (n = 870); 3.4% for PC3M P5 (n = 1194). Furthermore, the cells did not form colonies in soft agar when incubated for 15 days (data not shown). In addition, LM-cells injected on the back of a SCID mouse also did not grow tumours over a three-month observation period (data not shown). Thus, LM-cells do not display signs of malignant transformation in our assays.
3.4 Genome-wide gene expression profiles of LM tissues and cells
We used oligonucleotide microarrays (Affymetrix U95Av2) to compare the transcriptomes of normal LECs, LM-cells and of surgical excision samples from several patients with various clinical types of LMs: one microcystic, one macrocystic, seven combined LMs, three CLVM, and one lymphoedema (Figure 5A-E and Figure S3A-K). Furthermore, for comparison, we included as controls previously published transcriptomes (obtained using the same Affymetrix U95Av2 format) for two infantile haemangiomas, two adult lungs, two brains, two muscles and three bone marrow aspirates (Figure S3A-G).26, 27 These tissues were selected with the following rationale: haemangioma is a childhood vascular tumour that is driven by uncontrolled vascular endothelial cell growth; lungs have an extensive lymphatic network, bone marrow cells have been shown to contribute to lymphatic neovascularization,48-50 whereas brain tissue contains no lymphatics, and muscle tissue has few lymphatic vessels, thus serving as negative controls. Due to the small sample size of the various LM types and the often subjective classification based on morphology, we did not expect to be able to distinguish between the clinical subtypes by using the transcriptome information (class identification and discovery).51 Instead we aimed at positioning these pathological tissues in the transcriptome space of various body tissues of related vascular nature, in order to obtain a first molecular characterization of possible origin and development of LM.
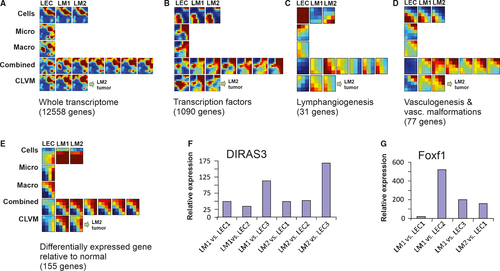
We analysed our samples by asking to what extent five different functionally defined sets of genes are able to group the LM tissues together and separate them from the control tissues. These different sets of genes were as follows: (a) whole transcriptome as represented by all the 12 558 transcripts; (b) transcription factors (1090 transcripts); (c) genes involved in lymphangiogenesis (31 transcripts): (d) genes involved in vasculogenesis, including known vascular malformation genes (77 transcripts); and finally, (e) genes that are differentially expressed in lymphatic malformation LECs in comparison to normal LECs (155 transcripts). (See Section 22 for inclusion criteria and definition of these gene sets.) (Figure 5 and Figure S3A-K).
Since pathology of LM appears to display a cell-autonomous component, we first compared the cells rather than tissue samples of the LM to normal LECs. This allowed us to identify genes that were differentially expressed between LM-cells and LECs without the confounding effects of other cell types in the tissue samples. The list of genes whose transcripts were consistently and maximally differentially expressed (at least 4-fold increase or 2-fold decreased), in both malformation cell lines, LM1 and LM2, is shown in Tables S2 and S3 (see also Section 22). Two genes stood out as highly expressed in both LMs: DIRAS3 (200-fold increase) and FOXF1 (100-fold increase) (Tables S2 and S3). For comparison, the third and fourth most differentially expressed gene was increased only by 32-fold in the LM-cells compared to the normal LEC (genes CYP1B1 and ANXA3). Real-time RT-PCR corroborated the finding that DIRAS3 and FOXF1 were specific to LM because they were low (just detectable) in three different LEC lines (Figure 5F,G).
We next asked, by using the gene expression patterns encompassing the heuristic gene sets, if we could separate out the LMs from the other vascularized tissues and which gene set has strongest discriminatory power. Analysis of the gene expression patterns for all five gene sets using self-organizing maps (GEDI program) and traditional hierarchical clustering revealed that the LM samples were readily distinguished from those of the various tissues of the body examined (Figure S3A-K). The brain samples were virtually negative for the transcripts of the lymphangiogenesis set (blue colour in the GEDI maps), consistent with the fact that brain has no lymphatic tissue (Figure S3C) except in meninges.52 Within the LM tissues, only small differences were evident between the clinically annotated types of LM. Overall, for five gene sets, the patterns of the GEDI maps were not significantly different between the various nominal types of LM, including between pure vs. combined LMs. While the numbers of samples in this study are too small in view of the heterogeneity of the cases to conduct a class (disease subtype) identification and discovery, and to determine associated discriminatory marker genes,51, 53 this finding supports the idea that the various LMs share the same cellular origin and are molecularly distinguishable from other vascular lymphatic tissues (Figure 5, Figure S3A-E).
Gene expression profile comparison using three sets of genes, the whole transcriptome, the transcription factors and the vasculogenesis genes, all suggest that malformed and normal LECs are very similar. These gene sets also were the only ones that could separate the haemangioma from the malformation samples, but they lumped all LMs together (Figure S3A,B). By contrast, at the cellular level, when we compared the set of genes defined by their involvement in lymphangiogenesis to the normal LEC and the LM-cells, they appeared quite different from each other. Specifically, in normal LECs the lymphangiogenesis genes were highly expressed while in the LM-cells the same genes were expressed at low levels, as in the various tissues. This may indicate a problem in maturation of LM-cells per se (Figure S3C).
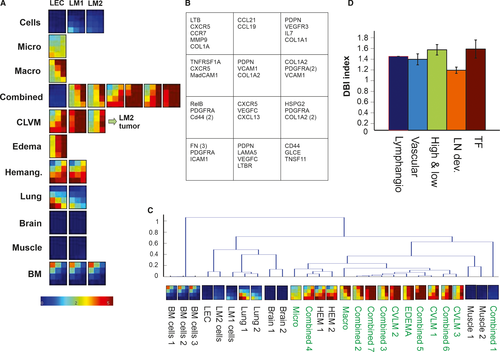
Of particular interest is the analysis based on a gene set composed of genes known to govern lymph node development. We hypothesized that LMs may result from immature and malformed lymph nodes (see Section 46). This set of genes was selected based on their known roles in lymph node development (Figure 6A,6).54 Intriguingly, when we quantitated the discriminatory power of the gene sets (after normalization for gene number) in separating out the LM tissues from the rest using the DB-index (see Section 22) the set of nodal genes performed best (Figure 6C,6).
4 DISCUSSION
Factors that regulate formation of the lymphatic system are well-characterized, but the mechanisms that explain pathogenesis and expansion of LM are still poorly understood. Herein, we stimulated lymphangiogenic processes in LM-cells with various VEGFs and performed a transcript analysis from both cells and tissue samples to determine novel genes that could help explain LM pathogenesis. We focused on VEGFA, -C and -D, which bind to VEGFR2 and-3 expressed on LEC.55 We did not study VEGFB, which recently has been shown to be expressed also in LMs56 because it binds to VEGFR1 which is expressed in vascular endothelium.
Of the three cell types examined (two from malformations and one from normal lymphatic vasculature), the malformation LM1 cells migrated and sprouted best while the LM2 cells had most prominent baseline proliferation. Both malformed cell types displayed some response to VEGFC, but response to VEGFA was more prominent. This could be mainly due to the growth conditions in culture in which VEGFA instead of VEGFC was the main growth stimulus to which the cells adapted.55 It has also been reported that VEGFA responses mimic those of VEGFC, although the activation pathways differ.55 Furthermore, overexpression of both VEGFA and VEGFC leads to lymphatic vessel hyperplasia: VEGFC-stimulated hyperplasia develops during embryogenesis while VEGFA-induced hyperplasia appears during the postnatal life.57-59 We performed our assays in cells that had passed through several population doublings and therefore might been in a state that mimic the cells of the postnatal stage of development.
Although our two LM-cells behaved phenotypically quite differently, the gene expression patterns of patient samples with clinically distinct types of malformation shared strong similarities to each other with respect to expression of the gene sets of interest. Due to the small sample size of this study, we did not try to find transcript patterns that would discriminate between macro- and microcystic samples as demonstrated by Gomez-Acevedo et al4, 56
The two genes most highly overexpressed in LM-cells were FOXF1 and DIRAS3. Although we might have lost the more specific VEGFC target genes during culture, VEGFA and VEGFC stimulation of LECs has been shown to trigger the same early response consisting of the robust upregulation of a shared set of signalling molecules and transcription factors.60 FOXF1 is a transcription factor that belongs to the forkhead family. During vasculogenesis, it is required for formation of embryonic vasculature and VEGF signalling.61 By contrast, during early lymphangiogenesis FOXF1 is important for generation, migration and reassembly of lymphatic progenitor cells.62 In addition, FOXF1 and FOXC2 haploinsufficiency is correlated with macrocystic LMs.63 Interestingly, deficiency of FOXC2 during development causes impaired patterning of the lymphatic vessels in the tissue.64
DIRAS3 is a GTPase that belongs to the Ras-superfamily. Ras-signalling pathways play a role in disorders of development and function of lymphatic vascular endothelium (see review65). Unlike the other Ras-family members, DIRAS3 acts a tumour suppressor gene and is maternally imprinted.66 DIRAS3 has been shown to inhibit cell migration through inhibition of Stat3 and FAK/Rho signalling.67 Interestingly, two Ras-superfamily GTPases, Rac2 and RhoC, and two downstream targets, PIK3CA, a component of survival and mitogenic signalling pathways whose activated mutations is found in many cancers, and its regulatory subunit PIK3R3, were also elevated in our microarray data. This finding is consistent with the cell-intrinsic hyper-proliferative phenotype of the LM2. Activating mutations of PIK3CA and PIK3R3 have also been found in germ line and somatic cells of LM patients.12, 44-46, 65, 68
Only a few studies have addressed whether LEC proliferate in LMs; and two studies did not find prominent proliferation in vivo.4, 69 Our study was undertaken under the common hypothesis that lymphatic malformations result from an abnormal formation of lymphatic vessels because of uncontrolled growth of primitive/embryonic LEC.44-46 While some LM-cells do exhibit increased proliferation, they age in the similar manner as other cultured endothelial cells.70 They lack any sign of transformation44, 71 and the finding of anomalies in migration suggests that lymphatic malformations may represent a more complex developmental function as opposed to just excess growth the lymphatic vessels. In mouse studies in which genes involved in LEC development have been knocked out, the typical phenotype is dilated vessels, local oedema and hyperplasia, not lymphatic malformation.72, 73
Our broader transcriptome analysis complements the cell functional analysis. It suggests that LM may not simply be due to a cell-intrinsic property of abnormal growth and migration. We propose that abnormal communication between an aberrant immature lymphatic endothelium with surrounding stroma during early stages of development of lymph nodes may be the critical pathogenetic factor. Specifically, the finding that genes involved in lymph node development performed best in separating the LM as a cluster from other tissues, supports the hypothesis that lymphatic malformations, at least one subset of LMs, namely the central localized form which appear near lymph nodes, could result from errors in lymph node development. Furthermore, when comparing the LM-cells to normal LEC cells, we found a decrease of expression of all genes involved in lymphangiogenesis, which is consistent with disrupted development. The fact that the CLVMs could not be separated from “pure LMs” in the cluster analysis using the lymph node genes despite the obvious and natural morphological separation of these malformations, suggests a more complex and diverse mechanism of LMs.
This hypothesis is supported by published discoveries highlighting the tight mutual connection of between lymph node and lymphatic vascular development. Two studies suggest that LECs are required in lymph node development and that if normal LECs are not present, formation of lymph nodes is disrupted.54, 74 In addition, several clinical observations support the connection between formation of lymph nodes and lymphatic vasculature. Lymphatic malformations most often occur in the areas where primitive lymph sacs and lymph nodes are located.14 LMs are congenital and fail to develop normal communications with draining vessels.14, 75, 76 The drainage from the upper and lower body is normal, however, and this suggests that the problem is not in the formation of lymphatic vascular tissue. Finally, the presence of lymphoid follicles within lymphatic malformations is a prominent histologic finding that lends further credence to the hypothesis of a lymph node origin of lymphatic malformations.77-79
During the last 20 years, we have acquired detailed understanding of the role of genes and their interactions that play a role during normal development of the lymphatic system. Despite the steady increase in the number of studies of LMs, our knowledge of the pathogenesis of LMs as a departure from normal development remains in its early stage. In this study, we purified malformation cells, studied their response to stimulation by growth factors of the VEGF-family and performed gene expression profiling on both the purified cells and patient tissue samples. Our results support the literature on the role of intrinsic factors in the progression of LMs. In addition, our results support a new hypothesis for the very early, initial steps of pathogenesis. Lymphatic malformations may result from a misguided development in an associated organ, namely the lymph node in which an absence of appropriate differentiation signals causes lymphatic cells to keep proliferating, thus forming a malformation.
ACKNOWLEDGMENT
We thank Arshiya Ahuja for technical assistance and Dr Joseph Zhou for help in analysing the microarrays and thank Dr Jacqueline Noonan for helpful discussions. We dedicate this work to the memory of Dr Judah Folkman.
CONFLICT OF INTEREST
Authors declare no conflict of interest.
AUTHORS' CONTRIBUTIONS
AK, EC, LC, BZ, HS, AS and MF conceived and designed the experiments. AK, EC, LC, BZ, HS, AS and MF performed the experiments. AK, MF, SH, HPWK, SJF, JBM and JF analysed the data. HPWK, SJF, JBM and JF contributed reagents/materials/analysis tools. AK, MF, SH, JBM and JF wrote the paper.


