Competitive devaluations in commodity-based economies: Colombia and the Pacific Alliance Group
Abstract
This paper investigates whether there is an S-curve in Colombia using bilateral and disaggregated quarterly data for the period 1991 to 2014. More precisely, the short-run effects of a depreciation on the trade balance (TB) are analyzed in 27 industries covered by the Pacific Alliance Group free trade agreement. The S-curve found in sectors representing 30 percent of total industrial production suggests that in these cases competitive devaluations have a positive effect on the TB in the short run. Our findings have important policy implications: since only large competitive devaluations can restore TB equilibrium, industrial restructuring would appear to be a more sensible strategy, though this cannot be achieved in the short run and is instead a medium- to long-term goal.
1 INTRODUCTION
At time of writing days sharp decline in oil prices has led to a significant deterioration of the trade balance (TB) in Colombia. Policy makers have responded by devaluing the currency and signing up to the Pacific Alliance Group (PAG) free trade agreement (FTA). The aim of this study is to evaluate the effects on trade flows of this type of competitive devaluation in a commodity-based economy such as Colombia. The TB in commodity-based economies tends to cyclically deteriorate when commodity prices tend to fall. In general, policy makers use devaluations to provoke a shift in the country export composition toward one that mitigates the exposure from international commodity price fluctuations. However, empirical literature shows that this expected result remains mixed. In this regard, this article explores if a commodity-based economy could improve the TB of industrial goods through manipulation of the exchange rate policy and engagement with the PAG-FTA.
According to the price elasticity approach a devaluation should increase exports by making them cheaper in terms of foreign currency, and decrease imports by making them more expensive in terms of domestic currency. However, the empirical evidence is rather mixed. Magee (1973) reported considerable time lags. These could be even more significant in the case of a commodity-based economy such as Colombia, which is highly dependent on oil exports that represent almost 80 percent of total exports.1 For example, while competitive devaluations are a tool that policy makers have to promote external competitiveness, the time required to develop an industrialized export portfolio emerges as a potential constraining condition. In actual fact, can we expect a prompt recovery in exports of industrial goods through lower domestic prices of capital and labor? Therefore, the motivation in this article is on whether a competitive devaluation may produce industrial exports within the PAG in the short run.
Figures 1 and 2 show that the Colombian TB is positively/negatively correlated to the oil price index/nominal exchange rate. It can be seen that during periods with higher oil prices (the first decade of this century) the TB is in surplus, and the nominal exchange rate appreciates. Hence, the effects of a competitive devaluation on the external performance of a commodity-based economy may be neutralized during periods of high commodity prices.

Trade balance and oil price index evolution
Source. DANE (www.dane.gov.co).
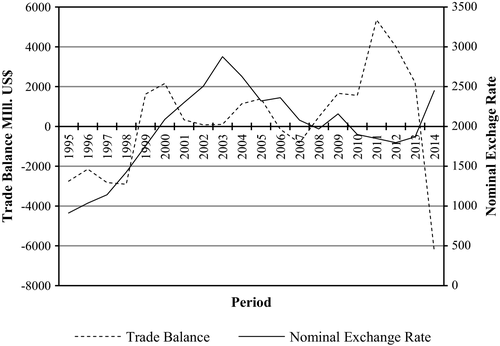
Trade balance and nominal exchange rate evolution
Source. DANE (www.dane.gov.co).
Figure 3 shows the Colombian TB vis-à-vis its PAG trading partners during the period 1995 to 2015. While it remained in surplus in all cases except vis-à-vis Mexico, overall there was a negative trend, with increasing deficits with respect to the United States, China and other advanced economies. Thus, given that Colombia's largest trade is with non-PAG members, what will be the nature and volume of the trade inside the PAG-FTA in order to reverse the negative performance? Indeed, an elasticity approach to enhance the external performance seems to be a simple way of understanding a commodity-based economy TB complexity. In this sense, the same doubts could be raised for all the members of the PAG-FTA, as well as for those countries sharing a regional FTA, in which trade with industrialized nations is strong. For example, would policy makers and businessmen expect Colombia to produce higher trade diversion and lower trade creation?
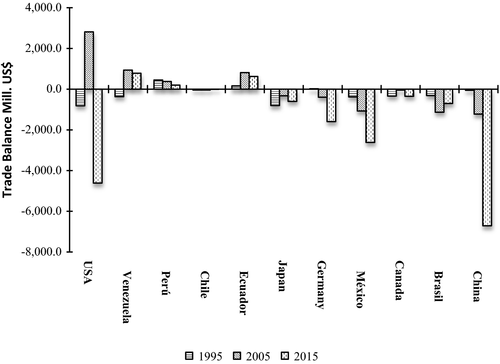
Colombia's trade balance vis-à-vis its main trading partners
Source. DANE (www.dane.gov.co).
This study makes a twofold contribution. First, it analyzes the short-run effects of a devaluation of the peso on Colombia's TB vis-à-vis its PAG trade partners, for which no previous evidence is available, during the period 1991 to 2014. Second, by using bilateral data disaggregated by commodity, it sheds light on the role played by different industrial sectors, an issue that has also been relatively neglected in the literature (Bahmani-Oskooee & Ratha, 2007; Bahmani-Oskooee & Ratha, 2008). For this purpose, it follows the S-curve approach of Backus, Kehoe, and Kydland (1994), whose analysis is based on the shape of the cross-correlation function. The S-curve is an alternative method to the well-known J-curve analysis of testing the short-run relationship between the TB and the terms of trade or the real exchange rate. As in Backus et al., the assumption of the model is that the cross-correlation coefficients between the current exchange rate and past values of the TB are positive. Then, cross-correlation coefficients between the current exchange rate and future values of the TB are negative. This asymmetric shape of the cross-correlation function describes a horizontal letter S, namely the S-curve. Indeed, while policy makers in developing economies used to depreciate home currencies in order to increase exports, adjustment lags such as production, delivery and so on produce an initial deterioration of the TB, with an expected improvement in the future. Therefore, the S-curve analysis is based on the plot of the lagged cross-correlation coefficients between the bilateral real exchange rate and the TB. The model assumes that the initial TB deteriorates after a devaluation episode, then the TB improves as a result of rising terms of trade. Then, the plot of the coefficients will describe a horizontal S-curve shape. The interpretation is similar to the J-curve analysis, which also plots the behavior of the coefficient between the exchange rate and the TB in the short term.
Colombia's macroeconomic policy motivates an overall discussion on the price elasticity stimulus against diverse forms of international competition, and the exploration of mechanisms through which a commodity-based economy might transform its export portfolio into an industrialized one. In the case of Colombia, policy makers also make it through the PAG-FTA trade strategy. Thus, the leads and lags analysis proposed in Backus et al. (1994) becomes relevant. Certainly, little is known regarding the effects of devaluation and its successful pass-through effect between the PAG members. Hence, new empirical evidence is highly desirable to shed light on policy makers and businessmen in commodity-based economies regarding the competitiveness of industrial sectors based on an elasticity approach. For example, the potential effects of lags and leads may affect both macroeconomic policy and firms’ allocation of resources. Magee (1973), Meade (1988), and Backus et al. (1994) observed that prices and trade dynamics are also determined by orders and the time to deliver imported goods, and the time required for exporters to change capacity.
The remainder of the paper is organized as follows. Section 2 briefly reviews the literature. Section 3 outlines the methodology. Section 4 describes the data and presents the empirical results, while Section 5 offers some concluding remarks.
2 LITERATURE REVIEW
Based on the principal interest in this article, we find several related items of literature that contribute to the debate on our research proposal. First, we find an appropriated logic on the empirical methodology utilized in this study in order to analyze the effects of devaluations on TB in a commodity-based economy. Second, we find a very fruitful discussion on the nature of trade that it is potentially created inside the PAG-FTA. For example, trade diversion or trade-creation effects emerge as a major challenge for the PAG.
The literature on the TB effects of currency depreciations (appreciations) is extensive. Various papers investigated whether there is a so-called “J-curve,” with devaluations leading to a short-run deterioration of the TB but a long-run improvement (see Bahmani-Oskooee, 1985; Rahman, Mustafa, & Burckel, 1997; Himarios, 1989; Rose & Yellen, 1989; Briguglio, 1989; Noland, 1989; Rose, 1990; Berument & Dincer, 2005), with mixed results. Most studies use bilateral aggregate data (see, e.g., Boyd, Caporale, & Smith, 2001; Lal & Lowinger, 2002; Onafuwora, 2003; McDaniel & Agama, 2003; Fullerton & Sprinkle, 2005; Narayan, 2006; Bahmani-Oskooee & Hegerty, 2011; Dash, 2013; Costamagna, 2014), again providing mixed evidence. However, as pointed out by Rose and Yellen (1989), there might be an “aggregation bias” affecting those results. Therefore, some papers have analyzed disaggregate data instead (see, e.g., Baek, 2007; Bahmani-Oskooee & Hegerty, 2010, 2014).
In commodity-based economies, higher (lower) commodity prices could lead to appreciations (depreciations) of the currency. For example, Habib and Kalamova (2007), Kalcheva and Oomes (2007), Jahan-Parvar and Mohammadi (2008), Korhonen and Juurikkala (2009), Hasanov (2010) find that the real exchange rates in oil producing countries appreciate in the long run as a result of higher oil prices. Since the seminal paper of Backus et al. (1994) on the S-curve, various studies using aggregate (Bahamani-Oskooee et al., 2008), bilateral (Bahamani-Oskooee & Ratha, 2007), and industry-level (Bahamani-Oskooee & Ratha, 2009, 2010) data have also been carried out on this topic.
In addition, there exists an extensive literature on the effects of regional integration on trade flows. Most studies are based on Viner's (1950) framework and analyze the dynamic effects of geographical size, industry location, and economies of scale (see, e.g., Caporale, Rault, Sova, & Sova, 2009). Viner shows that a move to free trade between two countries that maintain their respective external tariffs toward the rest of the world could leave both countries worse off. If one country switches from trade with a relatively lower-cost producer (non-FTA member) to trade with a relatively higher-cost producer (FTA member), this would potentially decrease welfare for all the parties to a FTA. This effect is given the term trade creation (TC). In contrast, if a country imports from a lower-cost producer that is an FTA member, this is categorized as trade diversion (TD). Thus, a preferential trade arrangement and consequent trade diversion may reduce welfare if they create regional import substitution (see De Melo, Panagariya, & Rodrik 1993). As Frankel and Wei (1998) pointed out, geographical proximity or distance is a key factor for Free Trade Agreements (FTAs), given the importance of transport costs (Helpman & Krugman, 1985). However, Krugman (1991) argues that most regional trade arrangements probably entail relatively low welfare losses resulting from TD because the trader countries are often geographical neighbors. Therefore, the question is whether the PAG-FTA would contribute to Colombia's TB. For example, none of the PAG members are classified as an industrialized economy, hence, imports of industrial inputs and goods from industrialized economies are plausible. A desirable result could be one where, for example, in the NAFTA FTA, U.S. textile and apparel exports to Mexico increased by 210 percent while imports from Mexico increased by 283 percent between 1993 and 2001 (Villarreal, 2003). In this regard, TD versus TC will be the next challenge for the PAG members.
Magee (2004) found that the effects of TC are approximately three times as large as those of TD in the fifth year of regional FTAs formed between 1985 and 1994. However, empirical evidence on the effects of PTAs on trade flows is mixed. Sohn and Lee (2010) find that not only do FTAs foster growth through a trade-creation effect, but the economic growth of nations overall. However, results in Moncarz, Olarreaga, and Vaillant (2016) find that the MERCOSUR (Mercado Común del Sur—South American Common Market) has contributed to achieving the industrialization objectives of one party (Brazil) through exports within the region of goods in which the country does not have a comparative advantage with regard to the rest of the world. It is a fact that regional integration would be more beneficial for one of the parties involved with the preferential agreement. Therefore, this is one of the major questions that policy makers should consider for policy implications.
Finally, the theoretical arguments about which country pairs find preferential trade agreements owing to higher expected economic gains is the natural trading partner hypothesis. The hypothesis maintains that regional trade with partners that are geographically close, and with whom they have significant bilateral trade, causes countries to be trade creating rather than trade diverting (Krugman, 1995). In the context of the PAG-FTA, the natural trading partner hypothesis provides an optimistic assessment. There are no doubts that PAG partners have a geographical advantage, but all of the members are industrialized economies that deal with sophisticated goods and lower-cost ones. Perhaps Mexico's membership of the NAFTA FTA may give the PAG partners an opportunity to expand trade and thus economic benefits, but it is a challenge with unexpected results.
3 EMPIRICAL METHODOLOGY
This study examines the short-run effects of devaluations on the Colombian TB as in Backus et al. (1994), namely using the cross-correlation function between the TB and the real bilateral exchange rate (RBER) of Colombia vis-à-vis each of its PAG partners (Chile, Ecuador, Mexico, and Peru). In the empirical model in Backus et al. the TB is uniformly countercyclical and it is negatively correlated with current and future movements in terms of trade, but positively correlated with past movements. The authors call this asymmetric shape of the cross-correlation function for net exports and terms of trade the S-curve because the shape of the curve takes the form of a horizontal S.
Backus et al. (1994) show that the cross-correlation coefficients between the current exchange rate and future (past) values of TB are positive (negative): if a real depreciation improves the TB, then the correlation coefficient must be positive.
 (1)
(1)Then, in order to analyze the S-curve pattern, the estimated cross-correlation coefficients are plotted and describe a curve pattern. In our case, the S-curve pattern is expected if the TB responds positively after a devaluation. The TB is expected to be countercyclical and negatively correlated with current and future movements in the terms of trade, correlated with past movements, however. Then, the curve's plot of the cross-correlation function becomes asymmetric and takes the expected form of a horizontal S, the S-curve pattern. In conclusion, the analysis is based on the simple interpretation of the curve's shape of the cross-correlation function between the variables. In our case, the real bilateral exchange rate and the TB of industrial goods.
4 EMPIRICAL RESULTS
4.1 Data and S-curve analysis
Disaggregated data from DANE (Departamento Administrativo Nacional de Estadísticas) are used in this study to avoid any potential aggregation bias in evaluating the effects of a devaluation on trade flows. The frequency is annual and the sample period goes from 1991 to 2014. The disaggregation is based on the two-digit CIIU (Clasificación Industrial Internacional Unificada) industrial classification. Twenty-seven industrial sectors from a total of 99 were included in the analysis (those for which there are bilateral trade flows between Colombia and the other PAG countries). Total annual exports and imports are both in U.S. dollars, with the latter being the FOB (free on board) series. Table 1 shows the industrial sectors examined by a standard international trade classification (SITC) code. It should be noted that these data do not allow us to capture the effects on trade of any tariff and/or tax reductions resulting from Colombia signing up to the PAG-FTA.
| CIIU code | Industrial sectors | Chile | Ecuador | Mexico | Peru |
|---|---|---|---|---|---|
| 10 | Manufacture of food products | Yes | Yes | No | No |
| 11 | Preparation of beverages | No | No | No | No |
| 12 | Manufacture of tobacco | No | No | No | No |
| 13 | Manufacture of textiles | No | No | No | No |
| 14 | Manufacture of clothing | No | No | No | No |
| 15 | Tanning and retaining of leather; shoemaking; manufacture of suitcases, handbags, and similar articles, and manufacturing of saddler and harness; dressing and dyeing of fur | No | Yes | No | No |
| 16 | Wood processing and manufacture of products of wood and cork, except furniture; manufacture of articles of straw and plaiting | No | Yes | No | No |
| 17 | Manufacture of paper, cardboard, and paper products, and cardboard | No | No | No | Yes |
| 18 | Printing activities and production of copies from original recordings | Yes | Yes | Yes | No |
| 19 | Coking, manufacture of refined petroleum products and fuel blending activity | Yes | No | No | No |
| 20 | Manufacture of chemicals and chemical products | No | No | Yes | No |
| 21 | Manufacture of pharmaceuticals, medicinal chemicals, and botanical products for pharmaceutical use | Yes | No | No | No |
| 22 | Manufacture of rubber and plastic | Yes | No | No | No |
| 23 | Manufacture of other nonmetallic mineral products | Yes | No | No | No |
| 24 | Manufacture of basic metal products | No | No | No | No |
| 25 | Manufacture of fabricated metal products, except machinery and equipment | Yes | No | Yes | No |
| 26 | Manufacture of computer, electronic, and optical products | Yes | Yes | Yes | Yes |
| 27 | Manufacturing equipment and electrical equipment | No | No | Yes | Yes |
| 28 | Manufacture of machinery and equipment | No | No | No | No |
| 29 | Manufacture of motor vehicles, trailers, and semitrailers | No | Yes | Yes | Yes |
| 30 | Manufacture of other transport equipment | No | No | Yes | Yes |
| 31 | Manufacture of furniture, mattresses, and box springs | No | No | No | Yes |
| 32 | Other manufacturing | No | No | No | No |
| 58 | Publishing activities | No | Yes | No | No |
| 59 | Motion picture, video, and television program production, sound recording and music publishing | Yes | Yes | No | Yes |
| 90 | Creative, arts, and entertainment activities | Yes | No | No | No |
| Total of PAG countries where S-curve performed | 10 | 8 | 7 | 7 |
- Source: DANE (www.dane.gov.co).
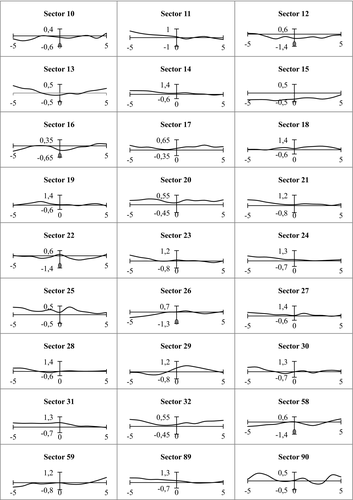
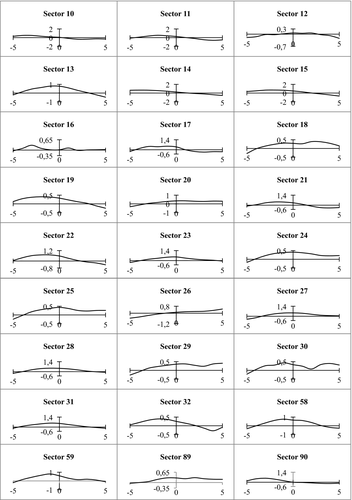
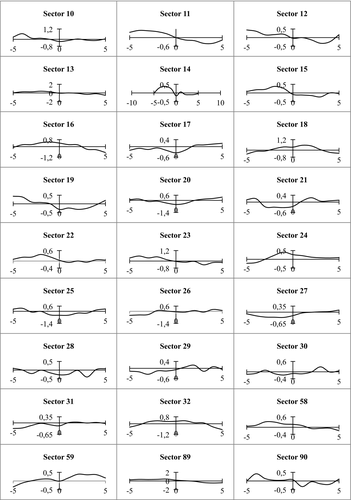
Table 1 summarizes the S-curve results obtained from the cross-correlation functions in (1), with leads and lags of up to 5 years. Figures A1 to A4 in the Appendix show the sectoral results for Colombia vis-à-vis each of its PAG partners. The correlations are reported on the vertical axis, and the number of leads or lags k on the horizontal axis. It appears that there is an S-curve in 31 (29.80 percent) out of 104 industrial sectors in Colombia, that is, in these cases a devaluation of the Colombian peso improves the TB in the short run.
By making a more detailed observation of the TB performance with the PAG trading partners, three of the main industries (manufacture of basic metal products sector; manufacture of computer, electronic and optical products; and manufacture of motor vehicles, trailers, and semitrailers) a devaluation does not have the desired effects on trade flows. Figure 4 shows the TB in real terms by industrial sector. The sectors with the largest deficit are: (i) Manufacture of basic metal products sector (CIIU classification code 24); (ii) Manufacture of computer, electronic and optical products (CIIU classification code 26); and (iii) Manufacture of motor vehicles, trailers and semitrailers (CIIU classification code 29). For example, the manufacture of basic metal products sector has not shown S-curve behavior with any of the countries. In other words, we have not found evidence of a positive effect of devaluation on the industrial sector inside the PAG.

Trade balance by industrial sector
Source. DANE (www.dane.gov.co).
In contrast, the manufacture of computer, electronic and optical products sector showed S-curve behavior in all the countries. While the manufacture of motor vehicles, trailers and semitrailers sector showed an S-curve pattern in Ecuador, Mexico, and Peru, the industrial sector does not implement the S-curve pattern. In conclusion, the remainder of the industrial sectors analyzed show a moderated TB behavior. However, having an expected S-curve in 31 (29.80 percent) out of 104 industrial sectors in Colombia through a devaluation of the Colombian peso to improve the TB in the short run, may not be assumed to be an effective mechanism to improve exports of industrial goods by itself.
5 CONCLUSIONS
This paper investigates whether there is an S-curve in Colombia using bilateral and disaggregated quarterly data for the period 1991 to 2014. More precisely, the short-run effects of a depreciation on the TB are analyzed in 27 industries covered by the PAG free trade agreement. The sharp drop in the price of oil, Colombia's main export, in 2014 led to a significant deterioration of the TB. Competitive devaluations followed in an attempt to restore equilibrium. The S-curve analysis suggests that these did indeed have a positive effect on the TB in the short run in sectors representing 30 percent of total industrial production. Our findings have important policy implications: since only large competitive devaluations restore TB equilibrium, it would appear that a more sensible strategy would be to pursue industrial restructuring, though this cannot be achieved in the short run and is instead a medium- to long-term goal.
ENDNOTE
APPENDIX A

