Phenotypic Analysis and Spatiotemporal RNA-Seq Reveal Key Phenes and Regulatory Network Cascades Under Low Nitrogen Stress in Lettuce
Funding: This work was supported by Central Guidance Fund for Local Science and Technology Development Project, 2023ZYC012; Hunan University of Arts and Science Doctoral Research Initiation Project, 17BSQD15; Innovation Team of Microbial Technology in Hunan University of Arts and Science, 202026; Outstanding Youth Project of Hunan Provincial Education Department under grant, 23B0653; Hunan Provincial Natural Science Foundation Regional Joint Fund, 2024JJ7298; Aid Program for Science and Technology Innovative Research Team in Higher Educational Institutions of Hunan Province.
ABSTRACT
The biological processes underlying nitrogen uptake and utilization represent targets for the genetic improvement of lettuce nitrogen use efficiency (NUE) to increase productivity and counter nitrogen pollution. This study investigated the growth performance and phenotypic traits of 12 lettuce (Lactuca sativa) varieties under low nitrogen (LN) conditions. Spatial and time-resolved RNA-seq of the LN-tolerance lettuce variety was conducted to explore the molecular mechanisms of the LN response. The results revealed that leaf area, root diameter, root-to-shoot ratio, root hair length, and density are key phenes that respond to LN stress. Transcriptome analysis revealed heterogeneous gene expression in roots and shoots under LN conditions. In roots, NRT2.1, NRT2.4, and NRT3.1 were upregulated, whereas NRT2.4 and NRT3.1 were downregulated in shoots. GDU1 and GDU2 were upregulated in shoots, whereas GDU2 was downregulated in roots, indicating nitrogen redistribution. In shoots, key transcription factors included MYB, ERF, GTE9, bHLH, and HSF-A7a, whereas MYB, WRKY17, Trihelix-GT-3a, HSF-A4c, ERF, and MIKC_MADS-2 were important regulators in roots, offering potential targets for improving NUE in lettuce. The time-ordered gene co-expression network revealed tissue-specific regulatory cascades under LN conditions. Specifically, roots continuously regulate metabolic processes and nutrient absorption, while shoots transition from early-stage nutrient uptake to later-stage photosynthesis and cell wall organization, reflecting distinct adaptive strategies. These phenotypic traits and nitrogen-responsive genes provide valuable targets for breeding high-NUE lettuce varieties, offering opportunities to increase nitrogen use efficiency, promote sustainable agriculture, and reduce nitrogen pollution.
1 Introduction
Lettuce (Lactuca sativa L.) is a highly nutritious and economically valuable vegetable that is widely grown in greenhouses because of its easy scalability, automated production, and simple cooking methods that suit a fast-paced modern lifestyle. Lettuce requires a significant amount of nitrogen (N) fertilizer for optimal growth, but less than 50% of the N fertilizer applied is utilized by plants (Kerbiriou et al. 2016; Valenzuela 2024). A high nitrate concentration (200–300 mg NO3-N L−1) in hydroponic wastewater has been reported (Gagnon et al. 2010); recycling it can cause nutrient imbalances and toxic buildup, harming productivity (Aires et al. 2023). The discharge of this wastewater will cause eutrophication of water bodies. Moreover, the production process of N fertilizer releases carbon dioxide, contributing to greenhouse gas emissions and significant energy consumption, exacerbating environmental degradation (Liu et al. 2014; Fan et al. 2022). Governments have begun implementing restrictions on the use of N fertilizers, including Europe (Sanow et al. 2023) and China (http://www.moa.gov.cn/nybgb/2025/202501/202501/t20250114_6469123.htm, accessed January 24, 2025). Reducing N fertilizer application and improving nitrogen use efficiency (NUE) in lettuce cultivation are crucial challenges for sustainable development, as well as for enhancing productivity and efficiency in greenhouse agriculture. Therefore, breeding lettuce varieties with high NUE is essential to meet the needs of modern lettuce production and environmentally friendly agriculture.
The physiological mechanisms influencing NUE include root growth and architecture, nitrogen uptake patterns, leaf longevity and growth, and nitrogen remobilization within the plant (Tegeder and Masclaux-Daubresse 2018; Lynch et al. 2023). Among these factors, root system architecture (RSA), which involves a combination of polygenic traits such as primary root length, total root length, root angle, root number, root thickness, root length density, root growth pattern, and root surface area, plays a critical role in determining nitrogen uptake (York et al. 2015). Intraspecific variation in a wide range of root phenotypes serves as a key target for genetic improvements of lettuce to increase NUE. Ideal RSAs for optimal nitrogen acquisition have already been proposed for crops such as maize and soybean (Lynch et al. 2023). However, there is limited research on how lettuce RSA responds to nitrogen availability and on identifying its ideotype in hydroponic systems.
Many molecular actors involved in nitrogen uptake and its transport to different organs and organelles have been identified in cereal crops and Arabidopsis (Li et al. 2017; Liu et al. 2022). Comparative RNA-seq analysis in lettuce under low nitrogen (LN) conditions revealed the upregulation of nitrogen transport genes, including NRT1.1, NRT2.1, NRT2.4, and NRT2.5, as well as the nitrogen assimilation genes GLN1 and GLN2 (for gene abbreviations, see Table S1). Additionally, several transcription factors (TFs), such as bHLH, bZIP, ERF, MYB, NAC, and WRKY, also presented increased expression. These changes in gene and TF expression highlight their critical roles in nitrogen metabolism and uptake, enabling plants to adapt to LN conditions (Kumar et al. 2022). However, Shanks et al. (2024) highlighted the significance of both temporal and spatial features in nitrogen-sensing and regulatory networks, emphasizing the critical roles of time and space in these biological processes (BP). The sensing and signaling of N status within lettuce, as well as its integration into the transcriptional regulation of downstream components in the N homeostasis network, remain poorly understood. Understanding these processes is crucial for tracing the sequence of gene activation and regulatory cascades, which can provide valuable insights into how these processes are orchestrated over time. Additionally, spatial analysis is essential for exploring tissue-specific variations in nitrogen-related processes, as nitrogen sensing, signaling, uptake, utilization, and translocation may vary between tissues such as shoots and roots. By integrating both approaches, it becomes possible to identify localized gene expression patterns and regulatory networks that underpin NUE, thereby elucidating the roles of TFs and other key regulatory elements at specific stages of nitrogen availability.
In this study, we evaluated key phenotypic traits potentially associated with lettuce NUE, including leaf area, root length, root diameter, and root hair length and density, across 12 commercially cultivated lettuce varieties in China that are widely grown and recommended by major agricultural companies. These traits are critical for understanding how lettuce roots absorb and utilize N under LN conditions and provide valuable insights for breeding high-NUE lettuce varieties. To further explore the molecular basis of the LN response, we performed a spatial and time-resolved RNA-seq experiment on a romaine lettuce variety that exhibited strong tolerance to LN stress using phenotypic analyses. This approach allowed us to elucidate the dynamic regulatory networks of the nitrogen response by capturing the temporal sequence of gene activation and signaling cascades in lettuce shoots and roots. Through this comprehensive analysis, we identified critical genes and pathways involved in nitrogen uptake, transport, and metabolism, revealing how their expression patterns evolve over time in response to LN stress. These findings offer new genetic resources and insights into the development of high-NUE lettuce varieties, providing a foundation for sustainable lettuce production and improved nitrogen management.
2 Materials and Methods
2.1 Phenotypic Variation Experiment
Seeds from 12 lettuce (Lactuca sativa L.) varieties, including 3 romaine lettuce, 3 butterhead lettuce, 3 oak leaf lettuce, 2 batavia lettuce, and 1 loose leaf lettuce (Rijk Zwaan Dutch, Bayer Seminis China, Beijing APEX Agricultural Corporation China, Zhongshuseeds China; Table S2) were germinated in planting sponge soaked in pure water at 20°C. At the third leaf stage, the seedlings were transferred to a tissue culture flask (75 × 75 × 100 mm, Kangpeite Co. Ltd.) containing modified Hoagland solution (152.858 mg L−1 KCl, 456.638 mg L−1 K2HPO3˙3H2O, 246.48 mg L−1 MgSO4˙7H2O, 11.17 mg L−1 EDTA-FeNa, 1.546 mg L−1 H3BO3, 0.338 mg L−1 MnSO4˙H2O, 0.125 mg L−1 CuSO4, 0.576 mg L−1 ZnSO4˙H2O, 0.102 mg L−1 Na2MoO4, pH = 6.5; No. HB8870-9, HaiBo Co. Ltd.). Additionally, the High nitrogen group (HN) contained 5 mM N (1.5 mM KNO3 and 1.75 mM Ca (NO3)2), and the LN group contained 0.5 mM N (0.15 mM KNO3 and 0.175 mM Ca (NO3)2), and K and Ca were balanced with KCl and CaCl2. The lettuce was grown for 5 weeks in a controlled environment with a 22°C/16°C day-night temperature at a 16/8 h light–dark cycle. Postharvest, the shoot and root were dissected, weighed, and scanned with an EPSON 130000xl. The shoot leaf area and total root length and diameter were then analyzed using RhizoVision Explorer (Seethepalli et al. 2021). The shoots' total N was determined using Sulfuric Acid-Hydrogen Peroxide Digestion and Kjeldahl method based on the Agricultural Industry Standard of the People's Republic of China (NY/T 2017-2011). The roots' hair length and density were analyzed using Leica M205C and a Leica DFC450 camera to capture images. The length of 10 randomly selected root hairs per root was measured for 10 random lettuce roots using Image J software. The number of root hairs per millimeter of root was calculated based on images (Nestler et al. 2016; Kuang et al. 2022). Statistical differences were determined using Student's t-test on five biological replicates using GraphPad Prism 18.
2.2 Spatiotemporal RNA-Seq Experiment
Romaine lettuce plants (Beijing APEX Agricultural Corporation) were grown in a hydroponic system containing 8 L of modified Hoagland solution. This variety corresponds to Romaine 2 (Figure 1, Table S2), which demonstrated superior tolerance to LN in the phenotypic experiment. The nutrient mixture consisted of the same modified Hoagland solution described in Section 2.1, with 10 mM N containing 3 mM KNO3 and 3.5 mM Ca(NO3)2 for 3 weeks. Romaine lettuce was subsequently transferred to two nitrogen-level hydroponic culture conditions: HN with 10 mM and LN with 0.1 mM N, and the K and Ca contents were balanced with KCl and CaCl2. After the lettuce plants were transferred to HN or LN conditions, RNA analysis samples were collected from both the HN and LN groups at 30 min, 2, 6, or 24 h. At each time point, the shoots and roots were dissected, immediately frozen in liquid nitrogen, and stored at −80°C for further analysis. The samples of lettuce were sent to Novogene Corporation (Beijing, China). The cDNA library construction method followed the company protocol (Dong et al. 2024). These libraries were sequenced with the Illumina NovoSeq Xplus platform. The raw read sequences were archived at NCBI (PRJNA1171357).
2.3 RNA-Seq Experiment Data Analysis
The raw data (raw reads) in fastq format were first processed using fastp software. In this step, clean data (clean reads) were obtained by removing reads containing adapters, reads containing poly-N sequences and low-quality reads from the raw data. Moreover, Q20, Q30 and GC content of the clean data were calculated. All the downstream analyses were based on the high-quality clean data. Reference genome and gene model annotation files were downloaded from the genome website directly. The index of the reference genome was built using HISAT2 v2.0.5, and paired-end clean reads were aligned to the lettuce genome reference (Lsat_Salinas_v11, GCF_002870075.4) using HISAT2 v2.0.5. The mapped reads of each sample were assembled using StringTie (v1.3.3b) (Pertea et al. 2015). FeatureCounts v1.5.0-p3 was used to count the number of reads mapped to each gene. The fragments per kilobase of transcript sequence per million base pairs (FPKM) of each gene was subsequently calculated on the basis of the length of the gene and the number of reads mapped to the gene. Differential expression analysis of the two conditions was performed using the DESeq2 R package (1.20.0), and genes with a p value ≤ 0.05 from the DESeq2 analysis were considered differentially expressed. Gene Ontology (GO) enrichment analysis of differentially expressed genes (DEGs) was implemented by the clusterProfiler R package, in which gene length bias was corrected. GO terms with corrected P values less than 0.05 were considered significantly enriched with DEGs. We used the clusterProfiler R package to test the statistical enrichment of DEGs in Kyoto Encyclopedia of Genes and Genomes (KEGG) pathways. Each treatment group had three biological replicates for RNA-seq analysis.
2.4 Time-Ordered Gene Co-Expression Network Analysis
Using the methods outlined by Chang et al. (2019) and Zhao et al. (2023), a time-ordered gene co-expression network (TO-GCN) focusing on DEG co-expression relationships and inferring multi-level regulatory interactions was constructed. Positive and negative cutoff values of Pearson's correlation coefficients (PCCs) were calculated under two conditions between all DEGs to construct the gene co-expression network (GCN), including 3354 DEGs in the shoot, and 3658 DEGs in the root. The C1+C20 co-expression network (GCN) was then selected to investigate unique GCN characteristics under LN, as it represents TO-GCN connections that are present under LN conditions but absent in HN conditions, highlighting regulatory interactions specifically induced by nitrogen limitation. In the shoot, ERF (111917268) was chosen as the bait gene, whereas WRKY (111892261) was selected in the root. The hierarchical levels of the TO-GCN were generated using a breadth-first search algorithm. Here, level represents a hierarchical position of genes within the TO-GCN, where genes at lower levels may act as regulators of genes at the same or higher levels, forming a time-sequential regulatory pathway. The TF network was selected and extracted from the whole TO-GCN and visualized using Cytoscape software. Different assigned level gene set Z scores were matched with 4 time points to present the expression abundance at each level and timepoint. For each set of genes corresponding to a level in a TO-GCN, the functional enrichment analysis was conducted with the background set of all expressed genes in this study. Fisher's exact test with a false discovery rate (FDR) < 0.05 was applied with functional annotations from MapMan (https://mapman.gabipd.org).
2.5 Quantitative Real-Time PCR
Upon collection, the tissues were immediately flash-frozen using liquid nitrogen and subsequently kept at −80°C for preservation. Total RNA was isolated from root and shoot tissues separately using the RNAprep Pure Plant Kit (DP441, Tiangen Biotech). First-strand cDNA synthesis was performed with the PrimeScript RT Reagent Kit (Takara Bio) following the manufacturer's instructions. Quantitative real-time PCR (qRT-PCR) analysis was carried out on a LightCycler 480 Instrument System (Roche Diagnostics) using TB Green Premix Ex Taq (Takara Bio). The thermal cycling protocol consisted of an initial denaturation at 95°C for 30 s, followed by 40 cycles of 95°C for 5 s and 60°C for 1 min, with a final cooling step at 50°C for 30 s. Gene expression levels were quantified using the method with LsTIP41 and LsPP2A as internal reference genes (Sgamma et al. 2016). All primer sequences are listed in Table S3. Statistical differences were determined using a t-test on three biological replicates using GraphPad Prism 18.
3 Results
3.1 N Deficiency Hindered Lettuce Leaf Growth and Altered Root Phenotypes
The shoot fresh weights were significantly reduced under LN in 7 out of the 12 groups (Romaine 1, Romaine 3, Butterhead 2, Butterhead 3, Oak Leaf 1, Red Oak Leaf, and Batavia 2), with reductions ranging from −37.32% to −69.66% (Figure 1a). Similarly, leaf area and shoot total N followed the same trend in 6 out of the 12 groups, excluding Batavia 2. The leaf area decreased between −36.89% and −62.13% depending on the lettuce cultivar, whereas shoot total N decreased between −35.09% and −55.79% under LN (Figures 1b,c and S1).
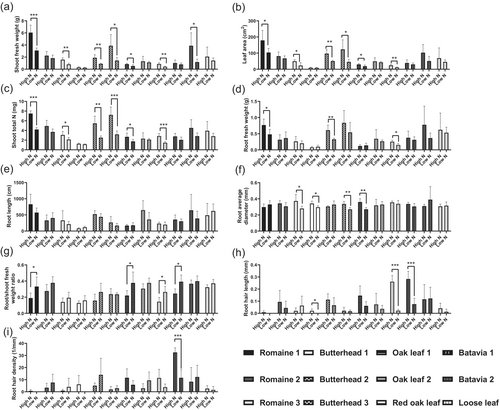
Under LN, the fresh root weights were significantly reduced in 3 out of the 12 groups (Romaine 1, Butterhead 2, and Red Oak Leaf), with reductions ranging from −37.5% to −46.71% (Figure 1d). Although root length did not significantly change, the average root diameter significantly decreased in Romaine 3, Butterhead 1, Butterhead 3, and Oak Leaf 1, with reductions ranging from −13.48% to −25.01% (Figure 1e,f). Conversely, the root-to-shoot fresh weight ratio significantly increased, ranging from +40.48% to +45.75%, in Romaine 1, Oak Leaf 1, Red Oak Leaf, and Batavia 1 (Figures 1g and S1). Under LN, root hair length was significantly reduced in Red Oak Leaf and Batavia 1, with reductions by −91.57% and −73.33%, respectively, whereas the root hair density decreased by −64.59% in Batavia 1 (Figures 1h,i and S1).
3.2 The Impact of LN Stress on Transcription Was a Time-Dependent Process Involving Dynamic Transduction From Roots to Shoots
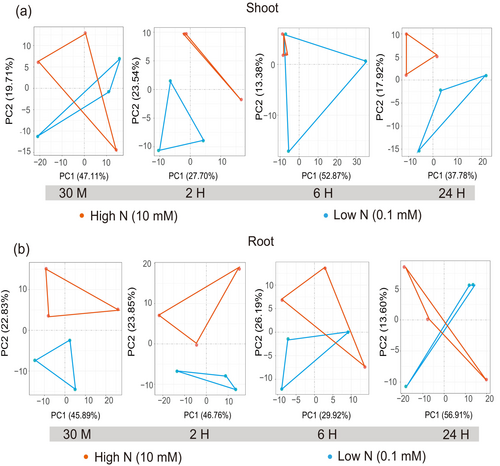
Principal component analysis (PCA) of the RNA-seq data revealed a significant difference in the expression patterns between shoots and roots across the board (Figure S2). Concurrently, LN stress had a time-dependent effect on both the shoots and the roots (Figure 2). At the 30 min and 6 h timepoints, the shoot samples subjected to LN stress were indistinguishable from those under HN when viewed on a 2D scale. However, at the 2 and 24 h intervals, the different expression patterns between shoot samples under the two nitrogen conditions were discernible (Figure 2a). In contrast, root samples under LN were distinguishable from those under HN at the early stages of 30 min and 2 h. Yet, at the 6 and 24 h points, these root samples were indistinguishable (Figure 2b).
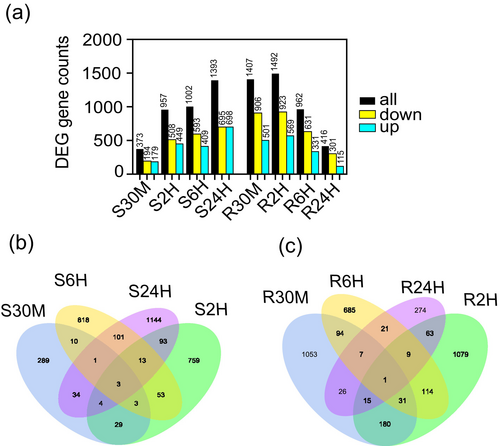
DEGs were pinpointed during the comparison under HN or LN conditions (Figure 3a). Consistent with the PCA results, the shoot DEGs were notably abundant in the later stages of the experiment, particularly at 24 h, where 1393 DEGs were identified. In contrast, the number of DEGs was reduced to 373 DEGs at the 30 min point. In the case of the roots, DEGs were abundant during the initial periods, with 1407 DEGs observed at 30 min and 1492 DEGs at 2 h. However, this number decreased to 962 DEGs at 6 h and further decreased to 416 DEGs at 24 h. In addition to heterogeneous DEGs, three shared DEGs within the shoots were observed in the four selected comparisons, including ETHYLENE-RESPONSIVE TRANSCRIPTION FACTOR 5, pleiotropic drug resistance protein, and epidermis-specific secreted glycoprotein EP (Figure 3b). Moreover, a single DEG, NICOTIANAMINE AMINOTRANSFERASE 1, was shared by the four comparisons in the roots (Figure 3c). In addition, qPCR validation was conducted to confirm the RNA-seq results, and the expression patterns observed were consistent between the two methods (Figure S3).
3.3 Spatiotemporal Gene Expression and Pathway Changes in Shoots and Roots Under LN Stress
For the analysis of DEGs, GO enrichment analyses were conducted. Predominant BP, cellular components (CC), molecular functions (MF) and pathways (padj < 0.05) were identified. The main overrepresented GO terms were predominantly distributed in BP in the shoot (Figure 4a), whereas they were mainly found in MF and BP in the root (Figure S4).
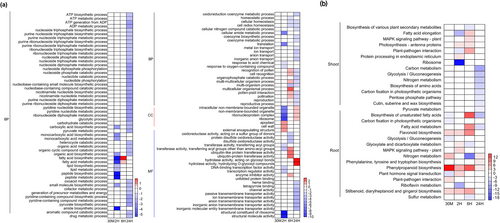
Temporal regulation of GO terms in shoots revealed dynamic shifts in metabolism, homeostasis, and cellular functions (Figure 4a). At 30 min, no GO enrichment was observed among the DEGs. By 2 h, 81.85% of the enriched GO terms were mainly associated with downregulated DEGs, including ribosome-related functions, translation, biosynthesis of peptides, fatty acids, and lipids, metabolic activities involving carboxylic acids and small molecules, and responses to environmental stimuli. Six processes were associated with upregulated DEGs, including cellular structures and functions (i.e., cell wall and apoplast) and MFs (i.e., channel activity and protein binding). At 6 h, 6 GO terms associated with homeostasis were enriched in downregulated DEGs. Conversely, 15 GO terms related to cell recognition, pollination, reproduction, fatty acid metabolism, and multiorganism processes were enriched in upregulated DEGs. At 24 h, 71 GO terms related to ATP biosynthesis and metabolism, nucleotide metabolism, cofactor metabolism, organic acid metabolism, and carbohydrate metabolism, cellular homeostasis, redox processes, and reproductive activities were associated with downregulated DEGs. Additionally, MFs such as heme and tetrapyrrole binding, ion and anion transport, and channel activity were downregulated. Conversely, hydrolase activities involving glycosyl bonds and O-glycosyl compounds as well as those occurring in intracellular nonmembrane-bound organelles, ribonucleoprotein complexes, and ribosomes were upregulated.
In the root GO analysis (Figure S4), the observed changes in metabolic pathways and enzyme activities over time reflected the cells' dynamic adaptation to environmental changes. Early responses were characterized by enhanced oxidative stress responses and cell wall remodeling, whereas later responses involved increased antioxidant and glycosyltransferase activities, as well as changes in transport functions at different time points. At 30 min, the downregulated genes were associated with the catabolism and metabolism of amino sugars, aminoglycans, cell wall macromolecules, and carbohydrates, including chitin, as well as with oxidoreductase activities. The upregulated processes included the oxidative stress response, cell wall organization, and antioxidant activity, with increased heme binding and channel activity. At 2 h, genes involved in amino sugar, aminoglycan, and chitin metabolism, as well as vitamin and drug metabolism and small molecule biosynthesis, cell wall organization, and reproductive processes were downregulated. In contrast, ion binding (calcium, potassium, and iron), ion channel activities, receptor activities, antioxidant and oxidoreductase activities, heme binding, and transcription regulation were upregulated. At 6 h, downregulated processes included inorganic anion and sulfate transport, carbohydrate metabolism, and oxidoreductase activity acting on the CHOH group. However, the activities of carboxypeptidase, DNA binding, and various oxidoreductases that act on paired donors, peroxide, and single donors were upregulated. By 48 h, oxidoreductase activity with oxygen reduction was downregulated, whereas antioxidant, peroxidase, and glycosyltransferase activities and binding functions were upregulated.
KEGG analysis of the shoot samples revealed dynamic regulatory changes, with notable downregulation of key pathways such as ribosome, carbon metabolism, glycolysis/gluconeogenesis, and nitrogen metabolism, and upregulation of defense-related pathways, including plant-pathogen interaction and MAPK signaling, over time (Figure 4b). Specifically, at 30 min, no significant changes were observed in the KEGG pathways. At 2 h, pathways related to the ribosome, fatty acid elongation, and plant-pathogen interaction were associated with downregulated DEGs, whereas pathways involving photosynthesis antenna proteins and protein processing in the endoplasmic reticulum were enriched in upregulated DEGs. At 6 h, the biosynthesis of the plant secondary metabolites pathway was associated with downregulated DEGs, whereas upregulated DEGs were enriched in pathways related to plant-pathogen interaction and fatty acid elongation, MAPK signaling, and photosynthesis antenna proteins. At 24 h, several metabolic pathways, including carbon metabolism, glycolysis/gluconeogenesis, nitrogen metabolism, and amino acid biosynthesis, were associated with downregulated DEGs.
The root KEGG analysis results are shown in Figure 4b. At 30 min, DEGs enriched in pathways such as phenylpropanoid biosynthesis, nitrogen metabolism, stilbenoid/diarylheptanoid/gingerol biosynthesis, flavonoid biosynthesis, and plant–pathogen interactions were upregulated. In contrast, DEGs enriched in pathways related to plant hormone signal transduction, carbon fixation in photosynthetic organisms, glycolysis/gluconeogenesis, and the biosynthesis of unsaturated fatty acids were downregulated. At 2 h, continued upregulation was observed in phenylpropanoid biosynthesis, stilbenoid/diarylheptanoid/gingerol biosynthesis, and flavonoid biosynthesis. In addition, plant hormone signal transduction, MAPK signaling pathway, and glyoxylate/dicarboxylate metabolism were also upregulated. In contrast, riboflavin metabolism was downregulated. At 6 h, DEGs enriched in pathways such as biosynthesis of unsaturated fatty acids, phenylpropanoid biosynthesis, flavonoid biosynthesis, fatty acid metabolism, and stilbenoid/diarylheptanoid/gingerol biosynthesis were upregulated. In contrast, DEGs enriched in pathways related to sulfur metabolism, nitrogen metabolism, and glyoxylate and dicarboxylate metabolism were downregulated. By 24 h, DEGs enriched in pathways related to nitrogen metabolism, phenylpropanoid biosynthesis, phenylalanine, tyrosine, and tryptophan biosynthesis were upregulated, whereas DEGs enriched in pathways associated with fatty acid metabolism were downregulated.
3.4 Spatiotemporal Regulation of Nitrogen-Related Gene Expression Under LN Stress
The expression of nitrogen-related genes in the shoot samples significantly changed over time (Figure 5a). Specifically, NRT2.4 and NRT3.1 were predominantly downregulated at 2 h, indicating reduced nitrate uptake. NRT2.5 was downregulated at 30 min and 24 h but upregulated at 6 h. AMT1.2 was upregulated at 6 h but downregulated at 2 and 24 h, suggesting dynamic ammonium uptake regulation. In terms of nitrogen assimilation-related genes, NR and NiR were downregulated at 6 and 24 h, whereas NRG2 was downregulated at 6 h. In contrast, GDU1 and GDU2 were upregulated as early as 2 h. These expression patterns reflect dynamic adjustments in nitrogen metabolism and associated processes.
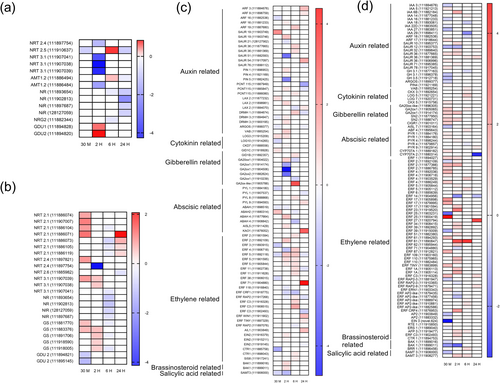
In the root samples (Figure 5b), nitrogen-related genes also exhibited dynamic temporal regulation. NRT2.1 was upregulated at 30 min and 24 h, whereas NRT2.4 and NRT2.6 were downregulated at 2 and 24 h, respectively. NRT3.1 was upregulated at 30 min and 2 h, followed by a decrease at 6 h. Both NR and NiR were downregulated at 6 h. GS genes were upregulated at 30 min and 2 h, with isoforms downregulated at 6 h. GDU2 was downregulated at 30 min. These results indicated the dynamic regulation of nitrogen uptake and metabolism in roots over time.
3.5 Spatiotemporal Regulation of Plant Hormone-Related Gene Expression Under LN Stress
Under LN, the expression of hormone-related genes in shoots presented distinct patterns over time (Figure 5c). Auxin-related genes, such as ARF19, were upregulated at 6 h, whereas SAUR19 and LAX2 were upregulated at 30 min and 2 h. The cytokinin-related gene LOG3 was upregulated at 30 min and 2 h. The gibberellin-related gene GA20ox 1 (111914022) was upregulated at 2 h, whereas GA20ox (111914174, 111904506, 111882624) was downregulated at 2 h, and GA20ox1 (111914022, 111910239) was downregulated at 6 h. Regarding abscisic acid-related genes, PYL1 was downregulated at 30 min and 24 h. ABAH genes exhibited divergent expression patterns at both 30 min and 2 h, but ABAH2 and ABAH4 were all downregulated at 6 h. KAO1 was upregulated at 24 h. For ethylene-related genes, ERF3 and ERF5 were downregulated at 30 min, whereas ERF5 was upregulated at 2 and 6 h before being downregulated again at 24 h. ERF CRF1 was downregulated at both 2 and 6 h. Regarding brassinosteroid-related genes, BAK1 was upregulated at 2 h. Finally, the salicylic acid-related gene SAMT3 was downregulated at 30 min and 2 h.
The expression of hormone-related genes in roots also exhibited distinct patterns over time (Figure 5d). IAA3, IAA16, IAA18, IAA22D, IAA27, and IAA29 were downregulated at specific time points, whereas IAA5, IAA14, and IAA6B were upregulated at specific time points. Many SAUR genes were upregulated, with SAUR36 being notably upregulated at all four time points. GH3.1 and GH3.5 were downregulated at 30 min and 6 h. Interestingly, genes related to cytokinin and gibberellin were all upregulated, especially GA2ox1 at 30 min, 2, and 6 h. Most abscisic acid-related genes were also upregulated, except for PYR4 at 6 h and CYP707A at 24 h. Under LN, ERF2, ERF25, ERF39, ERF-AP2-like exhibited either upregulation or downregulation at different time points. ERF1, ERF4, ERF5, ERF17, ERF23, ERF27, ERF34, ERF51, ERF61, ERF62, ERF87, ERF110, TINY, ERF1A, ERFC3, ERN1, CTR1, and CRF4 were upregulated at one or more time points, indicating positive regulation. Conversely, genes such as ERF14, ERF71, and ERF RAP2-3 were downregulated at specific time points, indicating negative regulation. Additionally, AP2 (111903849, 111883332), EIN3 (novel 624) and ERS1 (111889040) were downregulated at 30 min, whereas RTE1 (111915850) was slightly upregulated. AFP3 (111919477) was upregulated at 2 and 6 h. Regarding brassinosteroid and salicylic acid-related genes under LN, BAK1 was downregulated at 30 min and 2 h. BRR1 (111896456) was slightly upregulated at 6 h. SAMT3 (111906000) was downregulated at 30 min, whereas SAMT 3 (111908277) was upregulated at 2 and 6 h.
3.6 Spatiotemporal LN-Dependent TO-GCN Analysis
In the LN-dependent TO-GCN analysis, the TFs in shoot tissues were categorized into 12 levels (Figure 6a), whereas the TFs in root samples were categorized into 11 levels (Figure 6b). These assigned levels correspond to the expression time order of the genes, as indicated by the red squares (high expression levels) along the diagonal in each of the heatmaps of the mean normalized RPKMs (z scores) for shoots and roots. Overlapping high-expression periods between consecutive levels suggest that genes at one level might regulate genes at the next level. Furthermore, most genes at the same level were regulated earlier in the roots than in the shoots, indicating a faster response in the roots under LN (Figure 6c).
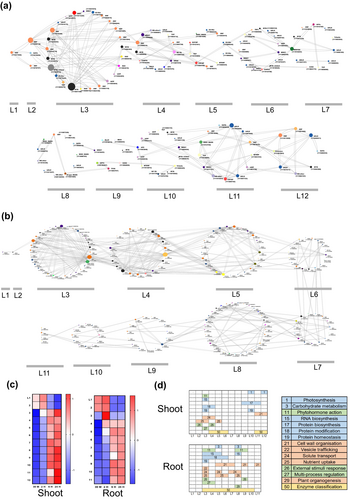
In the roots (Figure 6b), the TFs with the highest top 10 connectivities were identified, with degrees ranging from 18 to 38, and located at levels 3–5. These included HSF-A4c (111886829), ERF family members (ERF2-111877366, ERF2-111901594, ERF061-111894293, ERF039-111892892), MIKC_MADS-2 (111877038), MYB family members (MYB14-111918331, MYB48-111896559), WRKY17 (111888637), and Trihelix-GT-3a (111920251). Additionally, the five most abundant TFs in the TO-GCN network were ERF5 (111905844), bHLH-ILR3 (111896122), MYB family members (MYB1R1-111879918, MYB48-111896559), and bZIP53 (111882193). MapMan Mercator4 BIN enrichment analysis revealed that core metabolic and cellular functions, including processes such as carbohydrate metabolism, RNA biosynthesis, and protein modification and homeostasis, were distributed across levels 3–8, as indicated by the blue block. Notably, protein classification continuously changed from level 3 to level 10, indicating dynamic alterations in the types and categories of proteins over time, shown as gold blocks. In contrast, the regulatory and response mechanisms shown as green blocks, which include phytohormone action, external stimulus response, and multiprocess regulation, are concentrated in more specific regions, appearing between levels 3–4 and 8–9. Finally, the structural, developmental, and transport processes, which cover cell wall organization, vesicle trafficking, solute transport, nutrient uptake, and plant organogenesis, are distributed across a broader range, spanning levels 3–11.
In the shoots (Figure 6a), the top 10 TFs with the highest connectivity were identified, with degrees ranging from 8 to 24. These included MYB family members (MYB59-111881150, MYB-111919072), GTE9 (111921919), ERF family members (ERF4-111906718, ERF-C3-111916328, ERF-WIN1-111911902, ERF-C3-111908515), bHLH family members (bHLH-ILR3-111903688, BHLH42-111892911), and HSF-A7a (111901068). Furthermore, the five most abundant TFs in the TO-GCN network included ERF family members (ERF-RAP2-3-111917268, ERF5-111905844, ERF-RAP2-7-111897076), G2-like (GLK1-111886262), and BES1 (111908244). Based on MapMan Mercator4 BIN enrichment analysis (Figure 6d), the core metabolic and cellular functions, encompassing RNA biosynthesis, protein modification, and homeostasis, were distributed at levels 2–5 and levels 9–12, which were presented as blue blocks. Protein classification showed changes primarily at levels 4–6 and 11–12. This finding suggests that the diversity and types of proteins are distinct or evolve significantly during these specific stages or conditions. These proteins were shown as gold blocks. Regulatory and response mechanisms, which included phytohormone action, external stimulus response, and multiprocess regulation, also appeared in the early stage at levels 2–4. At later stages, photosynthesis, protein biosynthesis, and homeostasis were regulated, and cell wall organization was regulated at levels 9–12.
4 Discussion
4.1 Key Lettuce Phenotypic Traits and Growth-Related Transcriptional Regulation Under LN Stress
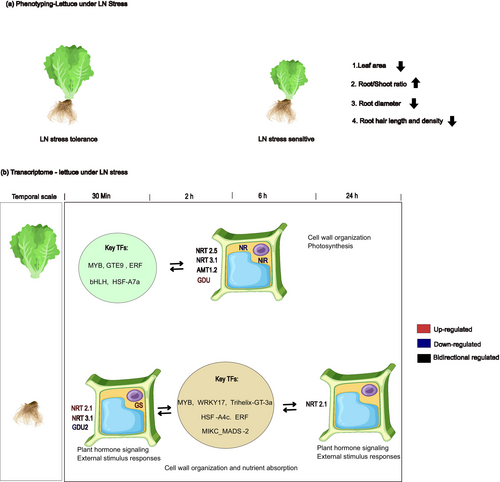
NUE is a complex trait influenced by multiple phenotypic factors. Interestingly, the LN stress-tolerant varieties did not exhibit significant differences in phenotypes. This is evident in Figure 1c, where the varieties' shoot total N content shows no significant differences under HN and LN, consistent with the overall similarity in phenotypes. In contrast, the LN stress-sensitive varieties exhibited significant changes in shoot total N content, accompanied by more pronounced phenotypic differences, such as leaf area, root diameter, root hair length and density, root-to-shoot ratio. Prior computational models have demonstrated that these phenotypic differences are closely related to NUE (Lynch et al. 2023). Half of the lettuce varieties presented a significant reduction in leaf area under LN conditions. It is well known that a decrease in leaf area diminishes photosynthetic capacity. Efficient utilization of carbon and nitrogen resources while maintaining leaf area may be key shoot phenotypic traits associated with NUE (Kumar et al. 2022). With respect to the root system, the N uptake efficiency (NUpE) is determined by the contact area between the roots and the substrate as well as the efficiency of nitrogen transport. In this study, 33.33% of the lettuce varieties presented a relatively high root-to-shoot fresh weight ratio under LN. A larger root system suggests increased contact with the substrate solution. According to Liebig's law of the minimum, when nitrogen becomes the limiting factor, plants allocate more carbon to their roots, resulting in relatively larger root systems. This adaptation strategy reflects the response of lettuce to LN. Second, 33.33% of the varieties presented a reduction in root diameter under LN, which may reflect an economic strategy to increase the root surface area. Notably, total root length remained unaffected, despite 25% of the varieties experiencing a decrease in root fresh weight. It has been reported that longer and denser root hairs are associated with high NUE in maize (Saengwilai et al. 2021). Brachypodium distachyon, tomato, spinach, and rape presented longer root hair lengths in LN conditions (Foehse and Jungk 1983; Kuang et al. 2022). However, 25% of the varieties presented shorter root hair lengths, and 8.33% of the varieties presented lower root hair density under LN in this study. This inconsistency may be attributed to differences in plant species and the duration of cultivation. In summary, these results suggest that key traits of lettuce root architecture, specifically root diameter and root hair length and density, are crucial for adaptation to LN stress in hydroponic systems, particularly in LN stress-sensitive varieties. Further evidence may be obtained using in silico root modeling methods to better understand how these traits contribute to nitrogen uptake and utilization under LN conditions (Figure 7).
Although we selected an LN stress-tolerant variety for RNA-seq analysis, this variety did not exhibit distinct phenotypic differences under LN conditions. However, DEGs related to plant growth regulation were detected. We suggest that these changes reflect early adaptive regulatory mechanisms in response to LN stress. Shoot hormone-related gene expression under LN stress was driven primarily by auxin, ethylene, and gibberellin, which presented transient and fluctuating patterns, whereas root gene expression was associated predominantly with ethylene, auxin, and abscisic acid, which presented more consistent and sustained regulation over time. In shoots, the upregulated hormone-related genes included auxin-related ARF19, SAUR19, and LAX2, cytokinin-related LOG3, gibberellin-promoting GA20ox variants (111905788), abscisic acid-associated KAO1, ethylene-related ERF5, and brassinosteroid-related BAK1. In contrast, genes involved in hormone inhibition included gibberellin-related PYL1 and ABAH (11898519, 111908042), ethylene-related ERF3 and ERF CRF1, and salicylic acid-related SAMT3. In the roots, the upregulated hormone-related genes included auxin-related SAUR36, IAA5, and IAA14, cytokinin- and gibberellin-promoting GA2ox1, abscisic acid-associated PYR4, ethylene-related ERF family genes, and brassinosteroid-related BRR1. In contrast, the downregulated genes included auxin-related IAA16 and GH3.5, brassinosteroid-associated BAK1, multiple ethylene-related genes, and salicylic acid-related SAMT3.
Previous studies have highlighted key TFs involved in leaf development and photosynthetic efficiency, such as OsMADS25, NtERF3, AtERF4, AtERF8, and GLK1/GLK2 (Table 1). In our study, several ERF family TFs (ERF1, ERF4, ERF5, ERF17, ERF23, ERF39, and ERF62) and MYB TFs presented significant expression changes in shoots, indicating their roles in hormone signaling and the nitrogen response. We also identified GTE9 (111921919), which is associated with cell wall modification and stress response, and BES1 (111908244), which is a known regulator of the brassinosteroid signaling pathway and nitrogen metabolism (Kavi Kishor et al. 2023). Additionally, GLK1 (111886262) is involved in chloroplast biogenesis and nitrogen deficiency responses (Ueda et al. 2020). In roots, TCP20 (111888898) is associated with root/shoot ratio regulation and interacts with OFP (111912165), potentially influencing carbon partitioning and lateral root development. Other TCP family TFs, including TCP4, TCP17, TCP5, and TCP15, may also regulate nitrogen allocation between shoots and roots (Guan et al. 2017). Furthermore, MIKC_MADS-2 (111877038), ERF2 (111877366, 111901594), ERF061 (111894293), ERF039 (111892892), ERF5 (111905844), and Trihelix-GT-3a (111920251) are likely involved in root elongation, lateral root formation, and nitrogen uptake.
| Target NUE-related traits | TFs | TFs family | Tagert plant | Positive effect | Negative effect | References |
|---|---|---|---|---|---|---|
| Root system architechture | ANR1 | MADS | Arabidopsis | Nitrate-induced lateral root formation | Zhang and Forde (1998) | |
| OsMADS25 | MADS | Rice | Regulate lateral and primary root growth | Yu et al. (2015) | ||
| OsMADS27 | MADS | Rice | Enhance lateral root (LR) formation | Inhibit the elongation of primary root | Chen et al. (2018) | |
| OsMADS57 | MADS | Rice | Regulate seminal root elongation | Huang et al. (2019) | ||
| SiMYB3 | MYB | Setaria italica | Regulate auxin-related root development | Ge et al. (2019) | ||
| SiMYB42 | MYB | Setaria italica | Regulate root development | Ding et al. (2018) | ||
| CRL5 | ERF | Rice | Regulate auxin-induced crown root formation | Represse cytokinin signaling | Kitomi et al. (2011) | |
| DREB2A | ERF | Apple seedlings | Bind to MdNIR1 and MdSWEET12 promoters, enhancing root development | Zhang, Lin, et al. (2024) | ||
| GTL1 and DF1 | Trihelix | Arabidopsis | Prevent root hair formation | Shibata et al. (2022) | ||
| Shoot development | OsMADS25 | MADS | Rice | Promote shoot growth | Yu et al. (2015) | |
| ERF | ERF | Multiple | Act as a key regulatory hub in plant responses to abiotic stresses, promote leaf growth | Müller and Munné-Bosch (2015) | ||
| NtERF3, AtERF4, AtERF8 | ERF | Nicotiana tabacum | ESP/ESR regulated leaf senescence | Koyama et al. (2013) | ||
| GLK1 and GLK2 | G2-like | Arabidopsis | ORE1 inhibits GLK, leading to chloroplast breakdown | Rauf et al. (2013) | ||
| Nitrogen uptake activity | SiMYB42 | MYB | Setaria italica | NRT2.1, NRT2.4, NRT2.5 upregulation | Ding et al. (2018) | |
| NFYA3, NFYA5, NFYA8, and NFYA2 | NF-YA | miR169 mediated decreased expression of AtNRT1.1 and AtNRT2.1 | Zhao et al. (2011) | |||
| CsbZIP55 and CsbZIP65 | bZIP | Cucumber | Associate with CsNPF downregulation | Hua et al. (2023) | ||
| Nitrogen assimilation | PtMYB1 and PtMYB4 | MYB | Pinus sylvestris | Activate PsGS1b expression | Gómez-Maldonado et al. (2004) | |
| WRKY1 | WRKY | Arabidopsis | Promote leaf senescence and activate the N-assimilation and transport genes to trigger N remobilization | Heerah et al. (2019), Zhang, Tang, et al. (2024) | ||
| DREB2A | ERF | Apple seedlings | Bind to MdNIR1 and MdSWEET12 promoters, enhance nitrogen assimilation | Zhang, Lin, et al. (2024) | ||
| TCP20 | TCP | Arabidopsis | TCP20 and NLP6/7 bind to the nitrate reductase gene NIA1, leading to increased expression of nitrate assimilation genes | Guan et al. (2017) | ||
| OsbZIP79 | bZIP | Rice | Regulate the rice response to N insufficiency | Jiang et al. (2023) | ||
| Nitrogen remobilization | OsMADS57 | MADS | Rice | Regulate nitrate translocation from root to shoot via OsNRT2.3a | Huang et al. (2019) | |
| ERF | ERF | Arabidopsis | Upregulate root NRT1.8 | Downregulate shoot NRT1.5 | Zhang et al. (2014) | |
| WRKY1 | WRKY | Arabidopsis | Promote leaf senescence and activate the N-assimilation and transport genes to trigger N remobilization | Heerah et al. (2019), Zhang, Tang, et al. (2024) | ||
| WRKY47 | WRKY | Brassica napus | Activate leaf senescence and nitrogen remobilization by promoting the expression of BnaC7.SGR1, BnaA2.NRT1.7, and BnaA9.AAP1 | Cui et al. (2023) | ||
| Homeostasis | HSF | HSF | Maintain cellular homeostasis, limit protein denaturation, decrease ROS accumulation, and stabilize redox balance | Andrási et al. (2021) | ||
| NRI1 | bHLH | Chlamydomonas reinhardtii | Keep nitrogen homeostasis | N starvation-specific responses | Jia et al. (2022) |
4.2 Gene Targets for Improving Nitrogen Uptake and Utilization in Lettuce Breeding
NUE was determined based on NUpE and N-use efficiency (NutE). NupE is influenced by a low-affinity transport system (LATS) and two high-affinity transport systems (iHATS and cHATS). HATS functions when nitrate concentrations are between 10 and 250 μM, whereas LATS is active when nitrate concentrations exceed 250 μM. Notably, iHATS demonstrated a 25-fold greater Vmax for transport compared with cHATS. Therefore, exploring the transport potential of iHATS-related genes could help improve NUE in lettuce (Xu et al. 2024). In this study, NRT2.1, which is part of iHATS, and its associated transporter genes (NRT3.1 and NRT2.4) were highly regulated under LN in the roots. Consistent with these findings, Kumar et al. (2022) reported that, compared with the Salinas genotype, the UC genotype presented greater expression of high-affinity nitrate transporter genes (NRT2.1, NRT2.4, and NRT2.5) under low nitrogen conditions, potentially contributing to its greater nitrogen uptake efficiency and higher nitrogen content (Kumar et al. 2022). AtNRT2.1 reportedly controls 72% of iHATS activity (Li et al. 2007). These findings indicate their critical function in enhancing nitrogen uptake and efficiency under nutrient-limited conditions and highlight their potential as genetic targets for improving NUE in lettuce. NRT2.1 functionality is regulated by phosphorylation sites, particularly Ser28 and Ser501, which influence its stability and activity under low- and high-nitrogen conditions, respectively. The C-terminal region of NRT2.1 is also critical for its function. Additionally, the OsLBD37/38/39 TFs have been shown to inhibit OsNRT2 transporter expression under high-nitrogen conditions, affecting nitrogen utilization. To increase NUE, future strategies could focus on engineering NRT2.1 to optimize its phosphorylation state and C-terminal function while also mitigating the inhibitory effects of OsLBD37/38/39. These approaches, combined with the selection of improved genotypes, can significantly improve NUE in crops and support sustainable agricultural practices (Zhu et al. 2022; Xu et al. 2024).
NutE is influenced by enzymes such as nitrate reductase (NR), nitrite reductase (NiR), glutamine synthetase (GS), and glutamate synthase (GOGAT). In this study, we observed a decrease in NR and NiR expression in both roots and shoots under LN, which was likely attributed to a decrease in the total uptake of nitrate. Conversely, GS (111881770, 111883376) and GS1 (111891706, 111918005) expression exhibited transient upregulation at 30 min and 2 h followed by downregulation at 6 h, suggesting a complex regulatory mechanism potentially influenced by both LN stress and the depletion of carbon sources. These enzymatic expression patterns are critical, as they modulate the total nitrogen absorbed and consequently dictate the synthesis of biomass. GDU1 and GDU2 upregulation in leaves and GDU2 downregulation in roots may increase N redistribution from shoots to roots and enable plants to retain and utilize limited nitrogen resources while prioritizing root growth and absorption. This differential expression of GDU genes in different organs contributes to the physiological adaptation of plants to LN, optimizing their NUE and growth strategy (Figure 7).
Previous studies revealed that TFs play crucial roles in NUE by regulating N uptake, assimilation, remobilization, and homeostasis. Regarding N uptake, MYBs (SiMYB42 and PtMYB1) regulate nitrogen transporters such as NRT2.1, NRT2.4, and NRT2.5 (Ding et al. 2018) and NF-YAs (NFYA2, NFYA3, NFYA5, and NFYA8) mediate AtNRT1.1 and AtNRT2.1 (Zhao et al. 2011). During N assimilation, PtMYB1 and PtMYB4 regulate PsGS1b (Hua et al. 2023). In N assimilation, PtMYB1 and PtMYB4 regulate PsGS1b (Gómez-Maldonado et al. 2004). ERF-DREB2A binds to the promoters of MdNIR1 and MdSWEET12 to increase N assimilation (Zhang, Lin, et al. 2024). Additionally, WRKY1, NRI1, TCP20, and OsbZIP79 are associated with N assimilation. OsMADS57, ERF, WRKY1, WRKY47, HSF, and NRI1 are involved in regulating both N remobilization and homeostasis (Table 1). Compared with previous studies, we found that several TFs identified in our research, such as MYB, ERF, and WRKY family members, are involved in nitrogen uptake and assimilation, and remobilization, involving MYB14 and MYB48, has been shown to regulate the nitrogen transporters NRT2.1, NRT2.4, and NRT2.5 (Ding et al. 2018) and ERF-DREB2. These factors increase nitrogen assimilation by binding to promoters such as MdNIR1 and MdSWEET12 (Kumar et al. 2022; Zhang, Lin, et al. 2024). These findings validate the relevance of these TFs in NUE. Furthermore, our study revealed several new TFs, such as HSF-A4c, Trihelix-GT-3a, and bZIP53, which have not been extensively linked to nitrogen utilization in previous studies. These TFs could provide potential targets for further investigation into their specific roles in NUE.
4.3 TO-GCN Analysis Reveals Tissue-Specific Heterogeneous Regulatory Cascades in Lettuce That Adapt to LN Conditions
Using time series analysis, we identified significant heterogeneity in the response to LN conditions between roots and shoots. In the roots, core processes such as protein modification and homeostasis significantly changed in the early stages, highlighting the root's immediate adaptive mechanisms to LN stress. Additionally, key functions such as carbohydrate metabolism and RNA synthesis were notably affected in both the early and late stages, suggesting that the roots continuously adjust to environmental changes under LN conditions through these processes. Throughout the entire period, protein types and quantities in the roots dynamically changed, suggesting that the roots are continuously optimizing their metabolic activity to increase nitrogen uptake and utilization. In terms of regulatory mechanisms, plant hormone signaling and external stimulus responses are primarily observed in the early and late stages, implying that the roots first initiate a rapid response and later regulate longer-term growth and adaptation processes to adapt to LN conditions. Additionally, structural changes in the roots, such as changes in cell wall organization and nutrient absorption, occurred throughout the entire period, indicating that the roots underwent continuous adaptive changes.
In contrast, the regulation in the shoots exhibited different characteristics. The TO-GCN loop of the TFs is significantly divided into two loops, L1-7 and L8-12. Although L7 and L8 are not connected by TFs, they are linked by functional genes. Early-stage responses primarily include RNA biosynthesis, solute transport, nutrient uptake, phytohormone action, external stimulus response, and multiprocess regulation, which are crucial for the initial adaptation of plants to environmental stress. In the later stages, cell wall organization and photosynthesis are significantly regulated, helping the plant maintain cellular integrity and optimize energy production under prolonged LN stress. Notably, protein regulation was involved in both the early and late stages, reflecting its ongoing role in the plant response to stress across different time points (Figure 6). Similarly, Kumar et al. (2022) reported that nitrogen stress affects genes involved in key physiological processes, including photosynthesis and cell wall formation, further highlighting the dynamic adjustments in shoot metabolism under LN conditions. In summary, the greatest heterogeneity between the roots and shoots in response to LN conditions lies in the continuous regulation of metabolic processes and nutrient absorption by the roots. In contrast, the shoots shift from early-stage nutrient uptake to later-stage photosynthesis and cell wall organization (Figure 7).
Author Contributions
Weiqi Kuang designed the research. Anan Tang, Limin Zhang, Siyu E, Jian Gao, Jing Yang, and Jingkai Zhou performed the experiments. Weiqi Kuang analyzed the data and wrote the manuscript. Yun Wang funded the research. All authors read and approved the manuscript.
Conflicts of Interest
The authors declare no conflicts of interest.
Open Research
Data Availability Statement
The data that support the findings of this study are openly available in the Sequence Read Archive of the NCBI at https://www.ncbi.nlm.nih.gov/sra, with the Bioproject reference number PRJNA669627. The other data are available from the corresponding author upon request.


