Optimizing algal hydrogen photoproduction: a simplified and efficient protocol for anoxic induction in a semi-autotrophic approach
Abstract
Green microalgae, such as Chlamydomonas reinhardtii, show great potential for producing green hydrogen using only water and sunlight, with no carbon emissions. However, sustainable hydrogen production requires addressing the hydrogenase sensitivity to oxygen and enhancing electron allocation to this enzyme. Previous methods for hydrogen photoproduction rely on a brief nitrogen flushing followed by a dark incubation phase to establish anoxia prior to exposure to high light.
In this study, we present a straightforward protocol involving a mixotrophic growth phase followed by a semi-autotrophic hydrogen production phase. During the hydrogen production phase, extended nitrogen flushing induced anoxia in the liquid algae culture, even though oxygen was still present in the headspace. Anoxia was maintained under light at moderate intensity (120 μmol m−2 s−1) and a controlled temperature of 30°C, with an efficient mixing system. Throughout the hydrogen production phase, we monitored dissolved oxygen levels in the culture alongside traditional oxygen measurements in the headspace.
Using our protocol with the pgr5 mutant of C. reinhardtii, we achieved a maximum specific rate of 72 μmol H₂ mg−1 Chl h−1 and an average rate of 30–35 μmol H₂ mg−1 Chl h−1 over 10 hours of illumination. Additional nitrogen flushing steps extended anoxia, resulting in a total hydrogen yield of 220 ± 20 mL L−1 over 48 hours of illumination. This performance is attributed to maintaining the redox balance of the plastoquinone pool and minimizing photodamage to the photosystem II complex. Our protocol offers a significant advancement for scalable and sustainable green hydrogen production.
1 INTRODUCTION
Hydrogen gas (H₂) serves as a clean energy carrier, emitting no carbon dioxide (CO2) during combustion. Despite this potential, nearly all industrial H₂ production—about 95%—currently relies on fossil fuels, primarily via natural gas in steam methane reforming, which emits large quantities of CO₂ (Cavaliere 2022). Achieving climate neutrality requires a transition to zero carbon-emission technologies for H₂ production, known as green H₂. One promising approach for green H₂ production is using algal cells as whole-cell biocatalysts, as they are easy to cultivate, grow rapidly, and offer efficient CO₂ sequestration, making them valuable for producing bioenergy and other high-value products (Lari and Khosravitabar 2021). Green microalgae, such as Chlamydomonas reinhardtii (C. reinhardtii), are capable of directly converting light energy into H₂ through [FeFe]-hydrogenases as one of their photoprotective mechanisms. This enables them to generate H₂ using only water and sunlight, achieving a zero CO₂ footprint with high theoretical energy conversion efficiency (Akkerman et al. 2002; Forestier et al. 2003).
A key constraint in algal H₂ production is the sensitivity of the hydrogenase enzyme to oxygen (O2), compounded by the dual role of photosystem II (PSII) in the H₂ production process. Hydrogenase activity demands electrons and protons derived from PSII activity, and at the same time, it is inhibited by the O2 produced by PSII. Furthermore, under normal physiological conditions, the hydrogenase is quickly outcompeted by the Calvin-Benson-Bassham (CBB) cycle, as carbon assimilation serves as the dominant electron sink (Vincent et al. 2005; Yacoby et al. 2011; Khosravitabar 2020). Early methods to address O2 sensitivity, like sulfur deficiency (Benemann 1997; Nagy, Vidal-Meireles, et al. 2018b), PSII-deficient mutants (Minagawa and Crofts 1994; Di Lin et al. 2013), or utilizing microalgae cell aggregates (Xiong et al. 2015) faced major limitations and resulted in low H₂ production rates (Sáenz et al. 2015; Min Woon et al. 2023; Khosravitabar and Spetea 2024). More recent approaches, such as O2 uptake-based methods (Nagy, Podmaniczki, et al. 2018a; Khosravitabar and Hippler 2019), two-phase ambient protocol (Elman and Yacoby 2022), and immobilization (Khosravitabar and Mamedov 2024) show great potential for sustaining higher H₂ production rates. Additionally, pulsed illumination has been investigated as a strategy to balance O2 production and consumption, leading to sustained and enhanced H2 production (Vajravel et al. 2023). However, this approach requires precise calibration of light intensity, frequency, and duration to prevent photoinhibition and oxidative stress, making the setup technically demanding (Kruse et al. 2005; Guo et al. 2017).
Several strategies have been explored to enhance electron allocation to the hydrogenase. These include utilizing Rubisco mutants (Marín-Navarro et al. 2010) and fusing the hydrogenase with electron carriers such as ferredoxin (Eilenberg et al. 2016), PSI (Appel et al. 2020) or superoxide dismutase (Ben-Zvi et al. 2019) to downregulate the CBB cycle. Each of these strategies has demonstrated varying degrees of success in increasing the electron supply to the hydrogenase. Over decades of research, several C. reinhardtii mutant strains with enhanced H₂ production capacity were identified, outperforming wild-type strains (King et al. 2022; Hippler and Khosravitabar 2024). Among them, the pgr5 mutant on the T222 wild-type background—known for its impaired cyclic electron flow, increased respiration rate, and reduced CBB cycle capacity—has proven to be the most effective H₂ producer (Steinbeck et al. 2015). The high H₂ production potential of the pgr5 mutant has been validated through multiple methods, including O₂-absorbent and substrate limitation techniques (Kosourov et al. 2018; Nagy, Podmaniczki, et al. 2018a, 2024) thin-cell-layer photobioreactors (Nagy et al. 2021), and ambient protocol (Elman and Yacoby 2022).
Given the hydrogenase enzyme's sensitivity to O₂, establishing anoxic conditions is essential to initiate H₂ photoproduction, regardless of the used strain. In many established methods, anoxia is achieved by briefly flushing the culture headspace with N₂, followed by a dark incubation period before exposure to high-intensity light (Nagy, Podmaniczki, et al. 2018a, 2021, 2024; Elman et al. 2022; Vajravel et al. 2023; Li et al. 2024). The dark period allows mitochondrial respiration to consume O₂ and establish the anoxia required for activating the hydrogenase. Recent findings, however, indicate that when anaerobic C. reinhardtii cultures are transferred to high light after a dark period, photosynthetic control mechanisms are rapidly activated upon light exposure. These mechanisms can reduce photosynthetic productivity by up to threefold and significantly decrease H₂ photoproduction shortly after exposure to light (Milrad et al. 2023).
In this study, we monitored changes in dissolved O₂ (DO) levels within the pgr5 culture during H₂ production alongside traditional measurements of O₂ gas levels in the culture headspace. We demonstrated that for the establishment of anoxia in the algal culture, the dark incubation phase can be effectively replaced with a slightly extended N₂ flushing of the culture headspace. During the semi-autotrophic H₂ production phase, anoxia in the culture was successfully maintained under specific incubation conditions. Building on these findings, we developed a simplified protocol to establish anoxia in the culture (despite the presence of O₂ gas in the headspace), initiate H₂ photoproduction, and sustain it at one of the highest reported rates.
2 MATERIALS AND METHODS
2.1 Strains and growth conditions
Experiments were conducted using the pgr5 mutant of C. reinhardtii, which was derived from the T222 wild-type strain (Steinbeck et al. 2015). Cells were maintained at 20°C under continuous light (40 μmol photons m−2 s−1) on Tris-acetate-phosphate (TAP) medium solidified with 1.5% w/v agar. For the experiments, cultures were grown in liquid TAP medium under constant light at an intensity of 90 μmol photons m−2 s−1 (Heliospectra, Sweden) on a rotary shaker set to 120 rpm at 20°C. Cultures were maintained until they reached the early mid-log phase, corresponding to a chlorophyll (Chl) concentration of 10–13 μg mL−1.
To determine Chl concentration, cells were collected by centrifugation at 15,000 g for 2 min, performed in triplicate. The cell pellet was resuspended in 1 mL of 80% (v/v) acetone and incubated in the dark at 4°C for 15 min. After incubation, samples were centrifuged again at 15,000 g for 2 min to remove cell debris. The absorbance of the supernatant at 664, 647, and 750 nm was measured spectrophotometrically, and Chl concentration was calculated following the method of (Jeffrey & Humphrey 1975).
2.2 H2 production methods and conditions
To track real-time changes in dissolved oxygen (DO) levels in pgr5 mutant cultures during the H₂ production process, we first utilized the “Two-Phase Ambient Protocol” introduced by Elman and Yacoby (2022), with minor adjustments to accommodate scale differences. In summary, mid-log-phase cultures grown in TAP medium (90 μmol m−2 s−1) at 20°C (75 mL culture, ~10 μg Chl mL−1) were supplemented with 75 μL of glacial acetic acid (16.7 M), adjusted to pH 7.8, and sealed in 100 mL bottles. The cultures were then flushed with N₂ for 3 min under room light, followed by a dark incubation. Subsequently, they were exposed to continuous light (350 μmol m−2 s−1) at 30°C while being mixed with a magnetic stirrer.
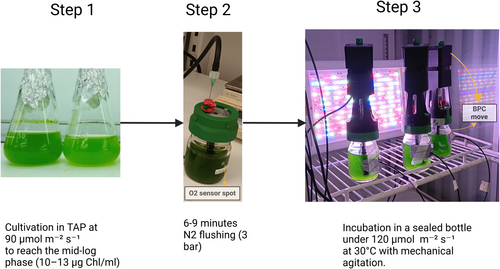
In our newly developed protocol, the mixotrophic growth phase involved growing the seed culture in TAP medium for approximately two days under constant light (90 μmol m−2 s−1) at 20°C. To initiate the semi-autotrophic H₂ production phase, once the culture reached a concentration of 10–13 μg Chl mL−1, 75 mL of culture was directly transferred to sealed 100 mL bottles without any additional treatment or medium exchange. After flushing with N2 gas at 3 bar for 6–9 min in the room light, the cultures were incubated at 30°C with constant, one-sided light exposure (120 μmol m−2 s−1), while mixed with a mechanical agitator (BPC Move, Sweden). A graphical summary of our protocol is presented in Figure 1.
2.3 Monitoring O2 and H2 production
Gas composition, specifically the % volume of O₂ and H₂ in the headspace, was determined at various time intervals. Samples were taken with a gas-tight syringe and analyzed using gas chromatography (GC) with a thermal conductivity detector (Agilent). Gas separation was achieved on a CP-Molsieve 5A column (50 m × 0.32 mm × 30 μm) kept at 70°C while the detector temperature was set to 250°C. Argon served as the carrier gas throughout the analysis.
For real-time monitoring of changes in DO levels in the pgr5 culture both during preparation and throughout H₂ production, a contactless optical O₂ sensor (PyroScience) was utilized. Autoclavable PyroScience O2 sensor spots (OXSP5) were affixed inside the culture bottles and paired with fiber-optic cables along with a temperature sensor, enabling real-time measurement of O₂ concentration in the culture by FireSting-O2 meter. This device was connected to a laptop, logging O₂ levels in μmol L−1 every second. The system performed automatic temperature and pressure compensation, ensuring precise O₂ measurements throughout the process.
2.4 Chlorophyll a fluorescence and electrochromic shift measurements
To assess PSII activity in pgr5 cells during H₂ production, samples were collected from the sealed bottles using a syringe and needle through a rubber septum at three different time points: 2, 12, and 20 h following anaerobic light incubation. The initial (zero)-time point served as the control, representing pgr5 cultures grown in standard flasks at 20°C in TAP medium for two days under 90 μmol m−2 s−1 light intensity.
Cells (20 μg Chl mL−1) were dark adapted for 15 min before recording Chl a fluorescence using a PHYTO-PAM-II (Walz). Dark-adapted steady-state minimum fluorescence yield (F0) was measured, followed by saturation pulses of 10,000 μmol photons m−2 s−1 for 800 ms to measure maximum fluorescence yield (Fm) under dark conditions and in light (F'm). The maximum quantum yield of PSII photochemistry (Fv/Fm) was calculated as (Fm − F0)/Fm. To determine the effective quantum yield of PSII photochemistry (Y(II)), chlorophyll fluorescence yield in the light (F′) was measured in cell culture (30 μg Chl ml−1) during a rapid response light curve, and 800-ms saturation pulses were applied every 30 s for the first 2 min of irradiation and then every 3 min to determine maximal fluorescence yield in the light (Fm′). Y(II) was calculated as (F'm − F′)/F'm, at the target light intensities (120 and 350 μmol m−2 s−1) according to the light curve.
For the electrochromic shift measurement, a DUAL-PAM 100 system (Walz) with P515/535 emitter/detector module was used. The difference in the absorbance signal (550–515 nm) was measured according to (Schreiber and Klughammer 2008). Cells filtered onto a GF/C filter (corresponding to 30 μg Chl mL−1) were dark adapted for 15 min, followed by exposure to actinic red light of 660 mmol photons m−2 s−1 for 5 min. The ECS decay kinetics were recorded after the light was turned off to determine the total ECS (ECSt) representing the total PMF size. Three pulses of 5-ms and 200,000 μmol photons m−2 s−1 were applied before each measurement and averaged to determine ECSST. The ECSST was used to normalize the ECSt values of each measurement. Normalization was done by multiplying ECSt with a correction factor calculated as (maxECSST/ECSST), where maxECSST is the highest ECSST from all the measurements of a dataset, and ECSST is the ECSST corresponding to the measurement of the ECSt that is being normalized.
2.5 Statistics
The data presented are based on a minimum of three independent experiments with three biological replicates each. Where applicable, averages and standard error of the mean (SEM) were calculated. Statistical differences were assessed using Student's t-test, with significance (p < 0.05) indicated by different letters (a, b, c, d).
3 RESULTS
3.1 Establishment and maintenance of anoxia in pgr5 cultures using ambient protocol
In algal H₂ photoproduction research, monitoring O2 availability is essential for maintaining conditions that support hydrogenase activity. In previous research, O₂ levels have typically been monitored in the culture headspace to detect the onset of anoxia as a requirement for hydrogenase activation. In this study, we have monitored real-time changes in DO levels within the algal culture in parallel with changes in O₂ gas levels in the headspace throughout the H₂ production process.
We first monitored the changes in O2 levels in the pgr5 culture during H₂ photoproduction when implementing the ambient protocol (Elman and Yacoby 2022; Elman et al. 2022). Upon sealing the cultures, initial measurements revealed a DO level of about 250 μmol L−1 in the culture (Figure 2A, B), and approximately 18% O₂ gas in the headspace (Figure 2C). After conducting a 3-min N₂ flush, the O₂ concentration in the headspace decreased to approximately 8% (Figure 2C), while the DO level in the culture dropped to around 180 μmol L−1 (Figure 2B).
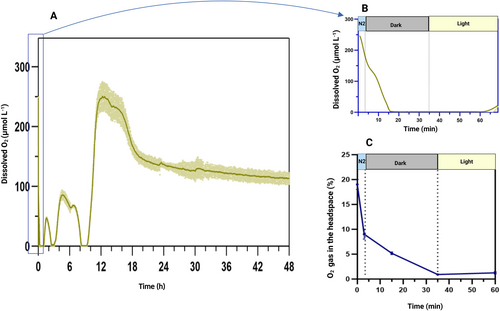
Following the ambient protocol, the sealed cultures were then incubated in darkness. Remarkably, within just 10 min of dark incubation, the DO level in the culture was reduced from 180 μmol L−1 to zero (Figure 2B), even though over 5% O2 gas was still detected in the headspace by GC (Figure 2C). After additional 20 min in darkness, the O₂ concentration in the headspace also approached near-zero levels. These data indicate that the O₂ level in the gas phase does not accurately reflect the O₂ availability in the culture. This suggests that when O₂ is removed from the headspace through N₂ flushing, more O₂ diffuses from the liquid phase into the gas phase due to the concentration gradient. The remaining dissolved O₂ is rapidly consumed by respiratory processes during the dark phase. However, the rate-limiting factor appears to be the re-diffusion of O₂ from the gas phase back into the liquid for further consumption. Consequently, even when the culture became anoxic, a significant amount of O₂ remained detectable in the headspace, and it took longer for the gas-phase O₂ to dissolve into the culture, be consumed, and subsequently removed from the headspace.
During the subsequent high light exposure, DO levels in the culture began to rise within only 30 min, displayed some fluctuations and then a pronounced peak emerged after 12 h of illumination (Figure 2A). Later, DO levels stabilized at around 150 μmol L−1. Over the first 10 h of light incubation, the pgr5 culture produced approximately 20 ± 5 mL of H₂ per liter of culture. However, H₂ production ceased concurrently with the appearance of the main DO peak.
3.2 Establishment and maintenance of anoxia in pgr5 cultures using either N₂ flushing or dark incubation
To evaluate whether anoxia could be established in the algal culture through either an extended dark incubation period alone or an extended N₂ flushing alone, we monitored DO changes in the sealed pgr5 culture under each condition. Additionally, to evaluate the impact of light intensity on the maintenance of induced anoxia, cultures were illuminated at two different intensities (350 and 120 μmol photons m−2 s−1).
When we tested if dark incubation alone could induce anoxia, we observed that even after 2 h in darkness (with a culture volume of only 75 mL), DO levels in the pgr5 culture remained around 150 μmol L−1 (Figure 3A). Upon exposure to light, DO levels began to rise at both tested intensities. At 350 μmol m−2 s−1, DO in the culture rose to around 500 μmol L−1 within 1 h of light exposure and then decreased to about 300 μmol L−1 until 6 h. At 120 μmol m−2 s−1, DO levels rose and stayed at around 300 μmol L−1 for the entire illumination period. We hypothesized that in the ambient protocol, it is the initial N₂ flushing, rather than the dark incubation, that plays the key role in reducing the available dissolved O₂ (allowing it to be rapidly consumed during the dark phase).
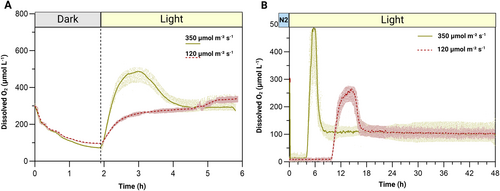
To test our hypothesis, we applied an extended N2 flushing in the pgr5 culture without a dark incubation. With this approach, DO levels in the culture dropped to zero within only 6–9 min of N₂ flushing (Figure 3B), depending on the initial Chl concentration (10–13 μg mL−1). After flushing, the cultures were incubated under constant light (350 and 120 μmol photons m−2 s−1) at 30°C with mechanical agitation. These conditions allowed the culture to sustain induced anoxia even after light exposure for up to 4 to 10 hours, depending on the utilized intensity. In the culture exposed to light at 350 μmol m−2 s−1, DO levels began to rise after 4 h of illumination, reaching a peak of approximately 480 μmol L−1 over the next 2 h. By the 8 h of light exposure, DO levels stabilized at around 100 μmol L−1. In contrast, at 120 μmol m−2 s−1, DO levels did not start to rise until 10 h of light exposure, eventually reaching a maximum of about 250 μmol L−1 over the following 4 h. Four hours later (after 18 h of light exposure), DO levels stabilized around 100 μmol L−1 for the remaining incubation time.
3.3 Boosting H₂ production using our newly developed semi-autotrophic protocol
We have designed a new protocol (Figure 1) building on our observations of inducing anoxia by N2 flushing for 6–9 min and maintaining it for 10 h during illumination at 120 μmol m−2 s−1 (Figure 3B). To evaluate the potential of the pgr5 mutant for H₂ production, in addition to real-time monitoring of DO changes in the culture, we analyzed the gas composition (O₂ and H₂) at different time intervals using GC. Total H₂ production was calculated and expressed as milliliters of H₂ per liter of culture.
As illustrated in Figure 4 (A and B), the overall O₂ pattern of changes in the headspace closely resembled the DO changes in the culture. However, during the first 10 h of light exposure, while the culture remained anoxic, there was still 5–8% O₂ gas detectable in the headspace.
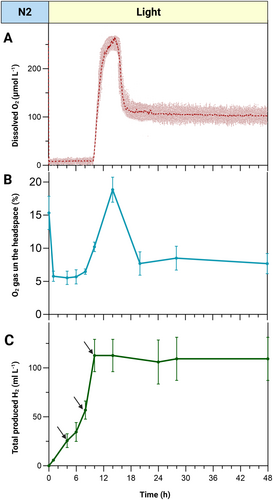
Notably, during this 10-h period, the pgr5 mutant produced 106 ± 25 mL L−1 of H₂—a substantial yield achieved within a relatively short timeframe and without any special cell treatment or medium exchange (Figure 4C). The calculated average H₂ production rate over these 10 h was 30–35 μmol mg Chl−1 h−1, reaching a maximum specific rate of 72 μmol mg Chl−1 h−1 between 8 and 10 h after light onset. Following this burst, however, H₂ production ceased, coinciding with a sharp increase in O₂ levels after 10 h (Figure 4A, B).
To prevent the negative impact of high H₂ partial pressure on the hydrogenase activity, we applied brief N₂ flushing (1 min) immediately after H₂ quantification every 4 h (at the time points indicated by the black arrows in Figure 4C). This was necessary because, within 4 h of light onset, the H₂ concentration in the 25 mL culture headspace exceeded 7%, while concentrations above 5% are known to shift hydrogenase activity towards H₂ consumption (Kosourov et al. 2012). We found that a quick 1-min N₂ flushing was sufficient to remove all residual H₂ from the headspace, as confirmed by GC measurements. Notably, this quick flushing had no significant effect on O₂ levels in the headspace, as shown in Figure 3B.
To determine whether longer N₂ flushing could re-establish and extend anoxia when O₂ levels began to rise, we conducted extra N₂ flushing (6–9 min) at various time points. Initially, we applied these flushes during different time points of the O₂ peak period (indicated by black arrows in Figure 5A), but unexpectedly, it proved ineffective. While the DO level decreased during flushing, it quickly returned to its original level once the flushing stopped. In our subsequent attempt, we performed additional rounds of N₂ flushing once the DO levels had stabilized (shown by black dashed lines in Figure 5). This adjustment allowed us to re-establish anoxia: with a second N₂ flushing (only 6 min), the culture achieved anoxia again and maintained this state for approximately 6 h, after which a new O₂ peak emerged that was slightly smaller than the previous peak (Figure 5A).
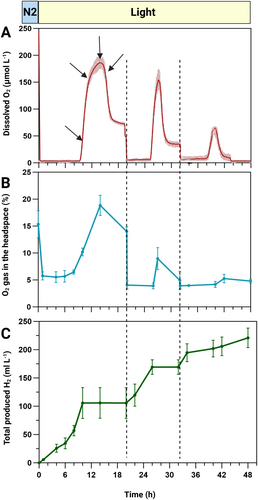
By re-establishing anoxia in the culture, the cells resumed H₂ production and sustained it for 6 h at an average rate of approximately 23–26 μmol mg Chl−1 h−1. The third N₂ flushing (6 min) allowed us to sustain anoxia for an additional 8 h, followed by a considerably smaller O₂ peak. During this period, H₂ production continued at an average rate of 18–22 μmol mg Chl−1 h−1. Under these optimized conditions, the pgr5 mutant produced a total of 220 ± 20 mL L−1 of H₂ over 48 h.
3.4 Photosynthetic apparatus stability and function during H2 production
To examine the effect of omitting the dark phase on the performance of the photosynthetic apparatus, we determined the maximum quantum yield of PSII photochemistry (Fv/Fm), the effective quantum yield of PSII photochemistry under actual growth light (Y(II)), and the total proton motive force (PMF) at various time intervals during H₂ production. These measurements were conducted for the pgr5 cells during H2 production using either the ‘ambient’ protocol or our newly developed protocol.
In the ambient protocol, when the pgr5 culture was exposed to high light intensity (350 μmol m−2 s−1) following 30 min of anaerobic dark incubation, Fv/Fm dropped by 60% in the first 2 h as compared to control cells (Figure 6A), suggesting a compromised maximum PSII activity. Y(II) decreased by 80% (Figure 6B), indicating significant down-regulation of PSII effective activity. Furthermore, at this time point, PMF decreased by 50% (Figure 6C), indicating a potential decoupling of electron transport between PSII and the PQ pool, which may contribute to the observed PSII inhibition.
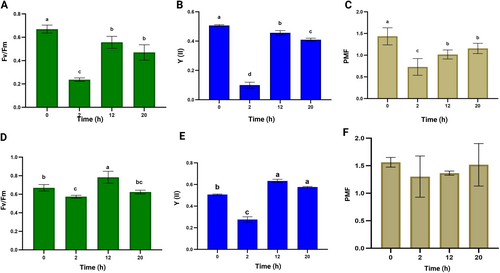
After 12 h in high light, the pgr5 cells appeared acclimated, with both Fv/Fm and Y(II) recovering to approximately 80 and 90% of control levels, respectively (Figure 6A, B). The increase in PMF size (Figure 6C) likely reflects a restored redox balance in the thylakoid membrane during acclimation. The observed recovery in PSII activity (after 12 h) coincides with a peak in DO in the pgr5 culture (Figure 2A), supporting the idea of resumed PSII function. After 20 h of incubation, when DO levels in the culture had stabilized (Figure 2A), there was a minor decrease in both Fv/Fm and Y(II) (Figure 6A, B).
In our optimized H2 photoproduction protocol, when pgr5 cultures were exposed to moderate light (120 μmol m−2 s−1) following N2 flushing. Fv/Fm decreased by 15% (Figure 6D), while Y(II) declined by 50% within the first 2 h as compared to control cells (Figure 6E). These data indicate that while PSII's effective activity was partially downregulated in these H2-producing cells, its maximum capacity remained largely intact. Notably, after 12 h, both Fv/Fm and Y(II) recovered to levels even higher than the initial control values, coinciding with the observed peak of DO in the culture (Figure 4A). By 20 h, Fv/Fm was not significantly different from the control cells, while Y(II) showed no significant changes as compared to its value at 12 h (Figure 6 D, E). Throughout the sampling time points, the PMF across the thylakoid membrane remained relatively stable (Figure 6F), suggesting a maintained redox balance within the PQ pool. This stability may underlie the more consistent PSII activity and structural integrity observed here (Figure 6D, E).
4 DISCUSSION
4.1 Establishing and sustaining anoxia in pgr5 cultures through gas discharge: an effective alternative to dark incubation
In this study, we demonstrated that a dark incubation phase may not be essential for the onset of anoxia and initiation of H2 production, at least in the case of the pgr5 mutant, which has a higher respiration rate than wild-type cells and thus a greater capacity for O₂ consumption (Elman et al. 2022). By simultaneously monitoring O₂ levels in both the culture's headspace and dissolved O₂ within the culture, we found that anoxia can be effectively accomplished in the culture through a slightly extended N₂ flushing (Figure 3B). The required duration of N₂ flushing (6–9 min) depends on the initial cell density of the culture (10–13 μg Chl mL−1) and also on the headspace volume (25 mL). Our specific incubation conditions successfully sustained anoxia, induced by extended N₂ flushing, for up to 10 h after the onset of illumination in pgr5 cultures (Figure 3B). The specific conditions include the following parameters: (1) effective mixing via mechanical agitation; (2) an incubation temperature of 30°C, and (3) a light intensity of 120 μmol m−2 s−1.
Effective mixing is crucial for optimal light utilization and efficient gas exchange between the liquid and gas phases (Acién Fernández et al. 2013). To ensure thorough agitation, instead of traditional magnetic stirrers, we used a mechanical agitator (BPC move, Figure 1), which allowed for more efficient mixing. This mixing system, combined with an elevated incubation temperature, facilitated the transfer of O₂ from the liquid to the headspace, thereby maintaining anoxia in the culture.
At room temperature, a robust mixing system would likely introduce more O₂ from the gas phase into the liquid. However, with our protocol's elevated incubation temperature (30°C), which increases gas fugacity, robust mixing promotes the escape of gases (O₂, CO₂, and H₂) from the liquid to the headspace, helping to maintain anoxia in the liquid culture. This also limits CO₂ availability for Rubisco, promoting electron allocation to hydrogenase, and prevents H₂ oxidation by hydrogenase (reverse reaction).
It is well-established that C. reinhardtii can tolerate temperatures up to 37°C without negatively impacting its photosynthetic apparatus and that 20 to 30°C is the optimal range for photosynthetic electron transport (Geier et al. 2012; Khosravitabar and Spetea 2024). Additionally, temperatures above 20°C are likely to reversibly inactivate CO2 fixation (Weis 1981) but upregulate photorespiration (Coleman and Colman 1980). This dual effect promotes O₂ consumption, facilitating the establishment of microoxic conditions, and redirects electron flow to the hydrogenase enzyme (Khosravitabar and Spetea 2024).
It is known that increasing the light intensity promotes H₂ photoproduction (Khosravitabar and Spetea 2024), however, it should be low enough to avoid high-light stress. Our goal was to choose a light intensity higher than the standard intensity (90 μmol m−2 s−1) used for the cultivation of the pgr5 mutant yet low enough to protect the photosynthetic apparatus. The chosen light intensity of 120 μmol m−2 s−1 proved effective for sustained anoxia while supporting H₂ production for up to 10 h (Figure 4B). (Khosravitabar and Spetea 2024). This setting was initially a random choice but demonstrated to be well-suited for this application. The benefit of this light intensity will be discussed in more detail below.
In addition to inducing anoxia in the culture, another key factor supporting the high rate of H₂ production in our protocol is the intentional substrate limitation for the CBB cycle. By flushing with N₂, we remove not only O₂ but also CO₂, limiting its availability for fixation by Rubisco. Furthermore, since the cells were cultured in TAP medium for over two days prior to the H₂ production phase and the medium was not refreshed, the acetate level at the start of H₂ production was likely very low, as most of it had already been converted to biomass (Degrenne et al. 2010). With both acetate and CO₂ limitation, carbon fixation is effectively downregulated, allowing more electrons to be diverted toward the hydrogenase for enhanced H₂ production.
4.2 Enhancing photosynthetic stability and H₂ photoproduction by replacing dark incubation with N₂ flushing and moderate light
Milrad et al. (2023) reported that in the anaerobic culture of C. reinhardtii, shortly after the transition from dark to high light, photosynthetic control mechanisms are induced, which significantly downregulate linear electron flow, leading to a notable decrease in H₂ photoproduction (Milrad et al. 2023). Most recently, it has been shown that anaerobic dark incubation of C. reinhardtii cells prior to high-light exposure has a synergistic effect in inducing photoprotective mechanisms (Faraloni et al. 2024). This response is proposed to be triggered by the over-reduction of the PQ-pool, alerting the cells to stress (Virtanen and Tyystjärvi 2023). Consequently, upon exposure to high light, the cells swiftly activate photoprotective mechanisms while minimizing linear electron flow.
During anaerobic dark incubation of the cells, a large electrochemical gradient is built across the thylakoid membranes (Finazzi and Rappaport 1998), likely due to ATP hydrolysis and pumping of protons into the lumen (Johnson et al. 2014). Enhancement of the electrochemical gradient slows down the cytochrome b₆f complex, leading to an enhanced reduction state of the PQ-pool (Khosravitabar and Mamedov 2023).
When using the two-phase ambient protocol, Fv/Fm, Y(II) and PMF after 2 h of illumination were all reduced as compared to the control cells (Figure 6A to C). We propose that in anaerobic dark-adapted cells, while the PQ pool is more reduced, the PSII reaction centers are fully oxidized. Upon exposure to light, particularly at high intensity, a substantial electron flux from P680 to QA occurs, resulting in further PQ pool over-reduction (Ivanov et al. 2008). This may lead to an increased formation of QA−, which can induce HCO₃− dissociation from the non-heme iron between QA and QB, thereby decoupling electron transport within the PSII complex and ultimately reducing the electron output of PSII (Milrad et al. 2023).
Conversely, when using our semi-autotrophic protocol, establishing anoxic conditions with N2 flushing alone, without prior dark incubation, likely does not induce PQ pool over-reduction. This is evidenced by the absence of significant PMF changes throughout the illumination (Figure 6F). After N2 flushing without dark adaptation, the PSII reaction centers remain partially closed (not fully oxidized), and subsequent light exposure at moderate intensity (120 μmol m−2 s−1) prompts a moderate but steady rate of electron transport (Figure 6E). We suggest that this moderate electron transport allowed the rate of O₂ evolution to balance with O₂ consumption through various respiratory processes for up to 10 h of light exposure (Figure 4A).
Over time, at around 12 h of illumination, the photosynthetic apparatus begins to acclimate to the incubation conditions (especially the higher temperature), eventually recovering the maximum and effective quantum efficiency of PSII (Figure 6 D and E). Notably, the peak H₂ production rate was achieved just before the onset of detectable DO in the culture (Figure 4), suggesting that this peak may align with enhanced PSII electron transport activity and originated from water splitting rather than indirect biophotolysis.
In this scenario, by preserving the redox balance of the PQ pool, our proposed protocol achieved a record in situ maximum specific rate of 72 μmol H₂ mg−1 Chl h−1 and an average rate of 30–35 μmol H₂ mg−1 Chl h−1 within the first 10 h of illumination using the pgr5 mutant. This average rate represents a nearly fivefold increase compared to the rate achieved using the phototrophic method (Nagy et al. 2024) and is approximately double the rate achieved with the ambient protocol (Elman et al. 2022), both employing the same pgr5 mutant.
4.3 Practical considerations for scalability and future directions
While N₂ flushing is effective for establishing and maintaining anoxic conditions at the laboratory scale, its reliance on external gas supplies could become cost-prohibitive and logistically challenging for large-scale implementation. To address this, we propose that for large-scale H₂ production, O₂ removal from the bioreactor headspace can be effectively managed using gas collection systems and external pumps, eliminating the need for N₂ flushing. This modification not only reduces costs but also enhances scalability. Furthermore, in principle, during large-scale operations, for safety reasons, gases must routinely be discharged and collected from the headspace of closed photobioreactors, making this method a practical and necessary solution.
This simple yet effective approach has the potential to be seamlessly integrated with existing technologies, such as thin-layer bioreactors, to further optimize H₂ production. The method's core requirements—mechanical agitation, heating, and gas discharge—are not only practical for scaling up but also align with essential safety protocols. Routine gas collection from the bioreactor's headspace managed through widely available gas collection systems, ensures compatibility with large-scale industrial setups.
However, a detailed cost–benefit analysis of this approach, considering operational and energy efficiency, is essential to identify the most economically viable pathway. Such an analysis lies beyond the scope of this study and represents an important direction for future research. Additionally, further investigations into fine-tuning the redox state of the PQ-pool could unlock improvements in PSII efficiency and H₂ production rates. Optimizing environmental parameters such as light intensity, temperature, and other factors may provide more precise control over the redox balance, paving the way for even greater yields in future applications.
While algal systems for hydrogen production hold immense promise for sustainable energy generation, their environmental impacts must be carefully considered at industrial scales. Factors such as energy input, nutrient use, water demand, and land footprint are critical to evaluate. Integrating renewable energy sources, recycling water and nutrients, and using waste or non-arable land for bioreactors can help mitigate these impacts. Additionally, efficient management of gas emissions and algal residues is essential to minimize potential environmental disturbances. Future research should prioritize life-cycle assessments and environmental impact analyses to ensure that scaling up algal hydrogen production remains both environmentally and economically sustainable.
AUTHOR CONTRIBUTIONS
F.K. conceptualized the study, designed and conducted all experiments, except for the ECS measurements, which were performed and analyzed by K.M.S. Analysis of the DO data was carried out by L.S.C.
C.S. contributed to the design of the experiments, interpretation of the results and provided critical insights. F.K. drafted the manuscript, and all authors reviewed and edited the final version. All authors have read and approved the manuscript.
ACKNOWLEDGEMENTS
This work was supported by grants from the Olle Engkvist Foundation to C.S. (218–0099 and 232-0202) and the Swedish Research Council (VR 2016-03836). F.K. was a recipient of a postdoctoral fellowship from the Olle Engkvist Foundation during 2023-2025. We acknowledge Prof. Michael Hippler (University of Münster, Germany) for providing the pgr5 mutant and valuable feedback on the manuscript.
Open Research
DATA AVAILABILITY STATEMENT
Data sharing is not applicable to this article as all new created data is already contained within this article.


