Effects of acclimation to long-term shading on photosynthesis in grapevines: roles of non-structural carbohydrates and stomatal conductance
Abstract
Plant acclimation to varying light environments can enhance productivity. However, limited research exists on how plants re-acclimate to sunlight after shading, despite the increasing use of transient crop shading techniques to mitigate climate change impacts. This study focused on grapevine, a species highly responsive to shade, to explore the effects of prolonged shading on photosynthetic re-acclimation of plants upon sun re-exposure. An experiment was conducted using pot-grown plants subjected to different shading durations and then transferred to sunlight conditions. Results varied depending on whether leaves developed under sun or shade and on the duration of shading. Under shade, stomatal conductance decreased by up to 50%, while photosynthesis was reduced by 30–60%, with longer shading periods causing a greater decrease. Upon sun re-exposure of shaded plants, sun-developed leaves gradually reached 100% of the stomatal conductance of sun-control plants, but their photosynthesis remained at 70%. Despite reduced photosynthesis, analyses of non-structural carbohydrate (NSC) contents revealed that carbohydrate pools were maintained in shaded leaves, likely due to reduced carbon demand by plant sinks under shade. The maintenance of NSC limited optimal photosynthetic recovery upon sunlight re-exposure. In contrast, shade-developed leaves did not increase photosynthesis upon transfer to sunlight due to irreversible morphological changes. This study provides new insights into the impact of shade acclimation on biochemical, physiological and morphological processes when plants are subjected to changing light environments.
1 INTRODUCTION
Plants, in cultivated fields or in natural habitats, are exposed to cyclic variations in light intensity on daily and seasonal scales. Agricultural practices can alter light intensity and spectral composition at the leaf level due to modifications in plant structure and self-shading within the canopy (González et al. 2021; Sales et al. 2023). Additionally, protective nettings or agrivoltaic systems further expose the plant canopies to long-lasting (days to weeks) or short-term (intra-day) changes from sun to shade conditions (Mupambi et al. 2018; Weselek et al. 2019). These shading practices are receiving increased attention (Al Mamun et al. 2022; Pallotti et al. 2023), as they may help mitigate the effects of global warming, such as increased frequency of heat waves, drought episodes and extreme weather events (Weselek et al. 2019; Pörtner et al. 2021; Touil et al. 2021; Alon et al. 2022). However, shading can be detrimental to plant growth and yield, as photosynthesis is reduced under these conditions (Prieto et al. 2010; Dayer et al. 2021). Little is known about how long the negative effect of shading on photosynthesis persists when the canopy is re-exposed to the sun, making the consequences of temporary shading techniques unpredictable.
Leaves acclimate to their light environment by adjusting their biochemical, physiological and morphological traits (Givnish 1988) —a process known as developmental acclimation (Athanasiou et al. 2009; Morales and Kaiser 2020). Leaves developed under sun conditions typically exhibit lower specific leaf area (SLA), well-developed palisade parenchyma, higher stomatal density and chloroplast proteins, enhancing the photosynthesis rate, compared to shade leaves (Valladares and Niinemets 2008; Mathur et al. 2018). Conversely, shade acclimation leads to larger and thinner leaves (higher SLA) and modified pigment composition and chloroplast proteins to maximize light capture at the expense of leaf photosynthetic capacity (Franklin 2008; Valladares and Niinemets 2008; Mathur et al. 2018). While biochemical and physiological adjustments are still possible once leaves are fully developed, morphological adjustments are less likely to occur (Niinemets 2007; Athanasiou et al. 2009). Although shading may reduce growth and yield potential (Jackson and Palmer 1977; Trentacoste et al. 2022), a rapid acclimation of plants to changing light environments could, in some cases, enhance productivity (Athanasiou et al. 2009; Kromdijk et al. 2016).
Most studies on leaf photosynthesis responses have focused on short-term variations (minutes to one day), with limited attention responses to medium and long-term changes in light conditions (Morales and Kaiser 2020). Photosynthesis is regulated by multiple mechanisms, including the sink strength for carbon at the plant level, which is likely altered by medium to long-term changes in the light conditions (Paul and Foyer 2001; Quereix et al. 2001). When the demand for carbon by the plant is limited, a down-regulation of photosynthesis in source leaves is typically observed (Paul and Foyer 2001; Pallas et al. 2008). Low demand for carbon by the sink organs leads to the accumulation of non-structural carbohydrates (NSC) in leaves when they are not exported via the phloem (Quereix et al. 2001). This mechanism is linked to a reduction in triose phosphate utilisation that is known to limit photosynthesis rate (Bernacchi et al. 2009; Holzapfel et al. 2010).
Understanding how leaf photosynthesis acclimates to medium to long-term changes in light is particularly critical in grapevine, given the various practices that modify canopy structure, such as trellising, green pruning, trimming or topping, all of which alter the amount of intercepted radiation by the leaves during the growing season (Greer and Weedon 2012; Wang et al. 2019). Furthermore, as lianas, grapevines evolved to thrive in understorey environments, requiring their acclimatisation to contrasting light conditions. Reduced branching, increased specific leaf area (SLA) and vertical growth are some of the morphological mechanisms that are observed in grapevines under shading conditions (Cartechini and Palliotti 1995; Pallas and Christophe 2015; González et al. 2019). Grapevine leaves subjected to shading exhibit lower photosynthesis rates, stomatal conductance and water use efficiency (Palliotti et al. 2000; Dayer et al. 2021; González et al. 2021). A better understanding of how photosynthesis responds to medium to long-term changes in light environments is necessary (Morales and Kaiser 2020), especially in the context of agrivoltaics or protective nettings, which are increasingly being used in vineyards (Tiffon-Terrade et al. 2023).
In this work, we hypothesised that grapevines dynamically acclimate to changes in the light environment at the leaf and plant level, and that this acclimation could be different if leaves were developed under sun or shade conditions. Our objectives were (i) to assess the remanent effect of shading on leaf photosynthesis after plants were shaded for an extended period and subsequently re-exposed to sunlight, and (ii) to identify the biochemical and physiological mechanisms underlying leaf responses to different light conditions. To this aim, we studied potted plants that experienced different durations of shading before being re-exposed to sunlight and compared them to plants permanently grown under sunlight conditions. Photosynthetic activity, stomatal conductance, non-structural carbohydrate contents, and other physiological traits were evaluated under the different light scenarios.
2 MATERIALS AND METHODS
2.1 Experimental site and plant material
Experiments were carried out at the Institut Agro Montpellier in France (43.83’ N, 38.53′ E) in July and August 2021 using four-year-old Syrah (clone 747) grapevines. Stems with two nodes were grafted on 110 Ritcher rootstocks (Vitis berlandieri x Vitis rupestris) in January 2018 and grown outdoors in pots filled with organic compost for three years. Pot volumes were changed from 3 L in 2018 to 9 L in subsequent years. In January 2021, plants were pruned to two buds and transplanted into new 9 L pots containing 4.5 kg of dry soil (70% peat and 30% clay, custom-made potting soil, Klasmann-Deilmann). Potted plants were arranged in NW-SE-orientated rows with 2.8 plants per meter and 1.5 m between rows. Following budburst in April 2021, one primary axis per plant was selected and allowed to grow up to 15–17 leaves. Secondary axes were maintained at nodes 9, 10, 13 and 14 from the base, and the leaves growing from these axes were used for subsequent measurements. Throughout the nursery and experimental periods, the plants were drip ferti-irrigated two or three times daily to prevent mineral deficiency or water stress. A nutrient solution (2.2% N, 1.6% P₂O₅, 6.4% K₂O, 1.6% MgO, 3.2% SO₃) was applied on each ferti-irrigation at a 0.2% proportion. Additionally, irrigation was adjusted to maintain the potting soil at field capacity, which was set at 6.5 kg per pot (Coupel-Ledru et al. 2014). To monitor pot weight, a subset of ten pots under both sunlight and shade conditions (see below) were placed on individual strain gauge load cells (Micro Load Cell model CZL635, capacity 20 kg) connected to a datalogger (Campbell Scientific) that recorded pot weights every 10 minutes averaging measurements taken every 30 seconds.
During the experiments, grapevine plants were grown under either full sunlight or under shaded conditions below a light-shielding shelter. The shelter consisted of a neutral polyester net covering the top and sides of the row, with both ends opened for air circulation in the direction of the prevailing wind. In both sunlight and shade conditions, air temperature and relative humidity were monitored with a capacitive hygrometer (HMP155 Vaisala) and photosynthetic photon flux density (PPFD) was measured with a photosynthetically active radiation (PAR) sensor (215 SKP; Skye Instruments Ltd.). Under sunlight, the daily mean air temperature was 24.8 ± 5.3°C, the daily accumulated PPFD was 45.8 ± 9.9 mol m−2 d−1 and the mean daily maximum Vapour Pressure Deficit (VPD) was 3.2 ± 0.8 kPa. Under the shelter, the daily mean air temperature was 24.9 ± 4.8°C, the daily PPFD was 10.6 ± 3.0 mol m−2 d−1 and the mean daily maximum VPD was 2.9 ± 0.7 kPa (Figure S2). Radiation intensity below the shelter was 23% of full sunlight conditions, with a 0.98 red to far red ratio (calculated as PPFD at 660 ± 10 nm to PPFD at 730 ± 10 nm), which is close to the 1.1 ratio measured under direct sunlight (González et al. 2016; Figure S1).
2.2 Experimental setup, treatments and dates of measurements
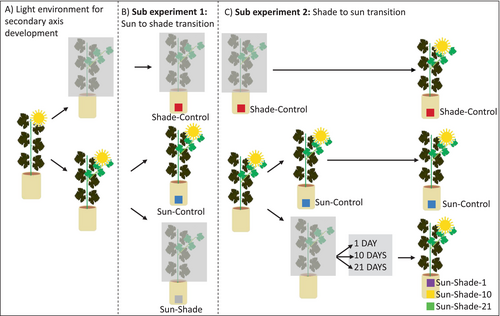
The experiment comprised three phases (Figure 1): 1) an initial phase preceding measurements where plants were grown either in full sunlight or under shade; 2) a second phase, referred to as sub-experiment 1, aimed at studying the transition from sunlight to shade. During this phase, a subset of the plants in full sunlight were transferred to shade while another subset remained in the sunlight and 3) a third phase, referred to as sub-experiment 2, focused on studying the transition from shade back to sunlight, where shaded plants were re-exposed to sunlight.
2.3 Secondary axis development under contrasting light environments prior to measurements
During the initial phase, to analyse the differences between secondary leaves (borne by secondary shoot axes) that developed either under sun or shading conditions, a subset of 10 plants was transferred early in the season (14/06/2021). This ensured that their secondary leaves entirely developed in the shade. This set of plants corresponds to the shade-developed control treatment (Shade-Control). The remaining plants developed their secondary leaves under sunlight conditions. A subset of 15 of these plants was maintained under sunlight conditions and they correspond to sun-control treatment (Sun-Control).
2.3.1 Sub-experiment 1: sun-to-shade transition
This experiment aimed at studying the effect of moving plants from sun to shade on leaf gas exchange. A subset of plants with sun-developed secondary leaves was transferred to the shelter (Sun-Shade), and measurements were taken over three consecutive days starting from the first day after the transfer to shade. This experiment was repeated three times (from 20/07 to 22/07, from 31/07 to 02/08 and from 14/08 to 16/08) with 5 new plants for Sun-Shade treatment each time.
2.3.2 Sub-experiment 2: shade-to-sun transition
The second experiment aimed at studying the re-exposure to sun conditions after different shading durations on leaf characteristics and gas exchange. For this purpose, new subsets of plants, different from those studied in sub-experiment 1, were transferred to the shelter and maintained under shading conditions for different durations: 1 day, 10 days or 21 days (Sun-Shade-1, Sun-Shade-10, Sun-Shade-21 treatments, respectively). Once the shading period was completed, all plants, including those with secondary axes developed under shading (Shade-Control), were transferred to sun conditions on the same day. Measurements were taken the day before the transition to sun conditions (day −1), on the first three consecutive days and on the 10th day after this transition. This sub-experiment was repeated twice (from 09/08 to 20/08 and from 16/08 to 26/08) with 5 plants per treatment, except for Shade-Control plants which were included only once (from 09/08 to 20/08).
2.4 Plant measurements common to sub-experiments 1 and 2
Measurements were performed on days 1 to 3 after the transition from sun to shade for the sub-experiment 1. For sub-experiment 2, measurements were performed the day before the date of re-exposure to sun condition (day −1) and 1, 2, 3 and 10 days after this date. Measurements were performed on one fully expanded leaf per plant, with 5 plants per treatment. The leaves were located at nodes 5 to 7 from the base of a secondary shoot, themselves branched at nodes 9 to 10 from the base of the primary axis.
Gas exchanges were measured on individual leaves subjected to saturating light (PPFD = 1500 μmol m−2 s−1) under two conditions: (1) ambient CO2 (400 μmol mol−1 air) to determine the light-saturated CO2 assimilation rate (Asat) and the corresponding stomatal conductance (gsw), and (2) saturating CO2 (1800 μmol mol−1 air) to determine the maximum CO2 assimilation rate (Amax; Busch et al. 2024). Intrinsic leaf water use efficiency (iWUE) was calculated as the ratio of Asat to gsw. Measurements were performed between 10:00 and 13:00 h (local time, GMT +2) with an infra-red gas analyzer (LI-6800, LI-COR Biosciences Inc) equipped with a chamber enclosing 2.5 cm2 of leaf area. Measurements were recorded after 5–10 minutes of stabilization of the enclosed leaf under moderate evaporative demand conditions inside the chamber (leaf-to-air VPD = 1.9 ± 0.2 kPa, leaf temperature = 27.4 ± 0.7°C, air flow rate = 555 ± 0.03 μmol s−1). Additionally, chlorophyll index (SPAD) was measured on the same leaf using a SPAD-502 chlorophyll meter (Konica-Minolta).
2.5 Additional measurements in sub-experiment 2
2.5.1 Shoot biomass increase
Shoot biomass increase was estimated through the dry mass of secondary axes produced during the shading period for the Sun-Shade-10 (10 days) and Sun-Shade-21 (21 days) treatments and over a 21-day period for controls (Sun, Shade). For Shade-Control and Sun-Control plants, the secondary axes that were harvested corresponded to the period of 21 days during which Sun-Shade-21 plants had been placed below the shelter. At the beginning of treatment application, the four secondary axes maintained at nodes 9, 10, 13 and 14 from the base of the plants and were marked at their tips with small rings. At the end of the period of treatment application, the distal portions of the shoots that had grown beyond these rings along with any new secondary shoots grown at other nodes, were cut, oven-dried at 60°C until no water loss occurred and weighed. The total dry mass produced was then divided by the duration of the period during which the secondary axis grew for each treatment, thus allowing comparisons between treatments of different durations.
2.5.2 Other leaf traits
Midday leaf water potential (Ψmd) was measured between 13:30 and 14:00 h (local time, GMT +2) using a Scholander pressure chamber (Soil Moisture Equipment Corp.) on days −1, 1 to 3 and 10, on a leaf of a secondary shoot inserted at node 13 or 14 on the primary axis.
Specific leaf area (SLA) was determined on day 10 using the same leaf used for gas exchange measurements. Leaf area was determined with a LI-3100C (LICOR Bioscience Inc.) and the dry weight (after 48 h oven drying at 60°C) was measured. SLA was calculated as the ratio of leaf area to dry weight.
Non-structural carbohydrates (NSC) were analysed on two leaf discs of 0.50 cm2, sampled between 13:00 and 13:30 h (local time, GMT +2) from a leaf immediately above or below the one used for gas exchange, on days −1, 1, 3 and 10. The leaf discs were frozen in liquid nitrogen and stored at −80°C until analyses. On these samples, NSC concentrations, including hexose, sucrose and starch, were determined using enzymatic assay and the contents were expressed as mg cm−2 of leaf area (Gomez et al. 2007).
2.6 Statistical analysis
All statistical analyses were conducted with R software (R Core Team 2020). Two types of comparisons were done for gas exchange and NSC variables. The first aimed at comparing the different treatments on the same day of measurement (DOM), using a linear model with treatments and experimental repetitions as fixed factors (3 repetitions for the sun-to-shade transition and 2 repetitions for the shade-to-sun transition). This analysis was followed by HSD post-hoc test, and differences between treatments in figures and tables are presented with capital letters. The second type of analysis aimed at comparing the differences between days of measurement (DOM) for each treatment separately, on the shade-to-sun transition experiment. In that case, mixed-effect linear models were performed, using the day of measurement and the experimental replicate as fixed effects and the plant (leaf) as a random effect. Post-hoc comparisons were done with the glht function from multcomp library (R Documentation; R Core Team, 2020). Differences between days of measurement for a given treatment are indicated in tables and supplementary tables as lowercase letters. For SPAD and Ψmd, since the effect of the day of measurement was not significant, values of each treatment were averaged either over all the experimental period or separating the period during which plants were under shading (day −1) and sunlight conditions (days 1 to 3 and 10).
To analyse the correlations between variables, data from both sub-experiments was gathered based on (1) the light environments in which leaves were developed and (2) the environmental conditions (shade, sun) during measurements. Four modalities were defined: (1) Sun-Control, (2) Shade-Control measured under shade, (3) Sun-Shade under shade and (4) Sun-Shade during sun re-exposure. The significance of correlations was tested on the entire dataset and each condition separately.
3 RESULTS
3.1 Sun-to-shade transition induced rapid responses of photosynthesis and stomatal conductance
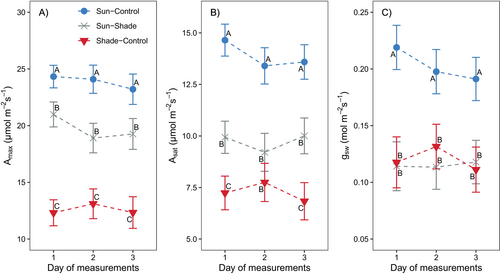
On day 1 (Day Of Measurement - DOM 1) after transferring the plants below the shelter (Sun-Shade), both CO2-saturated (Amax) and light-saturated CO2 assimilation (Asat) as well as stomatal conductance (gsw) were significantly reduced (p < 0.001) compared to control plants remained in sun conditions (Sun-Control). Amax decreased by 14%, Asat decreased by 32% and gsw decreased by 47%, relative to Sun-Control plants (Figure 2). On DOM 2 under shade, Amax in Sun-Shade plants exhibited a greater decrease (21% relative to Sun-Control) with respect to DOM 1 below the shelter, while the reductions in Asat and gsw were maintained. Leaves that developed in full sunlight within Sun-Shade plants showed similar gsw values and higher Asat and Amax values compared to leaves that developed under shading conditions (Shade-Control).
SPAD values were maintained during the experiment period for all treatments and averaged 35.6 ± 0.8 and 35.2 ± 0.7 for Sun-Control and Sun-Shade, respectively, while Shade-Control showed a significantly lower SPAD of 30.8 ± 0.7 (p < 0.001).
3.2 Shading duration differentially affected photosynthesis and stomatal conductance upon re-exposure to sun conditions
At the end of the shading period (DOM −1), Amax was significantly reduced in leaves that developed under sun conditions and were subjected to shading (Sun-Shade-1, Sun-Shade-10, Sun-Shade-21), compared to Sun-Control leaves (Figure 3, treatment p < 0.001, Table S1). Remarkably, the longer the plants were shaded, the greater the reduction in Amax, with approximately 19%, 28% and 60% reductions for Sun-Shade-1, Sun-Shade-10 and Sun-Shade-21 treatments, respectively, compared to Sun-Control. On the other hand, no significant difference in Asat was observed depending on the duration of shading (DOM −1), averaging 60% of Sun-Control plants (Figure 4, treatment p < 0.001, Table S1).
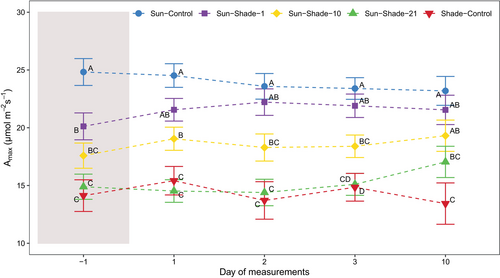
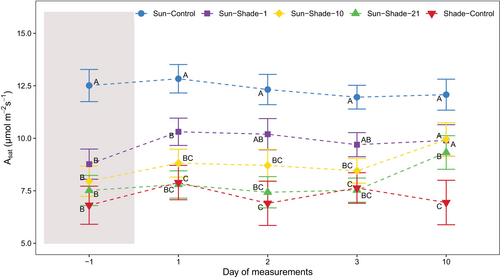
Upon sun re-exposure of shaded plants, Amax gradually increased in Sun-Shade-10 and Sun-Shade-21 (Figure 3). On DOM 10, Amax for Sun-Shade-10 reached 80% of Sun-Control values, whereas for Sun-Shade-21 Amax reached only 60% of Sun-Control plant values. Sun-Shade-1 plants did not differ statistically from Sun-Control during sun re-exposure at any day of measurement and averaged an Amax of 21.5 ± 0.5 μmol m−2 s−1. Additionally, Asat increased progressively after sun re-exposure of shaded plants (Figure 4). On DOM 10, Asat reached 81% of Sun-Control values in Sun-Shade-1 and Sun-Shade-10 and 76% in Sun-Shade-21, which were not significantly different from Sun-Control (Table S1).
On the other hand, on DOM −1, Amax and Asat of the Shade-Control plants averaged 14.1 ± 0.8 and 6.9 ± 0.4 μmol m−2 s−1, respectively, and were significantly lower than those of Sun-Control plants. There was no increase in either Amax or Asat upon sun re-exposure.
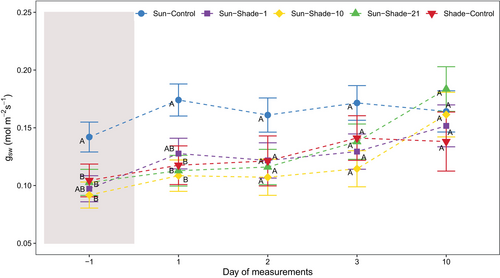
Still under the shelter (on DOM −1), stomatal conductance (gsw) of shaded plants was significantly reduced for all the shading durations (Figure 5, treatment p = 0.004, Table S1). Upon sun re-exposure, gsw gradually increased, reaching 60–70% of Sun-Control values on DOM 2. Then, gsw continued to increase, reaching values not significantly different from Sun-Control plants after 10 days of sun re-exposure in any shaded treatment (DOM 10; treatment p = 0.6012). In Shade-Control plants, gsw did not differ statistically from Sun-Control after DOM 2 and averaged at 0.125 ± 0.01 mmol m−2 s−1.
Before leaving the shading condition (DOM −1), intrinsic leaf water use efficiency (iWUE) of Sun-Shade-1, Sun-Shade-10 and Sun-Shade-21 plants did not significantly differ from Sun-Control (Figure S3, treatment p = 0.0920, Table S1). Following sun exposure, iWUE did not show significant changes for these treatments until DOM 3. On DOM 10, iWUE was significantly lower in the Sun-Shade-21 plants compared to Sun-control, and also to their own values under the shelter for Sun-Shade-1 and Sun-Shade-10 plants (Table S1). The iWUE of Shade-Control leaves did not differ from Sun-Control under shade either at DOM 10.
3.3 Differential effects of light conditions during leaf expansion and shading duration on shoot biomass, leaf water potential, chlorophyll index and specific leaf area
At the end of the shading period, Sun-Shade-10, Sun-Shade-21 and Shade-Control treatments showed a significantly lower shoot biomass production (Table 1) relative to Sun-Control.
| Treatment | Ψmd (MPa) | |||||||||
|---|---|---|---|---|---|---|---|---|---|---|
| Shoot biomass (g)* | Day − 1 | Days 1–3 and 10 | SPAD | SLA (cm2 g−1) | ||||||
| Sun-Control | 1.26 ± 0.09 | A | −0.74 ± 0.07 | C | −0.50 ± 0.02 | A | 35.9 ± 0.6 | A | 183.1 ± 9.5 | B |
| Sun-Shade-1 | - | −0.44 ± 0.04 | AB | −0.44 ± 0.02 | A | 36.6 ± 0.6 | A | 171.7 ± 9.7 | B | |
| Sun-Shade-10 | 0.63 ± 0.10 | B | −0.45 ± 0.07 | A | −0.46 ± 0.02 | A | 37.6 ± 0.6 | A | 176.7 ± 10.3 | B |
| Sun-Shade-21 | 0.92 ± 0.08 | B | −0.51 ± 0.07 | AB | −0.43 ± 0.00 | A | 37.1 ± 0.6 | A | 186.9 ± 10.3 | B |
| Shade-Control | 0.81 ± 0.09 | B | −0.41 ± 0.04 | BC | −0.60 ± 0.03 | B | 29.7 ± 0.8 | B | 233.2 ± 13.6 | A |
| Treatment p | 0.0000 | 0.0000 | 0.0000 | 0.0000 | 0.0135 | |||||
- * Shoot biomass is relative to 10 days for Sun-Shade−10 and to 21 days for Sun-Shade-21, Sun-Control and Shade-Control.
Under the shelter (DOM −1), midday leaf water potential (Ψmd) was significantly higher in Sun-Shade-1, Sun-Shade-10, Sun-Shade-21 treatments compared to Sun-Control (Table 1). Upon sun re-exposure, Ψmd of Sun-Shade plants decreased to the level of Sun-Control plants. Under the shelter, Ψmd in the Shade-Control plants was not significantly different from the Sun-Control; however, during sun re-exposure Ψmd decreased and was significantly lower compared to the other treatments.
SPAD values did not change significantly for the leaves in any treatment throughout the experiment. Therefore, to analyse the treatment effect, SPAD values were averaged across all the days of measurements. Compared to Sun-Control, SPAD values were not significantly different for leaves in Sun-Shade-1, Sun-Shade-10 and Sun-Shade-21 treatments (Table 1). Conversely, leaves of Shade-Control plants had significantly lower SPAD values.
Specific leaf area (SLA) at the end of the experiment was similar between Sun-Control and Sun-Shade treatments (Table 1) while Shade-Control leaves showed a higher SLA.
3.4 Light exposure during leaf expansion and shading duration affects leaf non-structural carbohydrate content
Under the shelter, hexose content in leaves tended to be higher in shaded treatments but was not statistically different from Sun-Control (Table 2). Upon sun re-exposure, hexose content slightly increased in the long shading treatments (Sun-Shade-10 and Sun-Shade-21), becoming significantly higher than for Sun-Control plants from DOM 1–3 for Sun-Shade-21 and on DOM 10 for Sun-Shade-10. However, hexose content for Sun-Shade-1 and for Shade-Control plants did not differ from Sun-Control plants after the transition to sun conditions.
| Treatment | Day of measurement | Day p | ||||||||
|---|---|---|---|---|---|---|---|---|---|---|
| -1 | 1–3 | 10 | ||||||||
| Hexose (mg cm−2) | ||||||||||
| Sun-Control | 0.056 ± 0.016 | AB | a | 0.051 ± 0.007 | B | a | 0.047 ± 0.015 | B | a | 0.3003 |
| Sun-Shade-1 | 0.038 ± 0.022 | AB | ab | 0.058 ± 0.007 | B | a | 0.041 ± 0.009 | B | b | 0.0023 |
| Sun-Shade-10 | 0.068 ± 0.014 | AB | a | 0.067 ± 0.007 | B | a | 0.076 ± 0.009 | A | a | 0.6587 |
| Sun-Shade-21 | 0.101 ± 0.014 | A | a | 0.106 ± 0.007 | A | a | 0.086 ± 0.009 | A | a | 0.1002 |
| Shade-Control | 0.032 ± 0.021 | B | a | 0.035 ± 0.009 | B | b | 0.031 ± 0.012 | B | b | 0.0031 |
| Treatment p | 0.0139 | 0.0000 | 0.0006 | |||||||
| Sucrose (mg cm−2) | ||||||||||
| Sun-Control | 0.311 ± 0.027 | A | b | 0.256 ± 0.021 | AB | b | 0.323 ± 0.056 | A | a | 0.0000 |
| Sun-Shade-1 | 0.289 ± 0.039 | A | b | 0.318 ± 0.019 | A | b | 0.354 ± 0.035 | A | a | 0.0117 |
| Sun-Shade-10 | 0.287 ± 0.024 | A | a | 0.292 ± 0.019 | A | a | 0.338 ± 0.038 | A | a | 0.0801 |
| Sun-Shade-21 | 0.294 ± 0.022 | A | a | 0.301 ± 0.019 | A | a | 0.343 ± 0.038 | A | a | 0.0744 |
| Shade-Control | 0.194 ± 0.034 | B | b | 0.204 ± 0.024 | B | b | 0.276 ± 0.047 | A | a | 0.0017 |
| Treatment p | 0.0000 | 0.0039 | 0.7160 | |||||||
| Starch (mg cm−2) | ||||||||||
| Sun-Control | 0.193 ± 0.062 | A | a | 0.121 ± 0.044 | B | a | 0.192 ± 0.095 | A | a | 0.1234 |
| Sun-Shade-1 | 0.246 ± 0.083 | A | a | 0.261 ± 0.041 | AB | a | 0.167 ± 0.059 | A | a | 0.1327 |
| Sun-Shade-10 | 0.104 ± 0.052 | A | a | 0.199 ± 0.041 | AB | a | 0.198 ± 0.065 | A | a | 0.0594 |
| Sun-Shade-21 | 0.171 ± 0.052 | A | b | 0.296 ± 0.041 | A | a | 0.369 ± 0.064 | A | a | 0.0019 |
| Shade-Control | 0.217 ± 0.079 | A | a | 0.168 ± 0.051 | B | a | 0.124 ± 0.081 | A | a | 0.7045 |
| Treatment p | 0.3936 | 0.0009 | 0.0585 | |||||||
Sucrose content did not differ significantly between Sun-Control and the Sun-Shade treatments (Sun-Shade-1, 10 or 21; Table 2) under the shelter or after sun re-exposure. For Shade-Control plants, sucrose content was significantly lower under the shelter, but increased to similar values as the other treatments on DOM 10 of sun re-exposure.
Under the shelter, starch content was not significantly different between the leaves of Sun-Control and all the other treatments, including the Shade-Control. After sun re-exposure, starch content increased significantly in Sun-Shade-21 leaves, reaching twice the amount observed under the shelter after 10 days of sun re-exposure, while starch content in Sun-Shade-1, Sun-Shade 10 and Shade-Control, remained similar to Sun-Control.
3.5 Shade acclimation affects the correlations between leaf photosynthesis, stomatal conductance and NSC contents
To assess correlations between variables, data from sub-experiments 1 and 2 were aggregated based on the light environments in which leaves were developed and the environmental conditions (shade, sun) during measurements. Four modalities were defined: (1) Sun-Control, (2) Shade-Control measured under shade, (3) Sun-Shade under shade and (4) Sun-Shade during sun re-exposure.
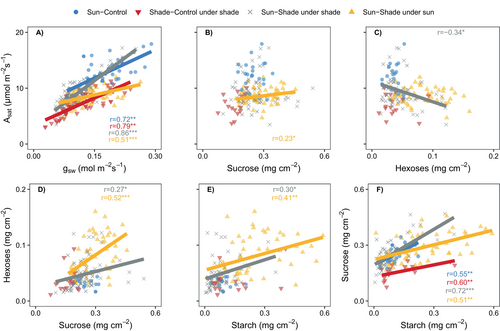
Significant correlations between several variables were observed when pooling data from all the modalities, and when considering each modality separately (Figure 6 and Table S2). First, Asat showed a positive correlation with gsw, both when all the modalities were pooled (r > 0.7) or when the modalities (Sun-Control, Shade-Control under shade, Sun-Shade under shade, Sun-Shade under sun; r > 0.5) were considered separately. Sun-Control and Shade-Control under shade exhibited similar correlation slopes, whereas Sun-Shade under shade displayed a steeper slope (Figure 6A, Table S2), indicating higher iWUE. Conversely, under sun, Sun-Shade showed a lower slope, suggesting a lower iWUE. Asat was positively correlated with sucrose content in the Sun-Shade treatments under sun modality (Figure 6B) and negatively correlated to hexose content under shade (Figure 6C). However, Asat did not correlate with starch content in leaves across all the modalities (Table S2). Hexose content correlated positively with sucrose (Figure 6D) and starch contents (Figure 6E) in Sun-Shade under both shade and sun. Lastly, sucrose and starch contents showed positive correlation across all the modalities (Figure 6F).
4 DISCUSSION
4.1 Shading, shading duration and sun re-exposure induced different responses in photosynthesis and stomatal conductance
Leaves developed under sun condition quickly acclimate to shade, but the re-acclimation to sunlight conditions was longer and dependent on the duration of the shading period. Upon the transition from sun to shade, sun-developed leaves exhibited a decrease in CO2 and light-saturated assimilation rates (Amax, Asat) and stomatal conductance (gsw) from the first day under shade (Figure 2). Despite maintaining light-saturated conditions in the leaf gas exchange chamber, a global effect of shading on the entire plant was observed (Ngao et al. 2021). The slower relaxation of photoprotective mechanisms, such as non-photochemical quenching associated with carotenoid de-epoxidation, that are active under full sunlight, could explain the reduced photosynthesis during the transition from high to low light (Kromdijk et al. 2016). The day before transferring shaded plants to sunlight conditions, reductions in Asat and gsw were independent of the shading period (Figures 4 and 5), while longer shading periods resulted in a greater reduction in Amax (Figure 3). This reduction in photosynthesis after prolonged shading periods is often linked to decreased nitrogen allocation in the photosynthetic apparatus (Frak et al. 2001; Niinemets 2007). However, SPAD index values were similar between the shaded and the sun control leaves, indicative of similar N content (Ates and Kaya 2021).
Once the shaded plants were transferred to sun conditions, gsw recovered faster and more completely than Asat, leading to a decrease in iWUE during the sun re-exposure (Figure 6A). Furthermore, the duration of shading influenced the speed of recovery of Asat and Amax, with shorter shading periods showing faster and more complete recovery. The lack of total recovery of photosynthesis in the longer shading treatment was not due to stomatal limitations, as indicated by the gsw values (Figure 5). Similar values of midday leaf water potential (Ψmd) for the shaded plants re-exposed to sun, compared to Sun-Control plants, also exclude a potential limitation due to hydraulic constraints (Medrano et al. 2002; Williams et al. 2012).
The lack of increase in photosynthesis in shaded leaves after 1 to 3 days of sun exposure could be related to photoinhibition, causing a temporary loss of photosynthetic activity, as observed in grapevines (Bertamini et al. 2004). However, we suggest that the hindrance to complete photosynthetic recovery observed in the shaded treatments, even after long-term sun re-exposure, was related to the maintenance of NSC observed in the leaves. Under saturating light and CO2, a photosynthetic limitation can occur if there is insufficient inorganic phosphate recycling, when NSC are not exported via phloem (Stitt 1986; Quereix et al. 2001; Holzapfel et al. 2010). This could further explain the greater limitation in Amax than in Asat after 10 days of sun re-exposure, since phosphate recycling limitations become more relevant at high CO2 (Sharkey 1985; Bernacchi et al. 2009).
4.2 Down-regulation of photosynthesis under shade and after sun re-exposure was associated with maintenance of non-structural carbohydrates in leaves
Sun-developed leaves below the shelter did not show significant changes in their NSC contents, whatever the shading duration, despite a lower photosynthesis rate compared to sun plants (Table 2). This outcome may seem surprising, as a decrease in NSC contents should typically be expected due to reduced CO2 assimilation under shade (Alon et al. 2022). Similar to the results presented in this study, Frak et al. (2001) observed in hybrid walnut trees that shading decreased photosynthetic capacity without affecting starch concentrations in sun-developed leaves. They attributed this to a decreased carbon demand for shaded leaves due to lower respiration rates.
In grapevine, adjustment in C sink demand is linked with the plasticity of secondary axis development, which displays a lower growth under shading, thus decreasing the overall sink demand (Lebon et al. 2004; Pallas et al. 2008; Greer and Weedon 2012; Pallas and Christophe 2015). It is well documented that once secondary axes stop growing, they are unable to resume (Lebon et al. 2004; Louarn et al. 2007). In our study, at the end of the longest shading periods (Sun-Shade-10, Sun-Shade-21 and Shade-Control), the plants invested less C in new secondary axes and in the ones maintained in the plants at nodes 9, 10, 13 and 14 (Table 1). This reduction in carbon sink demand should limit the export of carbohydrates from the leaves, thereby down-regulating photosynthesis (Frak et al. 2001).
Additionally, the limited recovery of photosynthesis under sun conditions was likely related to the maintenance of NSC in leaves (Table 2). A transitory increase in hexoses and starch was even observed between 1 to 3 and 10 days after sun re-exposure in long shading treatments. The direct relationship between sucrose, hexoses and starch observed in sun re-exposed leaves (Figure 6D-F) sustained the hypothesis of reduced soluble sugar demand for growth at the plant scale, favouring starch accumulation in leaves. However, it is worth noting our experiment was conducted on de-fruited plants. If fruits were present, they could serve as active sinks potentially importing large amounts amount of photo-assimilates produced by the leaves.
4.3 Shade-developed leaves are not able to acclimate to sun conditions
Shade-developed leaves exhibited lower Amax, Asat and gsw below the shelter when compared to control plants in sun conditions. Even after 10 days of sun exposure, these leaves did not show an increase in photosynthesis relative to their values below the shelter (Figures 3, 4 and 5; Table S1). This suggests that the morphological acclimation fixed the anatomical features of shade leaves and constrained their ability to dynamically acclimate by means of other biochemical or physiological mechanisms under full sunlight (Athanasiou et al. 2009; Morales and Kaiser 2020; Dayer et al. 2021; Sales et al. 2023). Shade acclimation resulted in thinner and larger leaves, reducing the volume of photosynthetic tissue per leaf area, thereby limiting photosynthesis even under sunlight conditions (González et al. 2021). Conversely, some tree species, such as Juglans nigra x regia (Frak et al. 2001) and Acer pseudoplatanus (Wyka et al. 2022), have shown increases in leaf thickness and partial enhancement of photosynthetic capacity following acclimation to the new light environment. Given our evaluation after 10 days of sun re-exposure, it remains possible that a further increase in SLA could occur latter, as reported in grapevines undergoing seasonal changes in response to different light exposures, even after full leaf expansion (Greer and Weedon 2012). Shade-developed leaves (Shade-Control) also exhibited a significant decrease in leaf water potential (Table 1) upon the transfer to sun conditions, suggesting potential water transport constraints. This limitation may arise from reduced hydraulic conductance in internodes, petioles and lamina as well as a decrease in xylem conduit number, as observed in shade-developed grapevine shoots (Schultz and Matthews 1993). Below the shelter, Shade-Control leaves had lower hexose and sucrose content compared to sun-control leaves, consistent with findings by Dayer et al. (2021) in grapevine with shade-developed leaves. Upon transfer to sun conditions, an increase in hexose and sucrose was found, while starch content remained stable. This could reflect an osmotic response, indicating the crucial role of soluble sugars in maintaining leaf turgor and thus water status at the expense of starch synthesis (Chaves et al. 2003; Gersony et al. 2020).
5 CONCLUSION
Previous studies have investigated the impact of shading on leaf morphology and physiology, but few have examined how shade acclimation over varying periods affects leaf and plant functioning when plants were re-exposed to sun conditions. Our study showed that shade acclimation occurred quickly. However, readjusting to sunlight conditions could be longer and dependent on the duration of the shading period. Notably, leaves developed under shade did not acclimate to sunlight, suggesting that morphological changes during leaf expansion were irreversible and have long-term effects on leaf physiology. This study provides new insights into the disadvantages of shade acclimation when leaves were then exposed to sunlight, a phenomenon observed in natural ecosystems (e.g., modification of the canopy structure of the highest trees in forest area) or for typical (e.g., pruning or leaf removal, shoot thinning or shoot positioning) and innovative (agrivoltaics) viticultural practices.
AUTHOR CONTRIBUTIONS
AEG, TS, AC, BP: devised the study and designed the experiments; AEG, MP, RB: performed the plant measurements; GR: performed the biochemical analyses; AEG and BP explored the data and made the statistical analyses; AEG and BP wrote the manuscript including the revisions of TS, JAP, MP and AC. All the authors read and approved the manuscript.
ACKNOWLEDGMENTS
We would like to thank all the members of the ETAP team of UMR LEPSE for their help in experiments and the technicians of l'Institut Agro-Montpellier for managing and maintaining the experimental vineyards.
FUNDING INFORMATION
AEG received financial support from the Excellence Eiffel scholarship program of Campus France Agency.
Open Research
DATA AVAILABILITY STATEMENT
The data that support the findings of this study are available from the corresponding author upon reasonable request.


