Genome-wide characterization of trihelix genes reveals Cqtrihelix23 enhances the salt tolerance in quinoa (Chenopodium quinoa)
Abstract
Soil salinity poses an escalating threat to global environmental sustainability, agricultural productivity, and food safety. Quinoa (Chenopodium quinoa), recognized as a halophyte, has emerged as a promising crop due to its high nutritional value and stress resistance. Nevertheless, the current understanding of salt tolerance genes in quinoa remains incomplete. This comprehensive study aimed to identify the quinoa trihelix family and families associated with salt stress, including Na+/H+ antiporter (NHX) and calcineurin B-like (CBL). Through expression analysis, Cqtrihelix23 was identified as responsive to salt stress. Subsequent transient transformation experiments revealed that Cqtrihelix23 enhanced quinoa's tolerance to salt stress by promoting root development, maintaining the antioxidant system, and reducing the Na+/K+ ratio. Additionally, it was discovered that Cqtrihelix23 upregulated the expression of CqCBL10 and CqNHX4. Further protein interaction experiments confirmed the interaction between Cqtrihelix23, CqCBL10, and CqNHX4. Notably, CqCBL10 and CqNHX4 also contributed to salt stress resistance, and in combination with Cqtrihelix23, they synergistically enhanced salt stress tolerance. In conclusion, this study highlights the significance of Cqtrihelix23, CqCBL10, and CqNHX4 as key contributors within the regulatory network associated with quinoa's salt tolerance. These findings lay a solid groundwork for the development of salt-tolerant quinoa varieties.
1 INTRODUCTION
Sustainable agricultural production is facing threats from environmental pollution, soil salinity, climate change, and limited land resources. Soil salinity, in particular, has significantly impacted ecological sustainability, agricultural productivity, and food safety (Yang and Guo, 2017). The global farmland affected by salt is increasing every year, currently covering 20% of the total due to factors such as excessive fertilization, improper irrigation, intensive farming, or natural causes (Kamran et al., 2019; Ruan et al., 2010; Shabala, 2013). High salt concentrations in the soil disrupt root water absorption and hinder plant growth and development (Habib et al., 2016). Moreover, salinity induces an imbalance in sodium (Na+) and chloride (Cl−) ions, leading to ion toxicity and nutrient imbalances (Cramer et al., 1987). Osmotic and ionic stresses provoke the accumulation of reactive oxygen species (ROS) in plants. Excessive ROS damages the cell membrane and disrupts intracellular homeostasis, resulting in metabolic disorders and potentially accelerating plant senescence and cell death (Habib et al., 2016).
Most crops are glycophytes, and their development is significantly impeded by high salinity, resulting in reduced crop yield and posing a threat to food security (Slama et al., 2015). Plants must invoke appropriate mechanisms to cope with salt stress in their surroundings. Consequently, exploring plant gene regulatory networks becomes essential for comprehending their adaptive responses to stressors (Waqas et al., 2023). Complex plant salt tolerance traits are collectively regulated by numerous genes or pathways (Zelm et al., 2020), where sensing and signaling play crucial roles in this regulatory network (Yang and Guo, 2018). Perception of high extracellular concentrations of Na+ and osmotic pressure by membrane receptors/sensors triggers the activation of salt stress response protein kinases and transcription factors (TFs), ultimately leading to regulated gene expression (Jiang et al., 2019; Zhao et al., 2020).
Among the intricate regulatory networks, TFs have emerged as key regulators. Various TF families, such as AP2/ERF (Lu et al., 2021), WRKY (Bo et al., 2020), bZIP (Yang et al., 2020), NAC (Li et al., 2021a), and MYB (Li et al., 2019), have been reported to promote plant salt stress tolerance by regulating signal transduction and gene expression. In addition to extensively studied TF families, recent research has highlighted the significant role of the trihelix family in plant resistance to salt stress (Xu et al., 2018). Trihelices, also known as GT factors, can be categorized into five subfamilies based on structural disparities (Kaplan-Levy et al., 2012). Each subfamily exhibits a conserved N-terminal structure and a distinct C-terminal structure. Multiple studies have demonstrated the crucial involvement of trihelices in salt stress resistance. For instance, a trihelix family member, GhGT26, enhances salt stress tolerance in Arabidopsis thaliana (Li et al., 2022); overexpression of the trihelix gene BnSIP1-1 in Brassica napus significantly enhances salt resistance (Luo et al., 2017); OsGTγ-2, when overexpressed or knocked out in rice, acts as an important positive regulator in rice's response to salt stress (Liu et al., 2020); overexpression of trihelix gene GT2L in Arabidopsis thaliana facilitates tolerance to salt stress (Xi et al., 2012). Furthermore, a novel trihelix gene named SlGT-26 has been identified in tomatoes, and it has been observed that SlGT-26-RNAi tomato plants exhibit lower lipid peroxidation damage under salt and drought stresses compared to wild-type tomato plants (Li et al., 2023). Despite the pivotal role of trihelix genes in plant salt stress tolerance, research on their function in quinoa remains limited.
Chenopodium quinoa (quinoa) is a highly nutritious grain that holds significant potential in improving global food security. Notably, quinoa grain is gluten-free and boasts essential amino acids, vitamins, minerals, and omega-3 fatty acids (Bastidas et al., 2016). With the availability of the quinoa genome, numerous studies have focused on identifying candidate genes that enhance crucial processes such as quinoa yield, seed germination, and circadian rhythm (Wu et al., 2023a; Wu et al., 2023b; Wu et al., 2020). Being a halophyte, quinoa exhibits remarkable adaptability to challenging climatic conditions, rendering it an exceptional crop. Consequently, multiple investigations have been conducted to explore salt tolerance in diverse quinoa lines, aiming to identify suitable germplasms for cultivation on salt-affected soil (Iqbal et al., 2017; Razzaghi et al., 2011). Waqas et al. found that soil drenching with paclobutrazol enhanced antioxidant capacity, regulated ion homeostasis, and increased grain yield, thereby improving quinoa performance under salt stress (Waqas et al., 2019). Furthermore, reports suggest that salt stress may alleviate drought damage in quinoa by facilitating the absorption of inorganic solutes for osmotic regulation. Additionally, exogenous application of H2O2 has been found to enhance quinoa's tolerance to both drought and salt stress (Iqbal et al., 2023). It has also been observed that moderate salt stress can stimulate quinoa growth, although the combined treatment of potassium deficiency and salt stress has been shown to significantly reduce stomatal density, stomatal aperture, and biomass (Waqas et al., 2021). Moreover, Shi et al. identified core salt-sensitive genes, such as MYB and WRKY, by analyzing salt-tolerant and salt-sensitive quinoa varieties through RNA-seq analysis (Shi and Gu, 2020). While salt tolerance in quinoa has become a research focus, the current emphasis primarily lies in agronomic traits and physiological responses, with limited exploration of the molecular mechanisms underlying quinoa's response to salt stress. Hence, the identification of salt-tolerant genes assumes vital importance in breeding salt-resistant crops (Peng et al., 2014). Although genes and signaling pathways associated with salt stress have been extensively investigated in various plants (Dong et al., 2021; Li et al., 2021b; Wang et al., 2021), the identification of key genes responsible for salt tolerance in quinoa has received relatively little attention.
To enhance the availability of salt stress-related gene resources in quinoa, the Cqtrihelix and salt stress-related gene families (CqCBL and CqNHX) were identified from the quinoa genome. Through quantitative fluorescence PCR (RT-qPCR) experiments, we observed a significant induction of Cqtrihelix23 expression under salt stress conditions. Intriguingly, transient overexpression of Cqtrihelix23 during salt treatment resulted in decreased oxidative damage, enhanced antioxidant capacity, and a reduced Na+/K+ ratio. Additionally, salt treatment stimulated the expression of CqCBL10 and CqNHX4, and transient overexpression of Cqtrihelix23 led to an upregulation of transcript levels for both CqCBL10 and CqNHX4. Our study employed physiological, biochemical, and molecular biology techniques to investigate the mechanisms through which Cqtrihelix23, CqCBL10, and CqNHX4 genes improve quinoa's salt tolerance. These findings collectively suggest that Cqtrihelix23 may confer salt stress resistance by synergistically interacting with CqCBL10 and CqNHX4. The identification of these salt-responsive genes lays a solid foundation for enhancing the stress-resistant qualities of crops.
2 MATERIALS AND METHODS
2.1 Plant materials and cultivation
The plant culture chamber was maintained at 25°C with a light cycle of 16 h of light followed by 8 h of darkness. Both tobacco plants and a quinoa variety (Qingbaili 1) were cultivated in the plant culture chamber. Qingbaili 1 is characterized by strong growth, a compact plant shape, good seed setting, and plump seeds, making it an excellent choice for this experiment. To prepare the quinoa seeds, they were thoroughly washed to remove impurities and floating seeds and then soaked for 1 h. Subsequently, the seeds were placed on filter paper in a dark environment to promote germination. The germinated quinoa was grown under light conditions and carefully maintained with adequate hydration. After three days of light cultivation, the quinoa seedlings that had developed cotyledons were transferred to the Hoagland solution. In accordance with the BBCH scale, the NaCl treatment experiment was conducted when the quinoa plants displayed three visible pairs of leaves (BBCH-13) (Sosa-Zuniga et al., 2017). The evenly growing quinoa seedlings were planted in hydroponic boxes, each containing 800 mL of Hoagland solution with varying concentrations of NaCl (0, 50, 100, 150, or 200 mM). Fifteen quinoa seedlings were allocated to each treatment. The Hoagland solution was replenished every two days, with the corresponding concentrations of NaCl added. After 7 days of NaCl treatment, the root length and fresh weight of the quinoa seedlings were measured for each treatment group. All measurements were performed with at least three biological replicates.
2.2 Identification of the Cqtrihelix, CqNHX and CqCBL gene families
The genome of quinoa (Cq_PI614886_gene_V1) was obtained from ChenopodiumDB (http://www.cbrc.kaust.edu.sa/chenopodiumdb/). The amino acid sequences (AASs) of Attrihelices, AtNHXs, and AtCBLs were sourced from the TAIR database. The Attrihelices AASs and the quinoa genome were fed into the blast Guiwrapper program in TBtools (Chen et al., 2020), resulting in preliminary identification of potential Cqtrihelix gene IDs in quinoa. Similarly, the Cqtrihelix gene IDs and the quinoa genome's AASs were utilized in the fasta extract program in TBtools (Chen et al., 2020) to obtain the AASs of the potential Cqtrihelix genes. The same method was applied to obtain the potential AASs of CqNHX and CqCBL genes. Subsequently, the AASs of Cqtrihelix, CqNHX, and CqCBL genes were subjected to BLASTP analysis in NCBI. We obtained the hidden Markov model (HMM) file containing the conserved domains of these genes, specifically trihelix [Myb/SANT-LIKE domain (PF13837)], NHX [Na+/H+ Exchanger domain (PF00999)], and CBL [EF-hand calcium-binding domains (PS50222)]. Furthermore, the Web CD-Search Tool of NCBI was employed to detect the conserved domains of the identified Cqtrihelix, CqNHX, and CqCBL genes. Genes that did not belong to the target gene family were filtered out based on conserved domain analysis and BLASTP.
2.3 Maximum likelihood trees construction of Cqtrihelix, CqNHX and CqCBL genes
The AASs of the trihelix, NHX, and CBL genes in both A. thaliana and quinoa were aligned using MUSCLE (Edgar, 2004) to identify the most suitable models. The LG model emerged as the most appropriate model for the trihelix, NHX, and CBL genes in both plants. As for the Cqtrihelix, CqNHX, and CqCBL genes, the WAG model was determined to be the most appropriate. Using MEGA 7 (Kumar et al., 2016), maximum likelihood (ML) trees were constructed for these genes utilizing their respective most appropriate models.
2.4 Structural analysis of Cqtrihelix, CqNHX, and CqCBL genes
The CD-Search online website (Marchler-Bauer and Bryant, 2004) was employed to analyze the conserved domains of the Cqtrihelix, CqNHX, and CqCBL genes. Furthermore, the motif compositions of these genes were identified using the MEME online website (Bailey et al., 2009). To visualize the gene structures of the Cqtrihelix, CqNHX, and CqCBL genes, the gene structure view program (Chen et al., 2020) was utilized.
2.5 Localization and gene expansion of Cqtrihelix, CqNHX and CqCBL genes
The genome sequence and GFF files were utilized to determine the localization of the Cqtrihelix, CqNHX, and CqCBL genes. The MCScanX toolkit (Wang et al., 2012) was employed to detect duplication events within the Cqtrihelix, CqNHX, and CqCBL gene families. For visualization of chromosomal localization and tandem duplication, the GTF/GFF program in TBtools was utilized, while the advanced circos program (Chen et al., 2020) was employed to visualize segmental duplications.
2.6 Homology analysis of Cqtrihelix, CqNHX and CqCBL genes
The analysis of syntenic genes within the Cqtrihelix, CqNHX, and CqCBL families was performed using BLAST and MCScanX. To visualize the syntenic gene pairs between the Cqtrihelix, CqNHX, and CqCBL genes and the trihelix, NHX, and CBL genes in dicots (A. thaliana, Beta vulgaris, Fagopyrum tataricum, and Glycine max) and monocots (Oryza sativa), the multiple synteny plot program was employed (Chen et al., 2020).
2.7 Expression of Cqtrihelix, CqNHX and CqCBL genes
Quinoa plants were subjected to a treatment of 100 mM NaCl. Total RNA was extracted from the roots and leaves of the NaCl-treated quinoa plants after 7 days using the plant total RNA isolation kit (Vazyme, Nanjing, China). The extracted RNA was then converted into cDNA using the HiScript III RT SuperMix Kit. RT-qPCR experiments were conducted using the Archimed X4 instrument. Primers for the Cqtrihelices, CqNHXs, and CqCBLs were designed using Primer 3 (Table S13). The elongation factor 1α gene was used as the internal reference gene (Ruiz Carrasco et al., 2011). The 2−(ΔΔCt) was employed for calculating the expression level (Kenneth and Thomas, 2002).
2.8 Transient overexpression of Cqtrihelix23, CqCBL10 or CqNHX4 in quinoa
The transient transformation experiments followed established methods as described previously (Wei et al., 2018; Xiao et al., 2022; Yang et al., 2000). The CDSs of Cqtrihelix23, CqCBL10, and CqNHX4 were inserted into the pCAMBIA1300-YFP vector, resulting in pCAMBIA1300-Cqtrihelix23-YFP, pCAMBIA1300-CqCBL10-YFP, and pCAMBIA1300-CqNHX4-YFP constructs. These constructs were introduced into Agrobacterium GV3101. The agrobacterium was prepared by suspending it in MES-KOH, MgCl2, and acetosyringone to a final OD600 value of 1. Equal proportions of the suspensions containing pCAMBIA1300-Cqtrihelix23-YFP and pCAMBIA1300-CqCBL10-YFP were mixed together, and the same was done for the suspensions containing pCAMBIA1300-Cqtrihelix23-YFP and pCAMBIA1300-CqNHX4-YFP. These mixed suspensions were then injected into the leaves and soaked in roots of quinoa plants. The treated plants were subjected to alternating light and dark conditions for one day each and were re-treated every four days. Successful transient overexpression in plants was determined using laser confocal fluorescence imaging and by measuring the expression of Cqtrihelix23, CqCBL10, and CqNHX4. The plants showing successful transient overexpression were selected for subsequent experiments. Two weeks later, indicators were measured using quinoa plants from different treatment groups.
2.9 Subcellular localization
Prepared suspensions containing the recombinant plasmid pCAMBIA1300-Cqtrihelix23-YFP and a nuclear localization marker were used, following the method described earlier. As a negative control, suspensions containing pCAMBIA1300-YFP and the nuclear localization marker were mixed in equal proportions. These suspensions were then injected into tobacco leaves. After transient transformation, the tobacco plants were cultured for one day each under light and dark conditions. The subcellular localization of Cqtrihelix23 was assessed using laser confocal microscopy.
2.10 Transactivation activity analysis of Cqtrihelix23
The transcriptional activation experiment was performed with modifications based on a previous study (Jiang et al., 2021). The CDS of Cqtrihelix23 was cloned into the pGBKT7 vector, and the resulting construct, pGBKT7-Cqtrihelix23, was introduced into the AH109 yeast strain. The pGBKT7 empty vector and pGBKT7-53 served as negative and positive controls, respectively. The transformed yeast cells were cultured on SD/−Trp medium for 2–3 days, and single colonies showing growth were selected and grown in a liquid medium until turbidity was achieved. The yeast solution was then resuspended in 0.9% NaCl to reach an OD600 of 0.6–0.8, ensuring uniformity across all yeast solutions. These resuspended yeast solutions were streaked onto SD/−Trp and SD/−Trp/-His solid media, followed by incubation at 30°C for 2–3 days. Transcriptional activation activity was assessed by monitoring yeast cell growth and conducting a galactosidase filter lift assay.
2.11 Detection of the photosynthetic capacity
Fresh leaves were harvested from each treatment group and extracted in darkness using a mixture of 4.5 parts ethanol, 4.5 parts acetone, and 1 part distilled water. The absorption peaks of chlorophyll a, chlorophyll b, and carotenoids were measured at wavelengths of 663, 645, and 470 nm, respectively. This experiment was repeated three times using independent biological replicates.
2.12 Lipid peroxidation detection and root staining analysis
Two grams of roots and leaves from each experimental group were finely ground with 18 mL of phosphate buffer. The resulting samples were then subjected to centrifugation at 7,155 g for 10 min. The concentration of malondialdehyde (MDA), hydrogen peroxide (H2O2), and superoxide radical (O2•−) in the samples was determined at wavelengths of 530, 405, and 550 nm, respectively, utilizing the related kits (Nanjing Jiancheng Bioengineering Institute). Additionally, the distribution of MDA, H2O2, and O2•− in quinoa roots was investigated using the Schiff reagent, diaminobenzidine (DAB), and nitroblue tetrazolium (NBT) reagents.
2.13 Analysis of enzyme activity and antioxidant compound
Leaf and root tissues weighing two grams each from each treatment group were ground and then extracted using 18 mL of phosphate buffer. The resulting extract was subjected to centrifugation at 1,370 g for 10 min. Subsequently, the enzyme activities of superoxide dismutase (SOD), peroxidase (POD), catalase (CAT), and ascorbate peroxidase (APX) were measured in the supernatants of different treatment groups. The measurements were conducted at wavelengths of 550, 420, 405, and 290 nm.
Samples for the determination of GSH and AsA content were prepared by grinding 2 g of each treated leaf and root with 18 mL of 0.9% sodium chloride solution. The resulting mixture was then centrifuged at 1,370 g for 8 min. The content of GSH and AsA was measured at a wavelength of 405 nm (Law et al., 1983) and 536 nm (Stevens et al., 2006), respectively, utilizing related kits (Nanjing Jiancheng Bioengineering Institute).
2.14 Determination of sodium (Na+), potassium (K+) and calcium (Ca2+) content
The method for determining the content of Na+, K+, and Ca2+ was modified based on the previous work (Farhangi-Abriz and Ghassemi-Golezani, 2018). After drying in an oven, samples consisting of 0.1 g of leaves and roots from each treatment group were subjected to digestion using a mixture of 9 parts HNO3 and 1 part HClO4. The content of Na+, K+, and Ca2+ in the samples was quantified using atomic absorption spectrophotometry.
2.15 Bimolecular fluorescent complementation (BIFC)
The CDS of Cqtrihelix23 was inserted at the C-terminal of YFP (cYFP). On the other hand, the CDSs of CqNHX4 and CqCBL10 were inserted at the N-terminal of YFP (nYFP). The resulting constructs, namely Cqtrihelix23-cYFP, CqNHX4-nYFP, and CqCBL10-nYFP, were transformed into GV3101. The suspension containing Cqtrihelix23-cYFP was mixed with equal volumes of suspensions containing the nuclear localization marker and either CqNHX4-nYFP or CqCBL10-nYFP. This mixed suspension was kept in the dark for 2 h. Subsequently, the suspensions were injected into tobacco leaves, and the injected tobacco plants were grown under both dark and light conditions for one day. Finally, the protein interactions were visualized using confocal laser microscopy.
2.16 Statistical analysis
The data was obtained from three independent replicates and is reported as the mean ± standard deviation (SD) using analysis of variance (ANOVA). In the figures, different letters signify significant differences (p < 0.05) observed among the various treatment groups, which were determined using one-way ANOVA through GraphPad Prism 7 software (GraphPad Software). Graphs were generated using GraphPad Prism 7.
3 RESULTS
3.1 Systematic analysis of the Cqtrihelix family
A total of 49 Cqtrihelices have been identified and named Cqtrihelix 1 to 49 based on their chromosomal localization (Table S1). The Cqtrihelices displayed a pH range of isoelectric points (pI) from 4.64 to 9.84, and their molecular weights (MWs) varied between 21.53 and 94.38 KDa. Using the LG model, an ML tree was constructed in MEGA 7.0, incorporating 49 Cqtrihelices and 29 Attrihelices. The Cqtrihelices were classified into five subfamilies: SIP1, GTr, GT-2, GT-1, and SH4 (Figure 1A). The SIP1 subfamily possessed the highest number of members, while the GT-1 subfamily had the least.
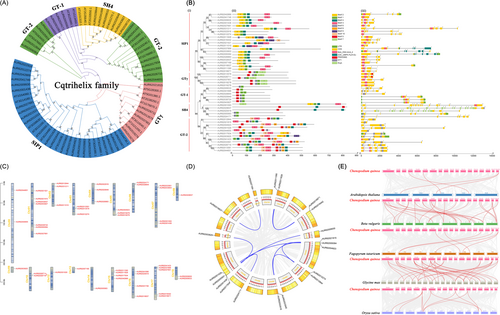
(A) Maximum likelihood tree based on the full-length sequences of the 29 Arabidopsis trihelix genes and 49 quinoa trihelix genes were constructed under LG model using Mega 7. (B) Phylogenetic relationships, gene structure, conserved domain and conserved protein motifs in Cqtrihelixs from quinoa. (i) The maximum likelihood tree was constructed based on the full-length sequences of Cqtrihelix proteins under WAG model using Mega 7. (ii) The motif composition of Cqtrihelix proteins. The motifs, numbers 1–10, are displayed in different colored boxes. The protein length can be estimated using the scale at the bottom. (iii) Exon-intron structure and conserved domains of Cqtrihelix proteins. Green boxes indicate untranslated 5′- and 3′-regions; yellow boxes indicate exons; black lines indicate introns. The number indicates the phases of the corresponding introns. (C) Schematic representations for the chromosomal distribution of Cqtrihelixs. The red lines indicate duplicated Cqtrihelix gene pairs. The chromosome number is indicated to the left of each chromosome. (D) Schematic representations of the interchromosomal relationships of Cqtrihelixs. Grey and blue lines indicate all homology blocks in the quinoa genome, and the blue lines indicate duplicated Cqtrihelix gene pairs. (E) Synteny analysis of trihelixs between quinoa and six representative plant species. Gray lines in the background indicate the collinear blocks within quinoa and other plant genomes (Beta vulgaris, Glycine max, Fagopyrum tataricum, Oryza sativa, and Arabidopsis thaliana), while red lines highlight syntenic Cqtrihelix gene pairs.
The 49 Cqtrihelices were categorized into five subfamilies, as illustrated in Figure 1B-i. Among these, most Cqtrihelices displayed motif 1, as depicted in Figure 1B-ii and detailed in Table S4. Notably, motif 5 was absent in all subfamilies except SIP1. Intriguingly, members of the GT-2 subfamily exhibited the highest diversity of motifs. Upon investigation of the gene structure, intron numbers for Cqtrihelix ranged from 0 to 15 (Figure 1B-iii). The similarity in gene structure and motif composition within each subfamily further validated the accurate grouping of the phylogenetic tree.
3.2 Chromosome location, tandem duplication, segmental duplication and syntenic analysis
The 49 Cqtrihelix genes exhibited an uneven distribution across 18 chromosomes. Notably, chromosomes 8, 9, 12, 13, and 14 contained only one Cqtrihelix gene, while chromosome 1 harbored seven Cqtrihelices (Figure 1C). Furthermore, chromosome 10 contained only one pair of tandem duplication genes, as shown in Figure 1C. Conversely, 10 pairs of segmental duplicate genes were identified, as illustrated in Figure 1D and detailed in Table S7. These duplicated genes played a crucial role in the expansion of the Cqtrihelix family. Interestingly, Cqtrihelices formed 35 syntenic gene pairs with G. max, 27 pairs with B. vulgaris, 10 pairs with O. sativa, 6 pairs with F. tataricum, and 4 pairs with A. thaliana (Figure 1E, Table S10). The syntenic analysis indirectly suggested the potential conservation of trihelix function in these plants.
3.3 Identification of key salt-responsive Cqtrihelices
Previous studies have reported the significance of trihelices in A. thaliana, specifically GT-4 (At3g25990), in the tolerance towards salt stress (Wang et al., 2014). Thus, the identification of Cqtrihelices with potential resistance to salt stress is essential. To begin, it was observed that quinoa seedlings experienced growth promotion with the introduction of 50 mM NaCl, while root development gradually decreased as the concentration of salt increased (Figure S1A). Notably, an effective reduction of 26.5% in quinoa root length and 15.1% in fresh weight was observed after 100 mM NaCl treatment, making this concentration suitable for subsequent experiments (Figure S1B and C). Following this, gene expression patterns of Cqtrihelices homologous to GT-4 were assessed after 100 mM NaCl treatment in order to identify crucial salt-responsive Cqtrihelices. Different genes exhibited varied responsiveness to salt treatment. During salt treatment, the expression of four Cqtrihelices (Cqtrihelix26, Cqtrihelix23, Cqtrihelix6, and Cqtrihelix2) increased in roots and shoots in comparison to the control, while the expression of three Cqtrihelices decreased (Cqtrihelix17, Cqtrihelix7, and Cqtrihelix39) (Figure 2). Notably, the expression of Cqtrihelix23 in quinoa roots and shoots treated with 100 mM NaCl were 3.4 and 1.6 times higher compared to the control, suggesting that Cqtrihelix23 may serve as a candidate key salt-stress related gene (Figure 2).
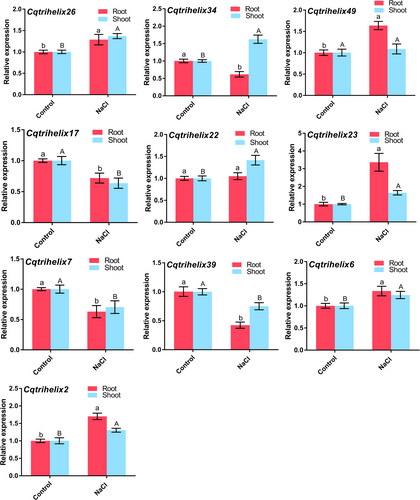
Quinoa seedlings of three pairs of leaves visible were cultured in Hoagland solution, 100 mM NaCl-Hoagland solution for one week, and then RT-qPCR was used to detect the expression of different genes. Values are mean ± SD (n = 3). Different letters indicated that the mean values of gene expression in the same tissue under different treatments were compared according to t-test, and there was significant difference at P < 0.05. Lowercase letters represent significant differences in gene expression in the roots, while uppercase letters represent significant differences in gene expression in the shoots.
3.4 Molecular characteristics analysis of Cqtrihelix23
The localization of Cqtrihelix23 in the nucleus was determined through the observation of fluorescence signals (Figure 3). Furthermore, transactivation analysis revealed that only yeast cells in the positive control group were able to grow normally in (SD)/−Trp-His defective medium, suggesting that Cqtrihelix23 did not exhibit transactivation activity in yeast (Figure S2).
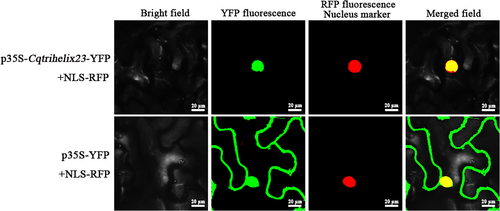
Agrobacteria carrying Cqtrihelix23 or control vector YFP were infiltrated into leaves of N. benthamiana with the nuclear maker, and the fluorescence images were taken in a dark field for yellow and red fluorescence, in the white field for the morphology of the cell, and in combination. Bright: bright field; YFP: YFP fluorescence; RFP: RFP fluorescence; Merged: YFP/bright/RFP field overlay. Bar = 20 μm.
3.5 Effects of Cqtrihelix23 on the growth of quinoa under salt treatment
Suspensions containing pCAMBIA1300-Cqtrihelix23 or the pCAMBIA1300 empty vector were transiently overexpressed in quinoa and subsequently treated with 100 mM NaCl for two weeks. Laser confocal results demonstrated the successful transient overexpression of Cqtrihelix23 in both quinoa leaves and roots (Figure 4A-B). Additionally, the expression of Cqtrihelix23 in roots and shoots that had undergone transient overexpression was 3.3 and 2.8 times higher than those of the empty vector (Figure S3A). These findings confirmed the successful transient overexpression of Cqtrihelix23 in quinoa. Significantly, salt stress had a severe impact on quinoa development, as indicated by reductions in root length and fresh weight of 23.7 and 33.1% after salt treatment, respectively (Figure 5A-C). However, when quinoa with transient overexpression of Cqtrihelix23 was subjected to salt treatment, the root length and fresh weight exhibited significant increases of 71.9 and 98.6% compared to the empty vector group (Figure 5B-C).

(A) Fluorescence observation of quinoa leaves transiently overexpressed with Cqtrihelix23 suspension. Tobacco leaves were injected with a suspension containing the pCAMBIA1300 empty vector as a control. The yellow fluorescence showed the fluorescence of pCAMBIA1300-Cqtrihelix23-YFP. Bar = 20 μm; (B) Fluorescence observation of quinoa root soaked in Cqtrihelix23 suspension. Laser scanning confocal micrographs include: Bright field, 488 nm (yellow fluorescence) and their merge. Bar = 20 μm.
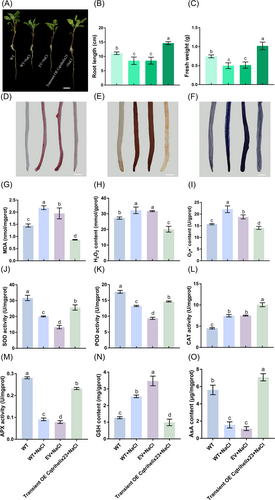
Quinoa seedlings with three pairs of leaves visible that were transiently overexpressed with the empty vector and Cqtrihelix23 were separately cultured in 100 mM NaCl-Hoagland solution for two weeks. (A) Phenotypic changes of quinoa seedlings under different treatments. (B) The root length. (C) The fresh weight. (D) MDA staining results under different treatments. The redder the color, the greater the MDA content. (E) H2O2 staining results under different treatments. The browner the color, the greater the H2O2 content. (F) O2•− staining results under different treatments. The bluer the color, the great the O2•− content. (G) MDA content in roots. (H) H2O2 content in roots. (I) O2•− content in roots. (J) SOD activity. (K) POD activity. (L) CAT activity. (M) APX activity. (N) GSH content. (O) AsA content. Values are the mean ± SD (n = 3). Different letters indicate significant differences at p < 0.05 according to one-way ANOVA in GraphPad Prism 7.04.
In addition, the levels of chlorophyll and carotenoid in quinoa shoots experienced a substantial reduction of 56.5 and 58.8% after salt treatment in comparison to the control condition (Figure S3B and C). However, when quinoa shoots with transient overexpression of Cqtrihelix23 were subjected to salt treatment, there was a significant increase of 130.1 and 122.9% in the content of these indicators compared to the empty vector group (Figure S3B and C).
3.6 Effects of Cqtrihelix23 on lipid peroxidation and ROS after salt treatment
The experimental results demonstrated that the quinoa roots subjected to salt treatment exhibited darker staining compared to the control group (Figure 5D-F). Moreover, the content of MDA, H2O2 and O2•− in roots experienced a significant increase of 50.6, 18.35, and 40.6%, respectively, in comparison to the control, following salt treatment (Figure 5G-I). Similarly, the content of these indicators in shoots showed a notable increase of 116.1, 61.1, and 41.9%, respectively, compared to the control (Figure S3D-F). However, when quinoa roots with transient overexpression of Cqtrihelix23 were exposed to salt treatment, there was a significant decrease of 55.6, 36.5, and 25.1%, respectively, in the content of MDA, H2O2 and O2•−, in comparison to the group that underwent transient overexpression of the empty vector (Figure 5G-I). Similarly, the content of these indicators in shoots exhibited a significant decrease of 64.4, 64.7, and 57.9%, respectively, compared to the empty vector group (Figure S3D-F).
3.7 Effect of Cqtrihelix23 on the antioxidant capacity of quinoa after salt treatment
Following salt treatment, the activities of SOD, POD, and APX in the roots experienced a significant decrease of 36.8, 25.1, and 67.6%, respectively, compared to the control group (Figure 5J, K, M). Similarly, the activities of these enzymes in shoots demonstrated a significant decrease of 18.8, 28.9, and 48.2%, respectively, compared to the control (Figure S3G, H, J). In contrast, the CAT activity in both roots and shoots increased by 11 and 45.4%, respectively, following salt treatment (Figure 5L, Figure S3I). Furthermore, when quinoa roots with transient overexpression of Cqtrihelix23 were exposed to salt treatment, the activities of these four enzymes exhibited a significant increase of 92.3, 56.7, 34.3, and 195.1%, respectively, compared to the group with transient overexpression of the empty vector (Figure 5J-M). Likewise, the activities of these antioxidant enzymes in shoots demonstrated a significant increase of 34, 12.1, 21.1, and 55.3%, respectively, compared to the empty vector group (Figure S3G-J).
3.8 Effects of Cqtrihelix23 on the content of antioxidant substances under salt treatment
Following salt treatment, the content of GSH in both roots and shoots exhibited a significant increase of 100.8 and 96.9%, respectively, compared to the control (Figure 5N, Figure S3K). Conversely, the content of AsA showed a notable decrease of 72.3 and 62.4%, respectively, after salt treatment (Figure 5O, Figure S3L). Additionally, when quinoa roots and shoots with transient overexpression of Cqtrihelix23 were subjected to salt treatment, the content of GSH demonstrated a significant decrease of 71.5 and 63.8%, respectively, in comparison to the empty vector group (Figure 5N, Figure S3K). On the other hand, the content of AsA exhibited a significant increase of 528.3 and 78.9%, respectively, compared to the empty vector group (Figure 5O, Figure S3L).
3.9 Effects of Cqtrihelix23 on the content of Na+, K+ and Ca2+ in quinoa under salt treatment
Under salt treatment, the Na+ content in roots and shoots exhibited a significant increase of 1034.6 and 1137.2% compared to the control group (Figure 6A, E), while the K+ content significantly decreased by 29.1 and 36.3% (Figure 6B, F). Furthermore, the Ca2+ content was found to decrease significantly by 48.3 and 23.4% (Figure 6C, G), whereas the Na+/K+ ratio showed a remarkable increase of 1495.9 and 1854.5% (Figure 6D, H). Following salt treatment, the Na+ content in roots and shoots, with transient overexpression of Cqtrihelix23, decreased by 67 and 70.6% compared to the empty vector group (Figure 6A, E). Conversely, the K+ content in roots and shoots with transient Cqtrihelix23 overexpression significantly increased by 24.6 and 70.8% (Figure 6B, F). Similarly, the Ca2+ content in roots and shoots with transient Cqtrihelix23 overexpression displayed a significant increase of 49.9 and 13.1% compared to the empty vector group (Figure 6C, G). Notably, the Na+/K+ ratio exhibited a significant decrease of 73.6 and 82.9% in roots and shoots with transient Cqtrihelix23 overexpression compared to the empty vector group (Figure 6D, H).
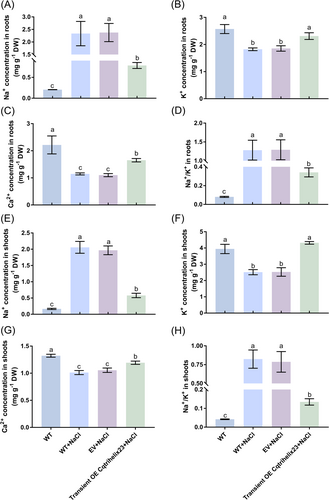
Quinoa seedlings with three pairs of leaves visible that were transiently overexpressed with the empty vector and Cqtrihelix23 were separately cultured in NaCl-Hoagland solution for two weeks. (A) Na+ content in roots. (B) K+ content in roots. (C) Ca2+ content in roots. (D) Na+/K+ ratio in roots. (E) Na+ content in shoots. (F) K+ content in shoots. (G) Ca2+content in shoots. (H) Na+/K+ ratio in shoots. Values are mean ± SD (n = 3). Different letters indicate significant differences at p < 0.05 according to one-way ANOVA in GraphPad Prism 7.04.
3.10 Comprehensive analysis of two quinoa salt-responsive gene families
Transcriptional regulation plays a vital role in enhancing plant salt stress tolerance, as transcription factors control the expression of stress-responsive genes that contribute to the plant's response to stress (Acharya et al., 2023). Amongst the gene families responsive to salt stress, CBL and NHX hold significant importance (Acharya et al., 2023). By identifying the CqCBL and CqNHX families in quinoa, we can establish a crucial groundwork for understanding the involvement of Cqtrihelix in salt stress regulation.
In total, 17 CqCBL and 10 CqNHX genes were identified, with their basic information provided in Tables S2-3. ML trees were constructed to illustrate the relationship between CBLs and NHXs in both A. thaliana and quinoa (Figure S4A and S5A). All CqCBLs were found to contain Motif 1, and the gene structure analysis revealed a variation in the number of introns, ranging from 4 to 12 (Figure S4B, Table S5). Similarly, all CqNHXs exhibited the presence of motifs 1, 2, 3, 6, 7, and 10, with the intron count ranging from 13 to 24 (Figure S5B, Table S6).
We observed an uneven distribution of CqCBLs and CqNHXs on chromosomes. Notably, CqCBLs had two tandem duplicates, while CqNHXs did not (Figure S4C and S5C). Furthermore, among the identified CqCBLs, there was one gene pair resulting from segmental duplication, whereas, for CqNHXs, we found two gene pairs arising from segmental duplications (Figure S4D, S5D, Table S8, and Table S9).
We also examined the syntenic relationships of CqCBLs and CqNHXs with five representative plants. CqCBLs displayed syntenic gene pairs with all five plants, with the highest number identified in B. vulgaris (Figure S4E, Table S11). However, we did not detect any syntenic gene pairs of CqNHXs in O. sativa, although CqNHXs exhibited the most homologous pairs with G.max (Figure S5E, Table S12).
3.11 Cqtrihelix23 promotes quinoa salt stress resistance by regulating salt-related genes
AtNHX7 (AT2G01980) (Zhu, 2003), AtNHX1 (AT5G27150) (Yang et al., 2009) and AtCBL1 (At4G17615) (Cheong, 2003) are known to play crucial roles in salt tolerance. To identify key salt-related genes regulated by Cqtrihelix23, we investigated the expression of homologous genes to the aforementioned salt-responsive genes in plants with transient overexpression of Cqtrihelix23 after salt treatment. Notably, the expression of these genes in salt-treated shoots was significantly higher than that in the control group (Figure S6). Specifically, the expression of CqNHX4 in the roots and shoots of salt-treated quinoa was 2.1 and 2.7 times higher, respectively, compared to the control. Similarly, the expression of CqCBL10 was 2.8 and 1.9 times higher than that of the control (Figure S6). After salt treatment, the expression of CqNHX4 in roots and shoots with transient overexpression of Cqtrihelix23 was 1.8 and 1.6 times higher than the empty vector group, while the expression of CqCBL10 in quinoa with transient overexpression of Cqtrihelix23 was 1.7 and 1.9 times higher than that in the empty vector group (Figure S6). These findings suggested that Cqtrihelix23 may enhance salt stress resistance through the upregulation of CqNHX4 and CqCBL10 gene expression.
3.12 Cqtrihelix23 interacts with CqCBL10 and CqNHX4
In the BIFC assay, no fluorescence signal was detected in the control group. However, upon coexpression of Cqtrihelix23 with CqCBL10, a fluorescence signal was observed overlapping with the nuclear localization signal (Figure 7). Similarly, when Cqtrihelix23 was coexpressed with CqNHX4, a comparable fluorescence signal was generated, indicating an interaction between the two proteins within the nucleus (Figure 7). These results strongly supported a nuclear interaction between Cqtrihelix23 and both CqCBL10 and CqNHX4.
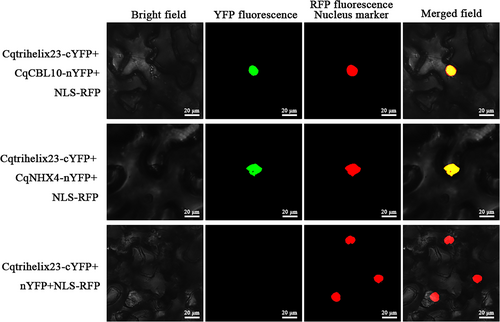
Cqtrihelix23 can interact with CqNHX4 and CqCBL10 in N. benthamiana leaves. CqCBL10 was fused with the N-terminal fragment of yellow fluorescence protein (nYFP) to form CqCBL10-nYFP. CqNHX4 was fused with the nYFP to form CqNHX4-nYFP. Cqtrihelix23 was fused with C-terminal fragment of YFP (cYFP) to form Cqtrihelix23-cYFP. Green indicates a positive interaction signal. No signal was observed from negative controls.
3.13 CqCBL10 and CqNHX4 promote salt stress tolerance
To examine the functions of CqCBL10 and CqNHX4, we transiently overexpressed suspensions containing pCAMBIA1300-CqCBL10-YFP or pCAMBIA1300-CqNHX4-YFP into quinoa. The expression of CqCBL10 in the roots and shoots of quinoa with transient overexpression was 2 and 2.3 times higher, respectively, compared to the empty vector group (Figure 8A). Similarly, the expression of CqNHX4 in quinoa roots and shoots with transient overexpression was 2.5 and 2.2 times higher, respectively, than the empty vector group (Figure 8B). These results confirmed the successful overexpression of CqCBL10 and CqNHX4 in quinoa. Furthermore, the transient transformation of CqCBL10 and CqNHX4 improved the overall growth of quinoa under salt treatment conditions (Figure 8C). Upon salt treatment, the levels of O2•−, H2O2, and MDA in quinoa roots with transient overexpression of CqCBL10 exhibited a significant decrease of 38.6, 49.3, and 65%, respectively, compared to the empty vector group (Figure 8D-F). Similarly, in quinoa shoots, the levels of these markers significantly decreased by 31.5, 27.3, and 58.1% compared to the empty vector group (Figure S7). Moreover, in quinoa roots with transient overexpression of CqNHX4, the content of O2•−, H2O2, and MDA after salt treatment showed a significant decrease of 58.1, 45.8, and 74.3%, respectively, compared to the empty vector group (Figure 8D-F). Likewise, in quinoa shoots with transient overexpression of CqNHX4, the levels of these markers significantly decreased by 36, 29.2, and 36.4%, respectively, compared to the empty vector group (Figure S7). Collectively, CqCBL10 and CqNHX4 may contribute to enhancing the salt resistance of quinoa.
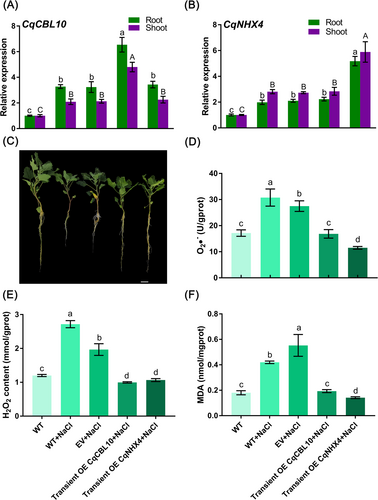
Quinoa seedlings with three pairs of leaves visible that were transiently overexpressed with the empty vector, CqCBL10 and CqNHX4 were separately cultured in 100 mM NaCl-Hoagland solution for two weeks. Finally, relevant indicators of all these quinoa seedling roots in different treatments were then determined. (A) Expression analysis of CqCBL10 in quinoa root and shoot under salt stresses after transient overexpression of CqCBL10. Lowercase letters represent significant differences in gene expression in the roots, while uppercase letters represent significant differences in gene expression in the shoots. (B) Expression analysis of CqNHX4 in quinoa root and shoot under salt stresses after transient overexpression of CqNHX4. Lowercase letters represent significant differences in gene expression in the roots, while uppercase letters represent significant differences in gene expression in the shoots. (C) The effects of CqCBL10 or CqNHX4 on the phenotype of quinoa seedlings under salt stress. (D) The O2•− content changes of quinoa roots under different treatments. (E) The H2O2 content changes of quinoa roots under different treatments. (F) The MDA content changes of quinoa roots under different treatments. Values are the mean ± SD (n = 3). Different letters indicate significant differences at p < 0.05 according to one-way ANOVA in GraphPad Prism 7.04.
3.14 Simultaneous transient transformation of Cqtrihelix23 and CqCBL10, as well as Cqtrihelix23 and CqNHX4, improve quinoa salt tolerance
To assess whether Cqtrihelix23 can enhance the ability of CqCBL10 or CqNHX4 to improve quinoa's salt stress resistance, we conducted transient overexpression experiments in quinoa using suspensions containing pCAMBIA1300-Cqtrihelix23-YFP and pCAMBIA1300-CqCBL10-YFP, as well as pCAMBIA1300-Cqtrihelix23-YFP and pCAMBIA1300-CqNHX4-YFP. Compared to the control vector, the expression of target genes in the roots and shoots of quinoa with transient overexpression of CqCBL10, simultaneous transient overexpression of Cqtrihelix23 and CqCBL10, transient overexpression of CqNHX4, and simultaneous transient overexpression of Cqtrihelix23 and CqNHX4 were significantly increased (Figure 9A-C). These findings confirmed the successful overexpression of Cqtrihelix23, CqCBL10, and CqNHX4 in quinoa seedlings. Furthermore, the simultaneous transient transformation of Cqtrihelix23 and CqCBL10 demonstrated a greater improvement in quinoa growth under salt treatment compared to CqCBL10 alone (Figure 9D). Following salt treatment, the levels of O2•−, H2O2, and MDA in quinoa roots with simultaneous transient overexpression of Cqtrihelix23 and CqCBL10 decreased significantly by 48.3, 29, and 78.4% respectively, compared to the transient overexpression of CqCBL10 alone (Figure 9E-G). Similarly, in shoots, these indexes decreased by 6.7, 45.4, and 24.6%, respectively (Figure S8). Moreover, the simultaneous transient transformation of Cqtrihelix23 and CqNHX4 also demonstrated a greater improvement in quinoa growth under salt treatment compared to CqNHX4 alone (Figure 9D). Following salt treatment, the levels of O2•−, H2O2, and MDA in quinoa roots with simultaneous transient overexpression of Cqtrihelix23 and CqNHX4 decreased significantly by 34.5, 31.4, and 62.5% respectively, compared to the transient overexpression of CqNHX4 alone (Figure 9E-G). Similarly, in shoots, these indexes decreased by 16, 14.8, and 66.8%, respectively (Figure S8). These findings provided evidence that Cqtrihelix23 could synergize with CqCBL10 or CqNHX4 to enhance quinoa's resistance to salt stress.
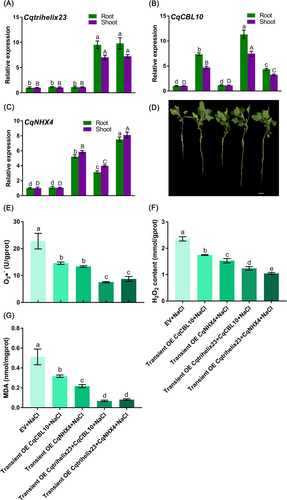
Quinoa seedlings with three pairs of leaves visible that were transiently overexpressed with the empty vector, CqCBL10, CqNHX4, a mixture of Cqtrihelix23 and CqCBL10, and a mixture of Cqtrihelix23 and CqNHX4 were separately cultured in 100 mM NaCl-Hoagland solution for two weeks. Finally, relevant indicators of all these quinoa seedlings roots in different treatments were then determined. (A) Expression analysis of Cqtrihelix23 in quinoa roots under salt stresses after transient overexpression of Cqtrihelix23 and CqCBL10, as well as Cqtrihelix23 and CqNHX4. Lowercase letters represent significant differences in gene expression in the roots, while uppercase letters represent significant differences in gene expression in the shoots. (B) Expression analysis of CqCBL10 in quinoa root and shoot under salt stresses after transient overexpression of Cqtrihelix23 and CqCBL10, as well as Cqtrihelix23 and CqNHX4. Lowercase letters represent significant differences in gene expression in the roots, while uppercase letters represent significant differences in gene expression in the shoots. (C) Expression analysis of CqNHX4 in quinoa root and shoot under salt stresses after transient overexpression of Cqtrihelix23 and CqCBL10, as well as Cqtrihelix23 and CqNHX4. Lowercase letters represent significant differences in gene expression in the roots, while uppercase letters represent significant differences in gene expression in the shoots. (D) The effects of simultaneous transient overexpression of Cqtrihelix23 and CqCBL10 as well as Cqtrihelix23 and CqNHX4 on the phenotype of quinoa seedlings under salt stress. (E) The O2•− content changes of quinoa roots under different treatments. (F) The H2O2 content changes of quinoa roots under different treatments. (G) The MDA content changes of quinoa roots under different treatments. Values are the mean ± SD (n = 3). Different letters indicate significant differences at p < 0.05 according to one-way ANOVA in GraphPad Prism 7.04.
4 DISCUSSION
Salt stress poses a significant challenge, significantly hindering global crop productivity (Waqas et al., 2019). Plants face a tradeoff between growth and defense, allocating limited resources based on environmental changes. This delicate balance is crucial for plant survival, as well as for agricultural and natural ecosystems (Huot et al., 2014). Breeders aim to enhance our understanding of stress signals and adaptive mechanisms in plants, with the goal of reducing stress effects and improving survival outcomes (Xiong and Zhu, 2001). Previous studies have highlighted the crucial role of TFs, including trihelices, in plant growth and stress tolerance (Kaplan-Levy et al., 2012). Trihelix genes implicated in salt tolerance have been identified in various plant species (Magwanga et al., 2019). However, the regulatory role of trihelix genes in salt stress response remains relatively unexplored in quinoa. Therefore, this study conducted a comprehensive analysis of the trihelix family in the quinoa genome, identified trihelix genes associated with salt stress resistance, and explored the mechanism underlying Cqtrihelix's ability to confer resistance to salt stress from multiple perspectives, including physiological, biochemical, and molecular approaches.
We identified and characterized forty-nine trihelix genes in quinoa, which revealed the involvement of a pair of tandem and ten pairs of segmental duplication genes in the expansion of this gene family. The relatively low abundance of trihelix genes in plants suggests their evolution may be closely linked to environmental changes that plants have encountered (Magwanga et al., 2019). Through collinearity analysis, we observed significant conservation between Cqtrihelices and trihelix genes in G. max and B. vulgaris. Notably, Cqtrihelix23 displayed higher expression in the root and exhibited the most robust response to salt stress. These findings motivated us to further investigate the potential role of Cqtrihelix23 in salt resistance.
Exposure of plants to soil salinity triggers dynamic changes in cellular activities and various biochemical pathways (Khan et al., 2012). This includes the production of excessive ROS through cellular respiration, leading to extensive oxidative damage and eventual plant death. In salt-resistant plants, the excessive release of ROS activates antioxidant enzymes that regulate intracellular ROS levels (Gill and Tuteja, 2010). In our study, we observed a significant increase in antioxidant enzyme activities in quinoa plants following transient overexpression of Cqtrihelix23 under salt stress. These enhanced enzymatic activities highlight the crucial role of Cqtrihelix23 in mobilizing antioxidant enzymes to catalyze ROS and reduce them to non-toxic levels, thereby minimizing oxidative damage. During various physiological processes, including photosynthesis, plants naturally generate ROS as byproducts. Approximately 1–2% of absorbed oxygen in plants is converted into ROS, such as superoxide radicals, perhydroxyl radicals, and hydroxyl radicals (Katekhaye and Kale, 2012). However, the excessive accumulation of ROS surpasses the cellular tolerance threshold and results in oxidative damage to cellular and organelle membranes through lipid peroxidation (Mittler et al., 2022). The extent of lipid peroxidation can be reflected by the concentration of MDA (Mittler et al., 2022). In our study, the MDA and H2O2 concentrations in quinoa plants transiently overexpressing Cqtrihelix23 were significantly lower compared to wild-type quinoa, indicating an enhanced capacity for salt tolerance in the transformed plants. Similar findings have been reported in other studies, where overexpression of AST1 in A. thaliana conferred less severe lipid peroxidation and ROS damage under salt or osmotic stress, while AST1 plants displayed heightened damage, indicating the potential of AST1 in promoting salt and osmotic stress tolerance (Xu et al., 2018).
Na+ and K+ can utilize the same set of transport proteins for cellular entry (Greenway and Munns, 1980), and maintaining intracellular Na+/K+ homeostasis is crucial for plant survival under salt stress conditions (Yang and Guo, 2017). The mechanisms involved in reducing cytoplasmic Na+ levels include limiting Na+ uptake, increasing Na+ efflux, and regionalizing Na+ in vacuoles (Tester and Davenport, 2003). Our findings demonstrated that Cqtrihelix23 significantly decreased the Na+/K+ ratio in quinoa following salt treatment, thereby promoting salt tolerance (Figure 6). Similarly, Liu et al. reported that lines overexpressing OsGTγ-2 exhibited improved survival rates, better growth status, and lower Na+/K+ ratios under salt stress, while knock-out lines of OsGTγ-2 using CRISPR/Cas9 displayed salt-sensitive phenotypes and higher Na+/K+ ratios (Liu et al., 2020). Furthermore, various transporters and stress-responsive genes play vital roles in salt stress resistance. For instance, the Na+/H+ antiporter OsSOS1 in rice facilitates Na+ exclusion from shoots, reduces the cell Na+/K+ ratio, and improves salt resistance (Mahi et al., 2019; Martinez-Atienza et al., 2007). The AtNHX family in Arabidopsis, particularly AtNHX2, contributes to the vacuolar compartmentalization of Na+ and is essential for salt tolerance (Yokoi et al., 2002). In rice, the vacuolar Na+/H+ antiporters OsNHX1 to OsNHX5 play essential roles in the sequestration of Na+ and K+ within the cytoplasmic compartment, thus determining salt tolerance (Fukuda et al., 2010; Liu et al., 2010). Additionally, studies have highlighted the role of A. thaliana CBL1 in promoting resistance to salt stress (Cheong, 2003). Furthermore, OsCBL4 activates OsSOS1 by phosphorylating OsSOS2, thereby enhancing salt resistance in rice (Kumar et al., 2009; Mahi et al., 2019). To further elucidate genes that can enhance salt tolerance in quinoa, we conducted a comprehensive analysis of the CqCBL and CqNHX families, ultimately identifying 17 CqCBLs and 10 CqNHXs as potential factors involved in salt stress response.
Several genes, such as NHX and CBL, influence plant salt resistance by controlling their expression. In a study conducted by Liu et al., it was observed that rice plants overexpressing OsbZIP71 exhibited improved tolerance to salt stress. Conversely, transgenic lines with RNAi knockdown of OsbZIP71 were more sensitive to salt stress. Further analysis revealed that OsbZIP71 directly bound to the promoter of OsNHX1 (Liu et al., 2014). Wang et al. found that OsHKT1;1 played a crucial role in reducing Na+ accumulation, and it was discovered that OsMYBc could directly regulate the expression of OsHKT1;1 (Wang et al., 2015). In our investigation, we found that the transient overexpression of Cqtrihelix23 in quinoa plants under salt stress led to increased expression of the transporters CqNHX4 and CqCBL10. This suggested that Cqtrihelix23 could potentially enhance quinoa's resistance to salt stress by regulating the expression of these transporters. To support this, the BIFC experiment demonstrated a direct interaction between Cqtrihelix23 and CqCBL10 as well as CqNHX4 (Figure 7). Moreover, when quinoa was transiently overexpressed with CqCBL10 and CqNHX4, it was observed that these genes also reduced oxidative damage, thereby improving quinoa's ability to resist salt stress. However, the impact of CqCBL10 or CqNHX4 on the Na+ and K+ content in quinoa under salt treatment requires further exploration. Significantly, when Cqtrihelix23 was simultaneously transformed transiently with either CqCBL10 or CqNHX4 in quinoa, the plant's capacity to resist salt stress was enhanced, suggesting that CqCBL10 and CqNHX4 collaborated in conferring salt stress resistance in quinoa.
5 CONCLUSIONS
This study conducted a comprehensive analysis of the Cqtrihelix family and salt stress-related families, namely CqNHX and CqCBL, in the quinoa genome. Cqtrihelix23, identified as a potential regulator of salt stress, was characterized through investigations into its gene structure, motif composition, collinearity analysis, duplication events, and expression levels. The research findings highlighted that Cqtrihelix23 enhanced quinoa's ability to withstand salt stress by facilitating increased activity of antioxidant enzymes, reducing lipid peroxidation and resulting damage from ROS, and decreasing the Na+/K+ ratio. Notably, this study also revealed that Cqtrihelix23 enhanced the antioxidant capacity of quinoa under salt treatment by interacting with the CqCBL10 and CqNHX4 proteins. Moreover, it was observed that CqCBL10 and CqNHX4 shared a similar function, further emphasizing the involvement of Cqtrihelix23 in salt tolerance alongside CqCBL10 and CqNHX4. These findings contribute to the understanding of the molecular regulatory network associated with quinoa's salt resistance and serve as a theoretical foundation for enhancing salt tolerance in plants.
AUTHOR CONTRIBUTIONS
Wenjun Sun: Conceptualization, Data analysis, Graph drawing, Writing-original draft, Validation; Ying Chen: Literature research, Data curation, Validation; Min Yao: Literature research, Data curation, Validation; Junyi Zhan: Writing-review & editing; Hui Chen: Modify the manuscript; Gang Zhao: Literature research, Data curation; Liang Zou: Guiding the research, Funding acquisition, Dabing Xiang: Literature research, Data curation, Xiaoyong Wu: Literature research, Data curation; Yan Wan: Literature research, Data curation, Changying Liu: Literature research, Data curation, Qi Wu: Literature research, Data curation, Xueling Ye: Literature research, Data curation, Yu Fan: Literature research, Data curation. All authors read and approved the final manuscript.
ACKNOWLEDGMENTS
We thank the colleagues in our laboratory for providing useful discussions and technical assistance. We are very grateful to the editor and reviewers for critically evaluating the manuscript and providing constructive comments for its improvement.
FUNDING INFORMATION
This research was supported by the Sichuan Science and Technology Program (2023NSFSC0214) and China Agriculture Research System (CARS-07-B-1) and National Natural Sciences Foundation of China (32301850). Fund was used for the design of the study and collection, analysis, and interpretation of data and in writing the manuscript, as well as in the open access payment.
CONFLICT OF INTEREST STATEMENT
The authors declare that they have no known competing financial interests or personal relationships that could have appeared to influence the work reported in this paper.
Open Research
DATA AVAILABILITY STATEMENT
The genome sequences of Chenopodium quinoa used for identifying gene families in this study were downloaded from an Integrated Repository for Population Genomics in the genus Chenopodium (http://www.cbrc.kaust.edu.sa/chenopodiumdb/). The datasets supporting the conclusions of this article are included with in the article and its Additional files.


