Diethyl ether anaesthesia inhibits de-etiolation of barley seedlings by locking them in intermediate skoto-photomorphogenetic state
Abstract
Light is an essential environmental signal for plant development called photomorphogenesis. Here, we show that diethyl ether anaesthesia inhibits the de-etiolation process in barley (Hordeum vulgare) seedlings. Illuminated seedlings exposed to diethyl ether accumulated significantly less chlorophylls and chlorophyll-binding proteins, and exhibited reduced maximum quantum yield of photosystem II photochemistry (Fv/Fm). Although the direct effect of light necessary for the greening process, i.e. for the photoreduction of protochlorophyllide (Pchlide) to chlorophyllide (Chlide) catalysed by light-dependent protochlorophyllide oxidoreductase A (PORA), was not inhibited, the RNA-seq and qPCR analyses showed that light-induced expression of photosynthesis-associated nuclear genes (PhANGs) and genes encoding enzymes for chlorophyll biosynthesis were attenuated. On the other hand, transcription of chloroplast-encoded genes was not negatively affected by diethyl ether treatment during greening. Among the genes negatively regulated by light, PORA and PHYA were only slightly affected by diethyl ether. The effect of diethyl ether was fully reversible and, after its removal, the greening process was fully restored. Our data indicate that diethyl ether had two effects on greening: i) it inhibited the expression of PhANGs and chlorophyll biosynthesis-related genes irrespective of light conditions, ii) it blocked the light-induced expression of these genes and greening process of etiolated seedlings. Our study indicates that diethyl ether affects plastid biogenesis, which alters the orchestration of negative and positive regulators affecting phytochrome and/or retrograde signalling and does not allow expression of PhANGs. Thus, the plants are locked in an intermediate skoto-photomorphogenetic state in the light.
1 INTRODUCTION
Light is essential for plants not only for photosynthesis but also as an environmental stimulus triggering a light-induced development called photomorphogenesis. In the absence of light, a type of growth called skotomorphogenesis is coupled with etiolation in angiosperms (Armarego-Marriott et al., 2020). Etiolated angiosperm plants contain etioplasts instead of chloroplasts. Etioplasts do not contain chlorophyll or thylakoid membranes as chloroplasts do but rather have a paracrystalline structure known as the prolamellar body (PLB). The PLB consists of the plastid lipids, chlorophyll precursor protochlorophyllide (Pchlide), the light-dependent protochlorophyllide oxidoreductase A (PORA) and cofactor NADPH forming Pchlide-NADPH-PORA ternary complexes, forming helically arranged dimers attached to the stromal surface of the PLB membranes (Floris and Kühlbrandt, 2021). Illumination of etioplasts results in the photoreduction of Pchlide to chlorophyllide (Chlide) by PORA photoenzyme, which is further transformed to chlorophylls (Chls) by two enzymatic steps (Schoefs and Franck 2003; Gabruk and Mysliwa-Kurzdiel, 2015; Solymosi and Mysliwa-Kurdziel, 2021). However, this fast reaction within few seconds is responsible only for a small accumulation of Chlide and Chls (few nmol g−1 FW). For effective production and accumulation of Chls (in the range of several μmol g−1 FW), the early rate-limiting step in Chl biosynthesis, which is repressed in the dark, must be activated. Glutamyl-tRNA reductase (GluTR) is the rate-limiting enzyme involved in the biosynthesis of the chlorophyll precursor aminolevulinic acid (ALA) and is regulated by two ways. Light stimulates transcription of HEMA genes encoding GluTR through the action of phytochrome photoreceptors, resulting in light-dependent accumulation of this rate-limiting enzyme (McCormac et al., 2001; Matsumoto et al., 2004; Kobayashi and Masuda, 2016). The photoreduction of Pchlide to Chlide by light further enhances the accumulation of chlorophylls by keeping the rate-limiting GluTR in an active state. In the presence of Pchlide, PORA interacts with the FLU protein, which binds to GluTR and inhibits its activity, preventing the accumulation of phototoxic precursors (Meskauskiene et al., 2001; Richter et al., 2010; Czarnecki and Grimm, 2012; Kauss et al., 2012).
Light-induced accumulation of Chls is tightly coupled with the stable assembly of the pigment-protein complexes in thylakoid membranes, preventing the accumulation of free photooxidative chlorophyll molecules (Kanervo et al., 2008). The regulatory mechanisms include transcriptional control of genes encoding chlorophyll-binding proteins in the nucleus and plastids, and post-translational control. Light induces transcription of photosynthesis-associated nuclear genes (PhANGs) encoding components of pigment-protein complexes directly through phytochrome (Apel, 1979; Morishige and Preiss, 1995). Some PhANGs show well-synchronized oscillation with HEMA, forming a gene cluster (Matsumoto et al., 2004; Kobayashi and Masuda, 2016). On the other hand, when Chls are not synthetized in sufficient amount, the chlorophyll-binding proteins are rapidly degraded because Chls stabilize the pigment-protein complexes in thylakoid membranes. This tight coordination between the formation of the Chls and the synthesis of chlorophyll-binding proteins is advantageous and prevents photooxidative damage (Apel and Kloppstech, 1980; Morishige and Preiss, 1995; Wang et al., 1997; Hobber et al., 2007; Wang and Grimm, 2015).
Recently, we have found that anaesthetics like diethyl ether, xenon or lidocaine, with no structural similarities, inhibit chlorophyll synthesis in garden cress (Lepidium sativum) and the plants exposed to the anaesthetics exhibited etiolation phenomena (Yokawa et al., 2018). Previous studies showed that plants under anaesthesia cannot respond to mechanical stimuli from insect prey in the carnivorous plant Venus flytrap (Dionaea muscipula) and the systemic response in wounded thale cress (Arabidopsis thaliana) is also completely suppressed (Pavlovič et al., 2020; Jakšová et al., 2021; Scherzer et al., 2022). In both cases, diethyl ether completely inhibited propagation of the electrical and Ca2+ signals, an intriguing parallel to the anaesthetic effect on neurons in animals and humans. In this study, we tried to elucidate the effect of the general volatile anaesthetic diethyl ether on light responsiveness during de-etiolation of barley seedlings.
2 MATERIALS AND METHODS
2.1 Plant material and experimental setup
The seeds of barley (Hordeum vulgare, cv. Morex) were sown on moist perlite in 8 plastic pots and cultivated in total darkness at 23 ± 1°C. After seven days, the pots were bagged into polypropylene bags and diethyl ether was added into four bags in complete darkness. The remaining four bagged pots served as control. To obtain 15% vapour, a liquid phase of 3.5 mL diethyl ether (74.12 g mol−1, 0.71 g cm−3) was allowed to evaporate inside the sealed 5 L polypropylene bag for 2 h in the dark (Yokawa et al., 2018). After 2 h, three pots with etherized plants and three pots with control plants were illuminated by white light (100 μmol photons m−2 s−1, 400–700 nm) for 6 h; the remaining 2 pots stayed in darkness. Tissue samples (i.e., primary leaves) were collected after 6 h of illumination. Tissue samples from control and etherized plants grown in the dark were also harvested at this time point. After 6 h of illumination, the polypropylene bags around etherized and control plants in the remaining four pots were removed to investigate recovery from diethyl ether treatment. The plants were kept at the same light intensity, and tissue samples were harvested 24 and 48 h after the start of illumination (hereinafter referred as time points), each time from intact plants from a different pot. The summary of experimental design is depicted in Figure S1.
2.2 Pigment quantification
Primary leaves (500 mg) were ground with mortar and pestle and extracted with 80% (v/v) chilled acetone and MgCO3 to avoid phaeophytinization of chlorophylls under dim green safelight. After centrifugation, the extracts were spectrophotometrically quantified using Specord 250 Plus double-beam spectrophotometer (Analytik Jena) at wavelengths: 663.2 nm (Chl a), 646.8 nm (Chl b) and 470 nm (sum of carotenoids + xanthophylls). The concentration was calculated according to Lichtenthaler (1987). The pigment spectra were also measured to confirm the presence of the corresponding absorption maxima.
Pchlide was extracted from 100 mg of the plant material (fixed for 2 min in hot steam to inhibit PORA according to Koski and Smith, 1948) in 3 mL acetone:0.1 M NH4OH (9:1, v/v). To separate Pchlide from the esterified tetrapyrroles and carotenoids, the extract was washed three times with an equal volume of hexane. The amount of Pchlide was measured spectrofluorimetrically (Jasco FP-8500) at excitation and emission wavelengths of 438 and 633 nm, respectively, in the hexane-washed acetone phase and quantified using a Pchlide standard. The Pchlide standard was prepared from etiolated barley plants according to Koski and Smith (1948) and spectrophotometrically quantified at 623 nm using the molar extinction coefficient in diethyl ether ε = 3.56 × 10⁴ M−1 cm−1 (Dawson et al., 1986). Using a dilution series of Pchlide standard in acetone:0.1 M NH4OH (9:1, v/v), the calibration curve was measured spectrofluorimetrically as mentioned above. All manipulations in the dark were performed under a dim green safelight.
2.3 RNA-seq
For RNA-seq experiments, dark-grown control (CD), dark-grown etherized (ED), 6 h-illuminated control (C6), and 6 h-illuminated etherized seedlings (E6) were sampled. For extraction of total RNA, we used Spectrum Plant Total RNA kit (Sigma–Aldrich), followed by DNase I treatment and further purified by RNA Clean & Concentrator kit (Zymoresearch) according to manufacturer's instructions. The integrity of RNA was checked by agarose (1%) gel electrophoresis. The concentration and sample purity were measured by NanoReady Touch series Micro volume (UV–Vis) spectrophotometer (Life Real).
RNA-seq sequencing libraries were prepared using KAPA mRNA HyperPrep Kit (Roche sequencing) and reads generated on NovaSeq 6000 system (Illumina) were used for the expression analysis. Reads were trimmed with fastp (Chen et al., 2018) with the parameters -q 30 -w 4 -l 50. Trimmed reads were mapped using STAR v2.7.9a (Dobin et al., 2013) to the reference genome sequence assembly of barley cv. Morex (Mascher, 2021). Expression was calculated via rsem v.1.3.1 (Li and Dewey, 2011). RNA-seq quantitation pipeline was performed in R v3.6 using R packages tximport, DESeq2 (p-value set to <0.05), ggplot2 and plotly. GO analysis was performed via g:Profiler (Raudvere et al., 2018).
2.4 qPCR
Total RNA of 7-day-old barley primary leaves was extracted (Oñate-Sánchez and Vicente-Carbajosa, 2008) and the RNA pellet was air-dried on ice for 5 min, resuspended in water and treated twice with a Turbo DNase-free kit (Invitrogen). The cDNA was synthesized using RevertAid H Minus First Strand cDNA Synthesis Kit (Thermo Fisher Scientific). Oligo (dT)18 primers were used for nuclear-encoded, and random hexamer primers for chloroplast-encoded genes.
The RNA was reverse-transcribed from five biological replicates (each replicate represents 3–4 primary leaves from different seedlings), and qRT–PCR reactions were performed in duplicate on a QuantStudio 5 Real-Time PCR System (Applied Biosystems) using Luna Universal qPCR Master Mix (New England Biolabs); both primers were used at 400 nM with a 200 nM dual-labelled FAM/TAM TaqMan probe. Primers and probes were designed using Primer Express 3.0 software (Life Technologies) and are shown in Table S1. Cycle threshold values were normalized with the expression of ELONGATION FACTOR (HvEF) and ACTIN (HvACT). Expression values were obtained from five biological and two technical replicates.
2.5 Low-temperature fluorescence emission spectra (77 K)
Fluorescence emission spectra of the leaves were measured at low temperature using a fluorescence spectrophotometer FP-8500 (Jasco) with the spectral bandwidth of 2.5 nm for both excitation and emission monochromators. The plant material fixed in holder was immersed in liquid nitrogen (77 K) in an optical Dewar flask. The excitation wavelength was set to 440 nm. All manipulations during measurements were performed under a dim green safelight. For the organization of the pigment-protein complexes, the primary leaf from plants grown as described above was measured. In the second experiment, for measurements of Shibata shift, the etiolated plants were bagged 2 h with or without diethyl ether in the dark, then illuminated 5 minutes and placed again for 2, 10 and 20 minutes in the dark and then measured.
2.6 SDS-PAGE and Western blotting
Total proteins from the barley primary leaves were isolated using an extraction buffer containing 28 mM DTT, 28 mM Na2CO3, 175 mM sucrose, 5% SDS, 10 mM EDTA and protease inhibitors (Set VI, Calbiochem). The samples were heated for 30 min at 70°C. The concentration of total soluble proteins in the samples was determined using the Bicinchoninic Acid Kit for Protein Determination (Sigma-Aldrich), and absorbance was measured at 562 nm (Specord 250 Plus double-beam spectrophotometer (Analytik Jena). The same amount of proteins was separated in a 10% (v/v) SDS–polyacrylamide gel (Schägger, 2006) followed by transfer to a nitrocellulose membrane (Bio-Rad) by Trans-Blot SD Semi-Dry Electrophoretic Transfer Cell (Bio-Rad). To check the correct protein transfer, the membranes were stained by Ponceau-S. After blocking in TBS-T containing 5% BSA overnight at 4°C, the membranes were incubated with the primary antibody at room temperature with soft agitation. Antibodies against protein D1 (AS05 084), D2 (AS06 146), PsaA (AS06 172), PsaB (AS10 695), CP43 (AS11 1787), CP47 (AS04 038), PsbO (AS06 142–33), Lhcb 2–5 (AS01 003, AS01 002, AS04 045, AS01 009), Lhca 1–3 (AS01 005, AS01 006, AS01 007), POR (AS05 067), GluTR (AS10 689), PHY (AS20 4500) and ACTIN (AS13 2640) were purchased from Agrisera. After washing, the membranes were incubated 1 h in the secondary antibody (goat anti-rabbit IgG (H + L)-horseradish peroxidase conjugate) with dilution 1:10 000 (Bio-Rad). For immunodetection of PHY, goat anti-mouse (H + L)-horseradish peroxidase conjugate was used. Signals were visualized and quantified using Immobilon Western chemiluminescent HRP substrate (Millipore) on an Amersham Imager 600 (GE HealthCare Life Sciences).
2.7 In vivo chlorophyll a fluorescence measurements
Fast chlorophyll a fluorescence induction kinetics were measured using PEA-fluorimeter (Hansatech) to investigate the functionality of photosystem II. Prior to the measurements, all illuminated samples were dark-adapted for 30 minutes. The primary barley leaf was gently fixed in the clip and suddenly illuminated by a flash of red light (2000 μmol photons m−2 s−1, 650 nm) over a time span of 50 μs up to 3 s with a data acquisition rate of 10 μs for the first 2 ms, of 1 ms between 2 ms and 1 s, and of 100 ms between 1 s and 3 s. Maximum quantum yield of photosystem II photochemistry (Fv/Fm) was calculated by the PEA-fluorimeter.
2.8 Statistical analysis
Data presented are means ± SE. The n is number of samples analysed, and each sample consists of several primary leaves. Before statistical analyses, the data were tested for homogeneity of variance (Brown-Forsythe test, Origin 8.5.1.). If the homogeneity was fulfilled, Student's t-test was used to evaluate significant differences between control and diethyl ether-treated plants at particular time points or between illuminated plants and dark-grown etiolated plants. If the homogeneity was not fulfilled, Welch's test was used. Data from qPCR were evaluated using paired Student's t-test (paired data were samples running within the same 96-well plate).
3 RESULTS
3.1 Diethyl ether inhibited chlorophyll accumulation during de-etiolation
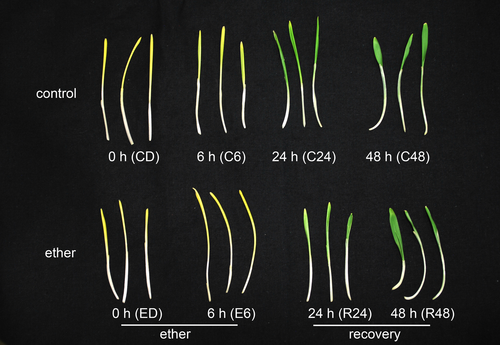
The pigmentation of control and etherized plants is clearly visible in Figure 1. As expected, neither control nor etherized plants had detectable Chl a + b in the dark. After 6 h of illumination, the Chl a + b was detectable in both groups of plants but the chlorophyll content in the control group was significantly (30-fold) higher than in etherized plants. During the recovery period on normal air (24 and 48 h time points), the chlorophyll content in etherized plants gradually increased up to the levels of the control plants. While, after 24 h of illumination, the chlorophyll content in etherized plants was about 50% of the content in control plants, the chlorophyll content in both plant groups was the same after 48 h of illumination (Figure 2A).
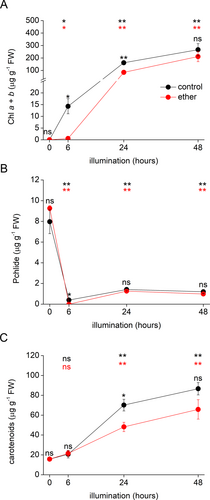
Pchlide accumulated to the same extent in both groups of plants in the dark. After 6 h of illumination, Pchlide was almost completely photoreduced; only 5% of the original (i.e., control dark-grown) Pchlide level was detected in control plants. In etherized plants after 6 h of illumination, Pchlide was not detected at all. During the recovery period, a low amount of Pchlide was again detectable in both plant groups (Figure 2B).
Carotenoids were detected in the dark in both groups of plants and their content increased in response to illumination. Significant changes were detected only during the recovery period after 24 h of illumination (Figure 2C).
3.2 Diethyl ether blocked light-induced expression of nuclear genes encoding pigment-protein complexes and enzymes of chlorophyll metabolism
RNA-seq experiment and DEG analyses showed that etiolated plants illuminated for 6 h under control conditions had 2174 upregulated genes and 1180 downregulated genes in comparison to control dark-grown etiolated plants (C6/CD comparison). In etherized plants, the 6 h illumination upregulated only 447 genes (299 of which were upregulated also in control plants) and downregulated 296 (80 of which were downregulated also in control plants) in comparison to etherized dark-grown etiolated plants (E6/ED comparison). Diethyl ether itself had also a strong effect on gene expression. In the dark-grown etiolated etherized plants, 2002 genes were upregulated and 3416 genes were downregulated in comparison to control dark-grown etiolated plants (ED/CD comparison). After 6 h illumination, diethyl ether upregulated 2786 genes (1525 of which were upregulated also in the dark-grown plants) and downregulated 4794 genes (734 of which were downregulated also in the dark-grown plants) in comparison to 6 h-illuminated control plants (E6/C6 comparison). The Venn diagrams showing significantly up and downregulated genes are shown in Figure S2 and Table S2.
As expected, among the most enriched gene ontology (GO) categories in 6 h-illuminated control plants compared to control dark-grown plants (C6/CD comparison) are categories related to photosynthesis (e.g., chlorophyll-binding, photosystem II, photosystem I, thylakoid membrane, electron transport, light harvesting etc.). Interestingly, this is not the case for etherized plants (E6/ED comparison). In accordance, comparing 6 h-illuminated etherized plants with control plants with normal atmosphere (E6/C6 comparisons) showed underrepresented GO categories related to photosynthesis (e.g., photosynthesis, light harvesting, chlorophyll-binding, photosystem I, photosystem II, chloroplast organization, chloroplast etc.), (Figure S3, Table S3). Application of diethyl ether (ED/CD and E6/C6 comparisons) induced expression of genes encoding proteins involved in the repair of misfolded proteins (HSP and chaperons) and proteolysis, and reduction of molecular oxygen in accordance with our previous study (Figure S3, Table S3; Pavlovič et al., 2022).
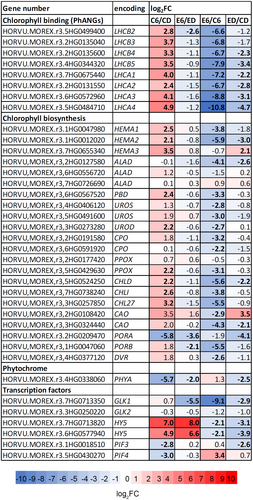
Heat map of differentially expressed genes (DEG) involved in chlorophyll metabolism, chlorophyll-binding and phytochrome signalling is shown in Figure 3. The level of mRNA encoding chlorophyll-binding proteins associated with photosystem I and II (LHCA and LHCB, respectively) are clearly upregulated by 6 h illumination (C6/CD comparison) in contrast to illuminated etherized plants (E6/ED comparison). This strong inhibitory effect of diethyl ether in illuminated seedlings is more clearly visible in C6 vs. E6 comparison, but diethyl ether clearly downregulated mRNA levels to a lower extent even in the dark-grown seedlings (ED/CD comparison). Among the genes significantly upregulated by light (C6/CD comparison) and involved in chlorophyll biosynthesis were the key regulatory enzymes involved in ALA synthesis (HEMA1-3) and further porphobilinogen deaminase (PBD), uroporphyrinogen decarboxylase (UROD), protoporphyrinogen oxidase (PPOX), Mg-protoporphyrin IX chelatase (subunits CHLD, CHLI), Mg-protoporphyrin IX monomethyl ester cyclase (CHL27), and positive transcription factor HYPOCOTYL ELONGATED 5 (HY5). This upregulation by light was abolished in etherized seedlings except HY5 (E6/ED comparison). Among the genes significantly negatively regulated by light were PORA, phytochrome A (PHYA) and phytochrome interacting factors (PIF3 and PIF4, C6/CD comparison). Diethyl ether treatment alleviated light-induced repression of PORA and PHYA, but not completely, and the genes were still significantly downregulated by light in contrast to PIFs. It is worth mentioning that positive transcription factor GOLDEN2-LIKE1 (GLK1) was strongly repressed under diethyl ether in the light (E6/ED and E6/C6 comparisons, Figure 3). For transcripts per million see TPM values in Table S4.
3.3 Gene expression is recovered after diethyl ether removal
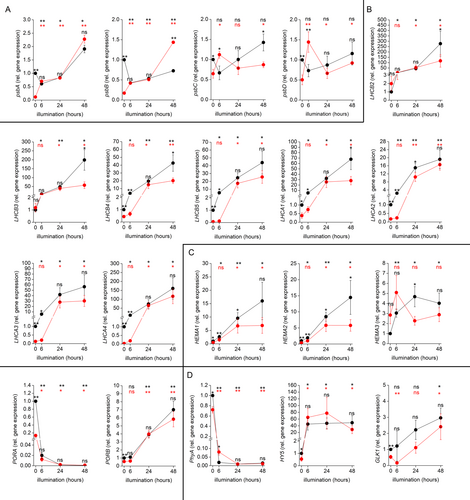
For verification of RNA-seq experiments, we performed qPCR analyses of selected genes at 0, 6, 24 and 48 h time points to document recovery from diethyl ether anaesthesia (Figure 4). The data from qPCR confirmed our RNA-seq analyses. In most cases, the mRNA levels of the investigated genes were significantly downregulated in etherized etiolated in comparison to control etiolated plants (except LHCB2, LHCB3 and HEMA3). The mRNA from all the PhANGs was clearly induced by light in control but not in etherized plants. However, during the recovery period (24 and 48 h time points), their mRNA level was strongly increased, indicating that the anaesthesia was reversible. In contrast, chloroplast-encoded psbA, psbB, psbC, and psbD (encoding D1, CP47, CP43 and D2 proteins, respectively) showed the same or higher mRNA level during 6 h illumination in etherized in comparison to control seedlings. Diethyl ether downregulated psbA, psbB, psbC and psbD in the dark, as observed for PhANGs, but light slightly upregulated them in etherized plants, indicating a different mechanism of regulation by diethyl ether in comparison to PhANGs. PORA and PHYA were clearly downregulated after the illumination in comparison to dark-grown seedlings, but to a lower magnitude in the etherized plants. PORB was upregulated during the recovery period (24 and 48 h time points) in both control and etherized conditions compared to dark-grown plants. In contrast to LHCBs and LHCAs, HY5 was upregulated by light in control as well as in etherized plants to the same extent. GLK1 was significantly downregulated in illuminated etherized plants.
3.4 Assembly of photosystems detected by fluorescence emission spectra at 77 K
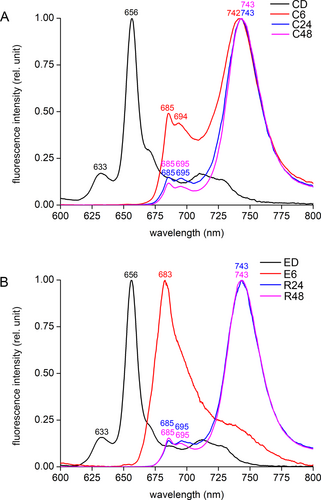
The changes in gene expression induced by diethyl ether are mirrored in the assembly of pigment-protein complexes in chloroplasts. In the dark-grown etiolated control and etherized seedlings, there were clearly detectable emission fluorescence maxima at 633 and 656 nm, indicating the presence of non-photoactive Pchlide and photoactive Pchlide organized into dimers of the Pchlide-NADPH-POR ternary complexes in PLB, respectively. In the emission spectra of the control plants after 6 h of illumination, the maxima were red-shifted to 685 and 694 nm, indicating the presence of core antenna CP43 and CP47 of PSII, respectively. The appearance of the red-shifted peak with a maximum at 742 nm indicates the presence of Chls bound in LHCA proteins attached to PSI core (Figure 5A). On the contrary, the etherized plants had only a single peak with a maximum at 683 nm, indicating the presence of Chl a incorporated to some chlorophyll-binding proteins associated with PSII, which is indicative of the presence of etiochloroplasts. During the recovery period at 24 and 48 h time points, the etherized plants gradually recovered and formed complete PSII and PSI complexes as indicated by the appearance of fluorescence emission maxima at 685, 695 and 743 nm, which are the same as in control plants (Figure 5B).
3.5 Pchlide reduction is not affected by diethyl ether
To find out whether Pchlide photoreduction was affected by diethyl ether, we analysed fluorescence emission spectra measured at 77 K after 5 minutes of illumination and after subsequent re-darkening of the samples for 2, 10 and 20 minutes to document the so-called Shibata shift (Schoefs and Bertrand, 1997; Solymosi and Mysliwa-Kurdziel, 2021). In both control and etherized plants, the 5 min illumination was sufficient to convert the major pool of Pchlide to Chlide: a new emission fluorescence band with maximum at 693–694 nm appeared, which is attributed to the formation of dimeric or oligomeric Chlide-NADPH-POR complex, with a shoulder at 675 nm reflecting a partial Chlide liberation from POR (Schoefs and Bertrand, 1997). Within 20 minutes in the dark, again both in control and etherized plants, the 693–694 nm band underwent a shift to the shorter wavelength (681 nm), which corresponds to the disaggregation of Chlide-NADPH-POR complex, the well-known Shibata shift (Figure S4A,B). After several hours, this Shibata shift is followed by a slight red-shift to 683 nm, which reflects the incorporation of Chl(ide) into the polypeptides of the photosynthetic apparatus (as explained for the etherized plant at 6 h time point, Figure 5B). In summary, diethyl ether had no significant effect on photoreduction of Pchlide to Chlide.
3.6 Abundance of important photosynthesis-related proteins
The inhibitory effect of diethyl ether is clearly visible also at the protein level. As expected, no chlorophyll-binding proteins (D1, D2, CP43, CP47, LHCB2-5, PsaA, PsaB, LHCA1-3) were immunodetected in etiolated tissue (Figure 6). After 6 h of illumination, all these investigated chlorophyll-binding proteins were detectable in control plants, however only two of them, D1 and LHCB2, were detected in seedlings exposed to diethyl ether. During the recovery period at 24 and 48 h time points, all the analysed chlorophyll-binding proteins were immunodetected at similar abundance as in the control plants and they were positively regulated by light. These data are consistent with the 77 K-fluorescence emission spectra described above. The PsbO was expressed constitutively and ACTIN was used as a loading control.
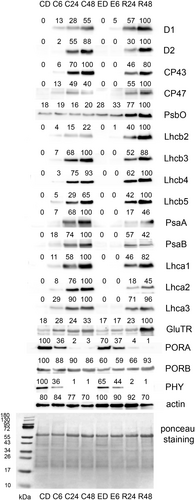
We focused our attention also on important regulatory proteins in chlorophyll biosynthesis. The abundance of GluTR was positively regulated by light, as is well known (McCormac et al., 2001), and was higher in control than in etherized plants after 6 h illumination. The PORA, which is negatively regulated by light (Holtorf et al., 1995), showed a similar decline in etherized and control plants. The PORB showed constitutive expression. PHY was negatively regulated by light in control and also in etherized plants but to a lower extent in the latter (Figure 6).
3.7 Functionality of photosystem II
To monitor the formation of functional PSII during the de-etiolation process, we measured the maximum quantum yield of PSII photochemistry (Fv/Fm) by fast chlorophyll a fluorescence induction using PEA instrument (Figure S5). The Fv/Fm reflects the potential quantum efficiency of PSII and is a sensitive indicator of plant photosynthetic performance with optimal values of around 0.83 for most plant species (Maxwell and Johnson, 2000). Surprisingly, we found values above 0.83 in etiolated plants, which have not developed PSII in the dark. The analyses of fluorescence induction curves of control as well as etherized plants showed that the chlorophyll a fluorescence rise did not correspond to the typical O-J-I-P transient (Figure S6). It is very probable that during the 3-s excitation light flash, Pchlide is reduced to Chlide in exposed samples. The detected curves thus reflect the gradual rise of Chlide concentration, the fluorescence emission of which is shifted to the red region (see above), which is preferentially detected by the PEA instrument. As expected, after 6 h of illumination, the Fv/Fm values in etherized plants were significantly lower than in control plants and no typical O-J-I-P transient was observed, indicating non-functional PSII. During the recovery period at 24 h and 48 h time points, the etherized plants recovered completely (see the same Fv/Fm values for both treatments) and the chlorophyll a fluorescence rise showed typical O-J-I-P transient, indicating sequential reduction of PSII acceptor side (Figure S5, S6).
4 DISCUSSION
In this study, we confirmed our previous observations that diethyl ether anaesthesia inhibited de-etiolation, i.e. greening of etiolated seedlings after illumination (Figure 1, Yokawa et al., 2018). Because diethyl ether did not inhibit the photoreduction of Pchlide accumulated in the dark to Chlide by PORA photoenzyme, the disappearance of Pchlide and the trace of Chl can still be detected upon illumination of etherized dark-grown barley seedlings (Figure 2A,B). However, Chl concentration remained rather very low in illuminated etherized seedlings, indicating that chlorophyll biosynthesis and the assembly of photosynthetic apparatus are somehow hampered in etherized plants. From the data presented here, it is obvious that the effect of diethyl ether is dual: i) first, diethyl ether itself downregulated many genes encoding chlorophyll-binding proteins and enzymes involved in chlorophyll metabolism in the dark as well as in the light. This is in line with our previous observations, where we showed the deregulation of many chlorophyll biosynthesis and photosynthesis-related genes in circadian-grown Arabidopsis thaliana after diethyl ether treatment (Pavlovič et al., 2022). This effect can be partially explained by transient diethyl ether-induced increase of cytoplasmic Ca2+ level [Ca2+]cyt, which is known to be responsible for the repression of LHCB genes through ABI4 (Guo et al., 2016; Pavlovič et al., 2022); ii) second, diethyl ether inhibited de-etiolation, i.e. the light-induced accumulations of chlorophylls and chlorophyll-binding proteins. The most important regulatory enzyme in chlorophyll biosynthesis is GluTR encoded by HEMA genes, which determines the flux of metabolites (i.e., aminolevulinic acid, ALA) into the biosynthetic pathway. GluTR is not expressed at a significant level in etiolated plants in the dark, but its expression is strongly induced during de-etiolation (McCormac et al., 2001; Kobayashi and Masuda, 2016). In accordance, we found significantly induced expression of HEMA1, HEMA2, and HEMA3 genes after illumination in control but not in etherized seedlings (Figures 3, 4). This finding may also explain that the content of GluTR enzyme did not increased in 6 h-illuminated etherized plants (Figure 6). Heat map shows that other genes encoding enzymes for chlorophyll biosynthesis were also clearly upregulated by light in control (C6/CD) but not in etherized seedlings (E6/ED, Figure 3). Moreover, GluTR enzyme activity can be also regulated post-translationally, accumulated Pchlide switches off the enzyme through the FLU protein interaction (Richter et al., 2010). However, our data showed that diethyl ether did not inhibit the photoconversion of Pchlide to Chlide (Figure S4); thus, GluTR enzyme was released from Pchlide-induced repression under anaesthesia. The same pattern than HEMA expression was also documented for PhANGs (Figures 3, 4), which is in accordance with the well-synchronized accumulation of chlorophylls and their binding proteins (Kobayashi and Masuda, 2016). Further synchronization is achieved at the post-translational level when a lack of Chl destabilizes and degrades the excess chlorophyll-binding proteins (Apel and Kloppstech, 1980; Wang and Grimm, 2015).
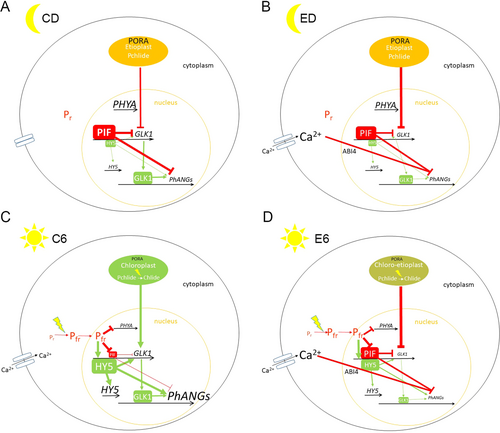
The nuclear genes encoding enzymes involved in chlorophyll biosynthesis and PhANGs investigated in this study are regulated mainly by phytochrome (Apel, 1979; Morishige and Preiss, 1995; McCormac et al., 2001; Matsumoto et al., 2004; Kobayashi and Masuda, 2016). In the process of de-etiolation, phytochrome A (PHYA) is the most important. With the exception of PORA and PHYA, actively transcribed in the dark, most of the photosynthesis-related genes are not well transcribed in dark-grown seedlings (Clough and Viestra, 1997; Kobayashi and Masuda, 2016). In etiolated dark-grown seedlings, phytochrome is present in its red light-absorbing form (Pr). After illumination, the Pr form is converted to the far-red form (Pfr), which is translocated into the nucleus where it interacts with transcription factors and triggers the expression of light-responsive genes (Yamaguchi et al., 1999; Sharma, 2001; Kevel et al., 2007; Legris et al., 2019). The inactivation of negative regulators and activation of positive regulators trigger the greening process in etiolated seedlings (Kobayashi and Masuda, 2016). Among the most important negative regulators involved in chlorophyll metabolism are basic helix–loop–helix PIF transcription factors. In the dark, they accumulate in the nucleus, repressing genes encoding chlorophyll metabolism and chlorophyll-binding proteins (Shin et al., 2009). However, upon illumination, PIFs interact with Pfr, initiating PIFs degradation via phosphorylation, followed by degradation via the ubiquitin-proteasome system, thus inactivating the repressors (Al-Sady et al., 2006). Meanwhile, the major positive regulator, HY5, is degraded in the dark-grown seedlings by CONSTITUTIVE PHOTOMORHOGENESIS 1 (COP1)-mediated ubiquitination in the nucleus. After illumination and Pfr formation, COP1 nuclear abundance decreases and HY5 triggers the expression of light-inducible genes and also binds to its own promoter, hence inducing its own expression (Osterlund et al., 2000; Gangappa and Botto, 2016). Although diethyl ether inhibited expression of the positive regulator HY5 in the dark (ED/CD), it had no profound effect on its light-induced expression (C6/CD and E6/ED comparisons), indicating Pfr formation in illuminated seedlings under diethyl ether anaesthesia. The PIFs transcription factors may act directly or indirectly through another positive regulator, GOLDEN2-LIKE1 (GLK1) transcription factor (Waters et al., 2009; Martín et al., 2016; Sakuraba et al., 2017). Based on the induction of many stress-related genes (e.g., HSPs) and ROS production (Table S3; Lin et al., 2011; Yokawa et al., 2018; Pavlovič et al., 2022), the exposition to diethyl ether represents stress conditions for plants. Under such conditions, GLK1 expression is repressed in a GENOME UNCOUPLED1 (GUN1)-dependent manner (i.e., by retrograde signalling), antagonizing the phytochrome signal and attenuating photomorphogenesis (Martín et al., 2016; Wu and Bock, 2021). GLK1 was among the significantly downregulated DEG in response to diethyl ether, and light further reduced its expression under diethyl ether (E6/ED comparison, Figures 3, 4), indicating that inhibited de-etiolation triggered by diethyl ether may come from negative signals from plastids (i.e., retrograde signalling). Both phytochrome and retrograde signallings are important for the greening of etiolated seedlings (Dubreuil et al., 2018).
On the other hand, the chloroplast-encoded psbA, psbB, psbC and psbD behaved in a different manner. It is well known that D1 protein synthesis increases up to 100-fold when induced by light but without an equivalent increase in psbA mRNA levels, indicating that here the translation is the pivotal regulation step (Jin et al., 2018; Li et al., 2020). This is in accordance with our study, where we found only little changes in psbA mRNA level (Figure 4) but strong induction of D1 protein in response to light (Figure 6). The nuclear-encoded translation factor HIGH CHLOROPHYLL FLUORESCENCE173 (HCF173), which is induced by light through phytochrome, interacts with another translation factor, LOW PHOTOSYNTHETIC EFFICIENCY 1 (LPE1). Light induces photosynthesis, increases the reducing power and promotes the reduction of LPE1, and the reduced form of LPE1 in complex with HCF173 activates the translation initiation of psbA (Jin et al., 2018; Li et al., 2020). This different redox-based regulatory mechanism may explain the presence of D1 protein in 6 h-illuminated etherized seedlings (Figure 6), which is probably stabilized by the few Chl molecules in thylakoid membranes synthetized by the direct action of PORA enzyme.
On the contrary, the PORA gene is actively expressed in etiolated seedlings and its mRNA is negatively regulated by light (Apel et al., 1981, Figures 3, 4). Although the PIF and COP1 transcription factors play a role in this process (Sperling et al., 1998; Moon et al., 2008; Shin et al., 2009), regulation of PORA expression is much more complex. For example, a transcription factor REVEILLE1 (RVE1) upregulates PORA expression in the dark by directly binding to the PORA promotor (Xu et al., 2015). Its relationship to other regulatory factors remains unknown (Kobayashi and Masuda, 2016). ETHYLENE INSENSITIVE3/ETHYLENE INSENSITIVE-LIKE 1 (EIN3/EIL1) receptors, the key regulators of ethylene signalling, induce the expression of PORA and PORB in the dark (Zhong et al., 2009, 2010). Ethylene and COP1 stabilize EIN3/EIL1 in the dark, which then upregulates PORA and PORB transcription by binding to their promoter region. After illumination, EIN3 is degraded via COP1 inactivation and ethylene signalling (Zhong et al., 2009). Moreover, the level of PORA protein is also regulated at a post-translational level. The rapid disappearance of PORA protein upon illumination despite the light-induced accumulation of Chls had been an apparent paradox until the second protochlorophyllide oxidoreductase, PORB, was discovered. PORB remained at an approximately constant level in illuminated dark-grown seedlings of barley (Armstrong et al., 1995; Holtorf et al., 1995), in accordance with our study (Figure 6). There are at least three mechanisms of how the plants confine the function of PORA after illumination: i) after the reduction of Pchlide to Chlide, Chlide-PORA complex is rapidly proteolytically degraded by nucleus-encoded and light-induced proteases. On the contrary, Pchlide-NADPH-PORA complexes are resistant to the protease (Reinbothe et al., 1995a,b). ii) Without Pchlide, the new synthetized PORA cannot be taken up into plastids because PORA post-translational transport into plastids is determined by its substrate (Pchlide), and substrate-free PORA peptide is also rapidly proteolytically degraded (Reinbothe et al., 1995b,c; but questioned by Aronsson et al., 2000, and proven to be different in primary leaves and cotyledons by Kim and Apel, 2004). iii) Phytochromes inhibit the translation of PORA mRNA through cytosolic signalling events (Paik et al., 2012). Because diethyl ether does not block the reduction of Pchlide to Chlide (Figure 4), the protease-sensitive Chlide-PORA complex is formed and substrate-free PORA is proteolytically degraded, which may explain the decline of PORA in control and also diethyl ether treatments (Figure 6). In summary, the diethyl ether has not profound effect on the light-induced decline of PORA transcription and PORA protein level.
When etiolated seedlings are irradiated, the level of PHYA protein also drops 10- to 100-fold due to rapid repression of further PHYA transcription by Pfr itself, the constitutive instability of the PHYA mRNA, and rapid degradation of the Pfr protein in monocots (Lissemore and Quail, 1988; Seeley et al., 1992; Higgs and Colbert, 1994; Clough and Vierstra, 1997). In the dark, the level of PHYA mRNA is suppressed under diethyl ether in comparison to control etiolated plants. The strong light-induced repression of steady-state PHYA mRNA and PHYA protein accumulation was also detected in our study in both control and, with lower magnitude, also in etherized plants (Figures 3, 4, 6), indicating Pfr formation under anaesthesia, its migration and nuclear function.
And what is the mechanism of diethyl ether action? Scientists and the doctors who administered this compound still do not understand its molecular mechanism. The hydrophobic character of all general volatile anaesthetics (GVAs), including diethyl ether, suggests that they could target the membranes. Recently, superresolution imaging showed direct experimental evidence that GVA disrupts the ordered lipid domains and affects channel function (Pavel et al., 2020). It is tempting to assume that diethyl ether may inhibit the migration of Pfr into the nucleus directly by changing nuclear membrane properties, affecting nuclear pore complexes. However, the downregulation of PHY and upregulation of HY5 after illumination under diethyl ether indicate that migration of some pool of Pfr into the nucleus still occurs. Diethyl ether may inhibit phytochrome-mediated response also indirectly by affecting ion fluxes. In many studies, it has been found that photoconversion of red form phytochrome (Pr) to far-red form (Pfr) resulted in an increased cytoplasmic calcium level [Ca2+]cyt (Weisenseel and Ruppert, 1977; Shacklock et al., 1992). Micro-injecting Ca2+ into phytochrome-deficient tomato hypocotyls mimicked phytochrome-mediated effects on genes encoding components of the photosynthetic apparatus (Neuhaus et al., 1993; Bowler et al., 1994) and channel blockers and EGTA inhibited phytochrome responses (Shacklock et al., 1992). Using transgenic A. thaliana and Dionaea muscipula, it was recently shown that diethyl ether inhibited the rise of the cytoplasmic calcium level [Ca2+]cyt in response to wounding (Jakšová et al., 2021; Scherzer et al., 2022) by inactivation of GLUTAMATE RECEPTOR-LIKE CHANNELs (GLRs). Interestingly, pharmacological inhibition of GLRs inhibited de-etiolation and chlorophyll accumulation in an unknown manner (Lam et al., 1998). On the other hand, the application of diethyl ether itself triggers an increase of [Ca2+]cyt with different spatiotemporal dynamics in comparison to wounding (Pavlovič et al., 2022), indicating that diethyl ether may affect Ca2+ signature, which is responsible for inhibited de-etiolation. Our analyses also revealed that dysfunctional plastids are formed under diethyl ether anaesthesia. In our previous study, we found that diethyl ether, with its lipophilic character, blocked endocytic vesicle trafficking (Yokawa et al., 2018). Plastid vesicle trafficking is important for chloroplast biogenesis (Lindquist et al., 2016; Mechela et al., 2019) and diethyl ether may also block thylakoid membrane formation and assembly of pigment-protein complexes (Yokawa et al., 2018). Such dysfunctional plastids emit negative signals to the nucleus (or inhibit the emission of positive signal) and inhibit the expression of nuclear-encoded genes by retrograde signalling (e.g., through GUN1) as indicated by GLK1 expression profile. This situation is similar to classic inhibitor treatments used in studies on retrograde signalling (norflurazon and lincomycin), which, regardless of the mechanism of action, prevents functional photosynthetic membrane complex assembly in the light and represses PhANG expression (Kim and Apel, 2013). This down-regulation has been attributed to the release of a plastid factor that indicates a perturbation of the plastid's functional state and represses the expression of nuclear genes required for normal chloroplast development. Although the origin of such factor is still under debate, four classic retrograde signalling pathways regulating PhANG expression have been proposed: i) signals related to tetrapyrrole biosynthesis, ii) signals triggered by plastid gene expression, (iii) redox state and ROS formation, (iv) signals deriving from disturbed plastid metabolism (Hernándes-Verdeja & Strand, 2018; Hernándes-Verdeja et al., 2020). We found inhibited plastid gene expression, but only in dark-grown etiolated seedlings; thus, impaired chlorophyll biosynthesis and ROS production in response to diethyl ether (Table S3; Lin et al., 2011; Yokawa et al., 2018; Pavlovič et al., 2022) are the most prominent candidates. All these suggested mechanisms are not mutually exclusive and all may more or less participate in the inhibited de-etiolation process in barley plants.
5 CONCLUSIONS
The greening of etiolated angiosperm plants requires light from two points of view: i) the energy of photons is required to power POR photoenzyme to convert Pchlide to Chlide and ii) light is a signal which triggers changes of gene expression through signalling pathways. Our results clearly showed that diethyl ether anaesthesia did not inhibit the photoreduction of Pchlide to Chlide but affected signalling pathways. Diethyl ether inhibited the expression of photosynthesis- and chlorophyll biosynthesis-related nuclear-encoded genes in the dark and in the light. It inhibited also their light-induced expression during de-etiolation and locked the seedling in the transient skoto-photomorphogenetic state. Several lines of indirect evidence indicate that phytochrome-mediated response and/or retrograde signalling are affected by diethyl ether (summarized in Figure 7). Because phytochrome and retrograde signalling pathways are very complex issues involving movements of ions across the membrane, gene expression, protein migration, synthesis and degradation, the further step in this topic will focus on the experimental model plant Arabidopsis thaliana with a plethora of mutants (e.g., GUN mutants), transgenic lines (e.g., PHYA:GFP) and available commercial antibodies (e.g., PIFs, HY5) to reveal a complex regulatory dynamic of these signalling networks. This work is currently undertaken in our laboratory.
AUTHOR CONTRIBUTIONS
AP designed experiments, measured pigment content, measured in vivo chlorophyll fluorescence and wrote the manuscript, MK performed qPCR, JK isolated RNA, LH and JB performed RNA-seq analysis, AP and MH performed Western blots, AP and PI measured 77 K fluorescence.
ACKNOWLEDGEMENTS
This work was supported by the Czech Science Foundation Agency [project GAČR 21-03593S]. Computational resources were provided by the e-INFRA CZ project (ID:90254), supported by the Ministry of Education, Youth and Sports of the Czech Republic. We thank David Kopečný for primer design.
Open Research
DATA AVAILABILITY STATEMENT
RNA-seq data were deposited in the NCBI Sequence Read Archive under BioProject number ID PRJNA1002593.


