Can light intensity modulate the physiological, anatomical, and reproductive responses of soybean plants to water deficit?
Edited by: P. Ahmad
Abstract
Little is known about the role of light intensity in modulating plant responses to stress due to water deficit (WD). Thus, the objective of this study was to determine the WD and contrasting irradiance effects on the physiology, anatomy, and grain yield of soybean plants. The experimental design was a randomized block in a growth chamber and a 2 × 2 factorial treatment arrangement: 90% (well-watered, WW) and 40% (WD) of soil field capacities (FC); and 750 (medium irradiance, MI) and 1500 (higher irradiance, HI) μmol (photons) m−2 s−1 irradiance. The WD caused a lower photosynthetic rate — as well as observed in the light curve and in the relative parameters, such as apparent quantum efficiency —, less investment in shoot biomass and pollen grain germination, resulting in lower grain yield. However, there was an increase in non-photochemical energy dissipation, a higher concentration of total soluble sugars, proline, and malondialdehyde. The WD + MI-soybean plants developed thicker spongy parenchyma (related to higher mesophilic conductance of CO2). In the WW + HI condition the palisade parenchyma was thicker, conferring maintenance of photosynthetic efficiency. In addition, there was an increase in the activity of superoxide dismutase, catalase, peroxidase, and ascorbate peroxidase antioxidant enzymes in leaves due to HI, regardless of FC. This induced higher energy expenditure, reflected in the reduction of the number of leaf and branches, leaf area, dry mass of leaves and stem in the WW + HI. Interestingly, these strategies of osmotic adjustment, photoprotection, and antioxidant defenses act together in the WD + HI.
1 INTRODUCTION
Climate change triggered by global warming has increased the frequency of drought periods (Dai et al., 2018; Marcuzzo et al., 2012), characterized by water deficit (WD) in the soil, together with high temperatures and irradiance (Mora et al., 2017). These factors, when combined, have limited the development and reproductive efficiency and, consequently, productivity of several crops (Pacini & Dolferus, 2019), such as soybeans (Jumrani et al., 2018; Salem et al., 2007). The severity of the WD can vary according to its duration, intensity, and phenological stage (Buezo et al., 2019). For soybeans, flowering and grain filling are known to be the most sensitive stages of development to WD (Batista et al., 2019; Cohen et al., 2020a). The WD is still considered the stress that most compromises the physiological processes of plants (Rajabi et al., 2017). This is due to the reduction of the water content in the cells, resulting in several changes, such as the limitation of stomatal opening (Li et al., 2017). Stomatal closure results in decreased CO2 assimilation and, consequently, decreased plant growth and production (Castro et al., 2019; Jumrani & Bhatia, 2018). Additionally, the WD can cause changes in the photosynthetic process by reducing the content of chloroplast pigments and the expression of the genes that encode the Rubisco enzyme (rbcL and rbcS) (Hussain et al., 2019a; Wang et al., 2015). These damages are due, in large part, to oxidative stress, which causes the peroxidation of membrane lipids and the oxidation of macromolecules, such as nucleic acids and proteins (Rivas et al., 2017). Under conditions of oxidative stress, the increase in malondialdehyde (MDA) is indicative of damages to the cell membranes (Batista et al., 2018; Li et al., 2017), and the increase of antioxidant enzymes may indicate the action of defense mechanisms against oxidative stress (Buezo et al., 2019). Plants have several defense mechanisms against stress due to WD, including physiological, metabolic, and anatomical adjustments. An example is the regulation of stomatal opening, providing greater efficiency of the use of water (Jumrani & Bhatia, 2019), in addition to the osmotic adjustment, which allows for the maintenance of cell turgor due to the accumulation of compounds such as proline, glycine-betaine, and sucrose (Azmat & Moin, 2019; Iqbal et al., 2019).
Another frequent abiotic stress in plants is excess light, which is the main factor leading to photoinhibition; this can be conceptualized as the circumstance in which the entry of photons is greater than the photosynthetic demand, generating excess energy (Lu et al., 2017). This process, characterized by a decrease in the efficiency of the photosynthetic process, can be followed by recovery (dynamic photoinhibition), or irreversible damage to the photosynthetic apparatus, which can lead to death (chronic photoinhibition) (Huang et al., 2016). The PSII is important in the photoinhibition responses, as it is considered the most sensitive component of the electron transport chain at high light (Huang et al., 2016). This is due to the high sensitivity of the D1 protein, which is part of the PSII complex; once damaged this protein can only be repaired if it is removed from the membrane, paralyzing electron transport (Michoux et al., 2016). In high light conditions, in addition to the photoinhibition process, excess energy promotes the formation of reactive oxygen species (ROSs) such as singlet oxygen, superoxide anion, hydroxyl radical, and hydrogen peroxide (Perez & Brown, 2014). In this way, photooxidation promotes the inactivation of the photosynthetic system, mainly due to damage to membranes and damage to the repair of the PSII, as well as damage to the photosystem I (PSI) (Lima-Melo et al., 2019; Lu et al., 2017), which can culminate in the reduction of plant productivity. This stress can promote an increase in the activity of the enzymatic antioxidant system, through enzymes such as catalase (CAT), superoxide dismutase (SOD), peroxidase (POX), ascorbate peroxidase (APX), and glutathione reductase (GR) (Lu et al., 2017). Antioxidant enzymes act in a coordinated way to protect plant cell structures under stress.
Although plants have strategies for tolerating WD and high luminosity conditions, for example, crop yields can be severely reduced under these conditions (Obermeyer, 2017). Although there is a direct relationship between the reproductive efficiency of the plants and the final product of the crops, the grains (Jumrani & Bhatia, 2018), however, there are few studies on the combination of abiotic stresses and their influence on the reproductive process of plants. The conditions of water restriction, whether or not associated with other abiotic stresses, cause the reduction of fertilization, the early abortion of embryos and, consequently, a smaller number of seeds or grains (Boyer & Westgate, 2004; Djanaguiraman et al., 2013; Prasad et al., 2008). Abortion of floral tissues (pollen or ovary) can occur due to decreasing water potential, the flow of carbohydrates or nitrogen, for example, and hormonal signaling (Pacini & Dolferus, 2019; Prasad et al., 2008). Under adverse conditions, such as abiotic stress, the development of the male gametophyte is one of the most affected (Mesihovic et al., 2016), with the productivity of several species limited by pollen sterility (Powell et al., 2012). While the effects of high temperatures on the viability and germination of soybean pollen grains are known (Djanaguiraman et al., 2013; Jumrani & Bhatia, 2018; Salem et al., 2007), little is known about the effects that WD and high light have on them.
Therefore, it was hypothesized that contrasting levels of irradiance induce different responses to WD in soybean plants, modulating anatomical, photosynthetic responses, related to antoxidant metabolism and osmoprotection, as well as biometric and reproductive characteristics and grain production (GP). Thus, the objective was to determine the changes caused by stress due to WD in soybean plants under contrasting irradiance in the photosynthetic, anatomical, biochemical, and productive characteristics of soybean plants.
2 MATERIALS AND METHODS
2.1 Experimental conditions and treatment imposition
The experiment was carried out in a growth chamber under a randomized block design with five replications and four treatments, in which the soybean plants were subjected to two irradiances 750 (medium irradiance, MI) and 1500 (higher irradiance, HI) μmol m−2 s−1 of photosynthetically active radiation (PAR) and two water regimes 90% (well-watered, WW) and 40% (WD) of field capacity (FC). The treatments were the combination of: WW + MI; WD + MI; WW + HI; and WD + HI. The growth conditions in the chamber were 65% relative humidity, temperature 25/20°C (day/night), and irradiance of 750 μmol m−2 s−1, during the development of the plants until the imposition of treatments (stadium R1), with a photoperiod of 12 h.
The soybean cultivar used was Desafio RR 8473 RSF (Brasmax Seeds, Cambé, Brazil). This cultivar has a medium size (0.60–0.85 m in height), an indeterminate growth habit, a cycle from 110 to 112 days, a flowering duration from 32 to 48 days, maturation group 7.4, small seeds, white flowers, and high demand in fertility (http://www.brasmaxgenetica.com.br/). Three soybean plants were grown in pots with 8.2 kg of substrate from the mixture of two parts of soil with one of sand. The acidity of the substrate in each pot was corrected by applying 4.5 g of dolomitic limestone with a relative neutralization power of 150%, 24% Ca, and 15% Mg. Each pot was fertilized with 4.6 g of the formulated fertilizer 10–10–10 (NPK) and 0.32 g of the formulated FTE BR12 (S = 3.2%; B = 1.8%; Cu = 0.18%; Mn = 2.0%; Mo = 0.1%; Zn = 9.0%), as a result of the physical–chemical analysis. The analysis showed the following results: pH H2O = 4.68; P = 0.9 mg dm−3; K = 8 mg dm−3; S = 3.9 mg dm−3; Ca = 0.9 cmolcdm−3; Mg = 0.4 cmolcdm−3; Al = 0.2 cmolcdm−3; H + Al = 3.1 cmolcdm−3; Na = 1.0 mg dm−3; Fe = 88.4 mg dm−3; Mn = 40.8 mg dm−3; Cu = 0.5 mg dm−3; Zn = 3.1; B = 0.3 mg dm−3; cation exchange capacity = 4.3 cmolcdm−3; base saturation = 30; aluminum saturation = 13.5; organic matter = 8.7 g dm−3; clay = 22%; silt = 8%; and sand = 70%.
At the beginning of the phenological stage R1, treatments were started and maintained for 13 days. The irradiance of 1500 μmol m−2 s−1 was imposed from 10 a.m. to 4 p.m., while from 7 a.m. to 10 a.m. and from 4 p.m. to 7 p.m. the irradiance was 750 μmol m−2 s−1 of PAR. Plants that were not exposed to greater light received a constant irradiance of 750 μmol m−2 s−1 from 7 a.m. to 7 p.m. The water regimes of 90 and 40% of the FC were imposed on each pot individually using the gravimetric method for the water control of the substrate. On the first day of imposition of the treatments, the plants under WD were already at 40% of the FC. After the 13 days under the treatments, the plants returned to the conditions of 750 μmol m−2 s−1 PAR and 90% CC.
2.2 Evaluations
The evaluations were carried out at 7 and 13 days after the imposition of treatments (DAIT), except for data related to GP that were mensured at the end of the soybean plant cycle.
2.2.1 Water relations
The water potential (ѰW) was measured using a pressure chamber of the Scholander type, between 4:00 a.m. and 6:00 a.m. in the morning. For the evaluation of leaf osmotic potential (ѰS), extraction of the cellular furrow of the leaves was performed and the readings were performed using an osmometer (VAPRO 5600, Elitech) (Pask et al., 2012). The values of ѰS were obtained using the following Van't Hoff's formula: ѰS = −R.T.Cs, where R is the universal gas constant (0.08205 L atm mol−1 K−1), T is the temperature, and Cs the concentration of the solution.
2.2.2 Curve A/PAR and night respiration
Using a portable infrared gas analyzer with coupled modulated fluorometer (IRGA, model LI6800, Li-Cor), a photosynthetic photon flux density (PPFD) variation between 0 and 2300 μmol m−2 s−1 was used, utilizing the light source (LI-6800-02B) of the LI-6800 with the respective values: 2300, 2100, 1900, 1700, 1500, 1300, 1100, 900, 700, 500, 300, 100, 50, and 0 μmol m−2 s−1. The measurements started after 5 min of acclimatization of the leaf to the condition of the first value of the PPFD (1500 μmol m−2 s−1) and only after the stabilization of the parameters of the net photosynthetic rate (A, μmol [CO2] m−2 s−1), transpiratory rate (E, mmol [H2O] m−2 s−1), and stomatal conductance (gs, mol [H2O] m−2 s−1). The CO2 concentration, the temperature of the block, and the relative humidity of the utilized were the same for gas exchange measurements.

Night respiration (RN, μmol [CO2] m−2 s−1) was measured before dawn using the same IRGA mentioned above.
2.2.3 Fluorescence image of chlorophyll a
Chlorophyll a fluorescence images were obtained with the aid of the Imaging-PAM modulated fluorometer (MAXI-Standard version, Heinz Walz). Initially, on leaves adapted for at least 30 min in the dark, the initial fluorescence (F0) and maximum fluorescence (Fm) were determined, where F0 is the minimum fluorescence yield, excited by a low intensity modulated red light (3 μmol m−2 s−1), and Fm is the maximum fluorescence obtained by applying a pulse for 0.8 s of saturating actinic light (>6000 μmol m−2 s−1). From which it was possible to calculate the potential quantum yield of photosystem II (PSII) (FV/FM = [Fm–F0]/Fm). The variables of the slow phase of fluorescence induction were obtained sequentially with the application of an actinic illumination for 30 s and a pulse of actinic saturating light to determine the variables: fluorescence in a sample adapted to light before the saturation pulse (F) and maximum fluorescence in a sample adapted to light (Fm′). From these parameters it was possible to calculate the minimum fluorescence of the illuminated plant tissue, F0’ = F0/[((Fm − F0/Fm) + (F0/Fm′)] (Oxborough & Baker, 1997). The effective quantum yield of photochemical energy conversion in PSII, ΦII = (Fm′ − F)/Fm′; the quantum yields of regulated energy dissipation, ΦNPQ = (F/Fm′) − (F/Fm) and unregulated energy dissipation, ΦNO = F/Fm, were calculated according to Genty et al. (1989) and Hendrickson et al. (2004). The ΦII was also used to estimate the apparent rate of electron transport, ETR = ΦII.RFA.LeafABS.0.5 (Bilger et al., 1995), where PAR is the photon flow (μmol m−2 s−1) incident on the leaves; LeafABS the value corresponding to the fraction of incident light that is absorbed by the leaves (Ehleringer, 1981); and 0.5 the value corresponding to the fraction of excitation energy distributed to the PSII (Laisk & Loreto, 1996).
2.2.4 Photorespiration and respiration during the day determination


Where; JT is the total rate of electron transport through PSII to photosynthesis and photorespiration; (Fm′−Fs)/Fm′ is the quantum efficiency of linear electron flow through PSII; PAR is the photosynthetically active radiation (photon flow, μmol m−2 s−1) incident on the leaf; 0.454 represents the proportional quanta used by PSII centers (Melis et al., 1987), JC and JO are the electron costs attributable to the carboxylation and oxygenase RuBP reactions, respectively; A is the net CO2 assimilation rate; RP is the rate of CO2 production by photorespiration; and RD is the rate of mitochondrial respiration during the day, which was measured at the time of the light curve analysis.
2.2.5 Photosynthetic pigments
Chlorophyll a (Chl a), chlorophyll b (Chl b), and total carotenoids (Carot) were measured according to Castro et al. (2019). Three leaf discs (0.6 cm2) were immersed in 5 mL of a dimethyl sulfoxide (DMSO) solution saturated with calcium carbonate and incubated at 65°C for 24 h. Absorbance was measured at 665.1, 649.1, and 480.0 nm in a UV–Vis spectrophotometer (model 60S, Thermo Scientific, Madison, Wisconsin), and the concentrations were calculated and expressed by the leaf area (Wellburn, 1994). Chlorophyll content was also evaluated using a portable meter, ClorofiLOG1030® (Falker®, Porto Alegre), with chlorophyll a, chlorophyll b and total chlorophyll content, expressed in the Falker® chlorophyll index.
2.2.6 Total soluble sugars and proline content
To determine the contents of total soluble sugars 200 mg of leaf tissue were immersed in ethanol 80%, heated for 30 min at 65°C, and ground. The extract was centrifuged, and three washes of the pellet were collected in a new tube. The ethanolic extract (supernatant) was used to determine the total sugars. For the quantification of total soluble sugars, the phenol-sulfuric method was used (Dubois et al., 1956). The absorbance was read at 490 nm and calculated using a standard sucrose curve (0–50 μg). Absorbance measurements were read with a UV–VIS spectrophotometer, and the results were expressed in milligrams per gram of fresh matter (mg g−1). In addition, 0.2 g of fresh leaf was used to measure free proline expressed in μmol g−1 FW (Bates et al., 1973).
2.2.7 Leaf malondialdehyde concentration
The content of MDA was evaluated to determine the lipid peroxidation using the method proposed by Heath and Packer (1968). Leaf samples (0.160 g) were homogenized in 2 mL 0.1% (w/v) trichloroacetic acid (TCA), and the homogenate was centrifuged at 12000 g for 15 min at 4°C. The supernatant (500 μL) was mixed with 2 mL of TBA reagent (0.5% [w/v] of TBA in 20% TCA). The reaction mixture was heated at 90°C for 20 min in a water bath and then quickly cooled in an ice bath and centrifuged at 3000g for 4 min. The absorbance of the colored supernatant was monitored at 440, 532, and 600 nm using a UV–VIS spectrophotometer (Evolution 60S, Thermo Fisher Scientific). The concentration of MDA was calculated using the molar extinction coefficient of 155 mM−1 cm−1 according to the following equation: MDA (nmol mL−1) = [(A532–A600)/155,000] 106. The concentration of MDA in leaves was expressed nmol TBA-MDA g−1 FW.
2.2.8 Activity of APX, SOD, CAT, and POX enzymes
For the determination of the activity of SOD, CAT, APX, and POX, approximately 0.3 g of leaf tissue was collected and macerated in a nitrogen mortar liquid containing 2 mL of the following extraction medium: potassium phosphate buffer (50 mM, pH 6.8), ethylene diaminetetraacetic acid (EDTA, 0.1 mM), phenylmethylphonic fluoride (PMSF, 1 mM), and polyvinylpyrrolidone (PVP, 2%). The enzymatic extract was centrifuged at 12000g for 15 min at 4°C. The supernatant was used as a crude extract.
SOD (EC 1.15.1.1) activity was determined by measuring the ability to photochemically reduce p-nitrotetrazole blue (NBT) according to Del Longo et al. (1993). The reaction was started by the addition of 10 μL of the crude enzyme extract to 280 μL of a mixture containing 50 mM potassium phosphate buffer (pH 7.8), 13 mM methionine, 0.075 mM NBT, 0.1 mM EDTA, and 0.002 mM riboflavin. The reaction occurred at 25°C under a 15-W lamp. After 15 min of light exposure, the light was interrupted and the production of formazan blue—which resulted from the photoreduction of NTB—was monitored by the increase in absorbance at 560 nm using a microplate reader (VersaMax, Molecular Devices). Controls for each sample were obtained from aliquots maintained in the light during the reaction time. One SOD unit was defined as the amount of enzyme required to inhibit NBT photoreduction by 50% and was expressed in U min−1 mg−1 protein.
CAT (EC 1.11.1.6) activity was assayed according to the method described by Havir and McHale (1987). The reaction consisted of 10 μL of the crude enzyme extract and 990 μL of a solution containing potassium phosphate buffer (100 mM; pH 6.8) and H2O2 (12.5 mM). The CAT activity was determined by the rate of H2O2 decomposition at 240 nm in a UV–Vis spectrophotometer for 1.5 min at 25°C. An extinction coefficient of 36 M−1 cm−1 was used to calculate the CAT activity, which was expressed as min−1 mg−1 protein.
APX (EC 1.11.1.11) activity was determined according to Nakano and Asada (1981). The reaction consisted of 50 μL of the crude enzyme extract and 1.95 mL of the reaction solution containing potassium phosphate buffer (50 mM; pH 6.0), H2O2 (1 mM), and ascorbate (0.8 mM). The APX activity was measured by the rate of ascorbate oxidation at 290 nm using a UV–Vis spectrophotometer for 3 min at 25°C. An extinction coefficient of 0.0028 M−1 cm−1 was used to calculate the APX activity, which was expressed as μmol min−1 mg−1 of protein.
POX (EC 1.11.1.7) activity was determined by the addition of the crude enzyme extract to a reaction mixture containing 25 mM potassium phosphate buffer (pH 6.8), 20 mM pyrogallol, and 20 mM hydrogen peroxide (Kar & Mishra, 1976). The reaction was measured at 420 nm in a UV–VIS spectrophotometer for 1 min at 25°C. An extinction coefficient of 2.47 mM−1 cm−1 was used to calculate POX activity and was expressed as μmol min−1 mg−1 of protein (Chance & Maehly, 1955).
The enzyme activity was expressed based on protein, the concentration of which was determined according to the method of Bradford (1976).
2.2.9 Leaf morphoanatomical characterization
Samples (approximately 3 cm2) from the middle region of fully expanded leaves developed during the treatment period were collected and fixed in Karnofsky's solution. After 24 h, the material was pre-washed in phosphate buffer and dehydrated in a gradual ethyl alcohol series, pre-infiltered, and infiltered in historesin (Leica) according to the manufacturer's recommendation. Samples were then transversely sectioned to a 5-μm thickness in a rotating microtome (1508R model, Logen Scientific). Sections were stained with toluidine blue (0.05% in 0.1 M phosphate buffer, pH 6.8) (O'Brien et al., 1964) and anatomical observations of adaxial and abaxial epidermis, palisade, and spongy parenchyma and mesophyll were made using images photographed with an Olympus microscope (BX61, Olympus) coupled to a DP-72 camera using the light-field option. The micromorphometry measurements were obtained from the previous images using ImageJ software (Image Processing and Analysis in Java, v. 1.47). Ten observations per replicate were measured for each structure evaluated.
2.2.10 Viability and germination of pollen grains
Five flower buds and inflorescences were collected, fixed in Carnoy and stored in a freezer at −20°C. Blades were made by macerating anthers of two flower buds in 1% acetic carmine. Pollen viability was estimated by counting approximately 300 pollen grains per experimental unit with the aid of a binocular biological microscope (Leica), with a 10× magnification objective. Stained pollen grains were considered viable, while empty or weakly stained grains were considered unfeasible.
The culture medium for the germination of soybean pollen grains was prepared with a solution containing 15% sucrose, 0.03% Ca(NO3)2, 0.01% H3BO3, and 0.5% agar (Koti et al., 2004). Freshly collected mature pollen grains were germinated at room temperature and images were recorded after 30 min. After germination, the slides were evaluated using a Leica binocular biological microscope. Pollen grains were considered to have germinated when the size of the pollen tube exceeded the diameter of the pollen grain itself. Hundred pollen grains were counted per plant.
2.2.11 Morphological analysis and GP
The plants were measured at 13 DAIT to determine the morphological variables: plant height (H, cm), number of leaves (NL), stem diameter (SD, mm), number of pods (NP), and number of branches (NB). Leaves, stems, and pods were packed in paper bags and dried in an oven with forced air circulation (65°C) until a constant weight was obtained, as the leaf dry matter (LDM, g), stem dry matter (SDM, g), and pod dry matter (PDM, g). Using the ImageJ® software, the leaf area (LA, cm2) was calculated, and for the ratio between LA and LDM, the specific leaf area (SLA, cm2 g−1) was obtained. At the end of the soybean cycle, GP (g) and the number of grains (NG) were also determined.
2.2.12 Experimental design and statistical analysis
The experimental design was in randomized blocks with five replications and treatment in a 2 x 2 factorial scheme: Factor A - field capacities of 90% (WW) and 40% (WD); Factor B - irradiance of 750 and 1500 μmol (photons) m−2 s−1. The data were evaluated for homogeneity of variance (Bartlet test) and normality of errors (Shapiro–Wilk test) and, when significant, Box-Cox transformation was used (Box & Cox, 1964). When the transformation was necessary, the transformed data were again analyzed to verify normality and homogeneity. Having met the prerequisites, analysis of variance was performed to verify the effects of the isolated factors and their interaction (F-test, α < 0.05). The analyzes were performed using Software Action Pro®. Graphs were generated using SigmaPlot® software (Systat Software v.10.0).
3 RESULTS
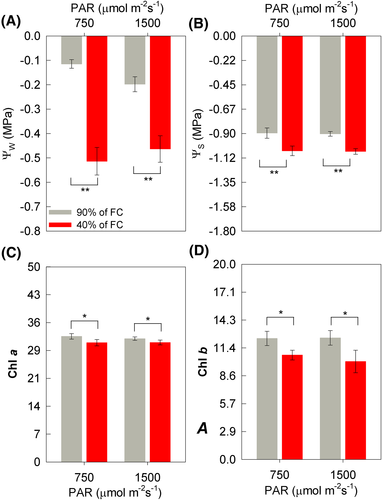
At seven days after the imposition of treatments (DAIT), the leaf water potential (ᴪw) and leaf osmotic potential (ᴪs) of soybean plants were reduced due to WD stress in both irradiance conditions (Figure 1A,B). The ᴪw was approximately 350 and 135% lower in the conditions of medium irradiance (MI = 750 μmol m−2 s−1) and high irradiance (HI = 1500 μmol m−2 s−1), respectively. In addition, ᴪs was 19% and 18% lower in WD + MI and WD + HI conditions when well-watered (WW) conditions were compared at the same level of irradiance. However, ᴪw and ᴪs did not differ depending on the light conditions (Figure 1A,B). The chlorophyll a (Chl a), and b (Chl b) content of soybean plants differed only as a function of soil humidity levels (Figure 1C,D), in which WD stress reduced Chl a index by 5% (MI) and 3% (HI), and Chl b by 14% (MI) and 19% (HI), respectively.
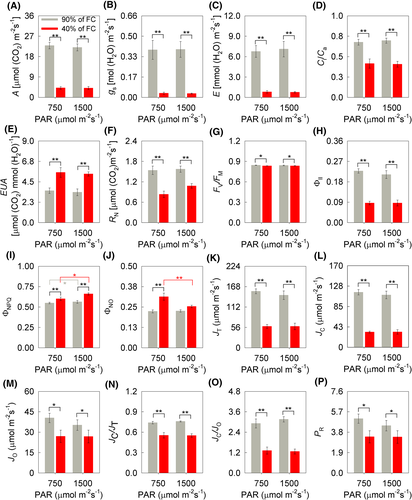
The variables related to gas exchange at seven DAIT differed only according to soil moisture levels. Thus, there was a lower photosynthetic rate (A), stomatal conductance (gs), and transpiratory rate (E) were 82, 91, 88% lower due to WD (Figure 2A–C). The ratio between the internal and external CO2 concentration (Ci/Ca) was also 39% (MI) and 42% (HI) lower in WD conditions (Figure 2A–D). However, water use efficiency (WUE) was 57% (MI) and 61% (HI) higher under WD conditions (Figure 2E); additionally, nocturnal respiration (RN) was 46% (MI) and 31% (HI) lower in WD-treatment (Figure 2F). The potential (FV/FM) and effective (ΦII) quantum yield of PSII of soybean plants differed according to the different soil moistures; o FV/FM approximately 1% lower in WD conditions, while ΦII, 61% (MI) and 68% (HI) (Figure 2G,H). The quantum yield of regulated energy dissipation of PSII (ΦNPQ) was 3% (WW) and 18% (WD) higher due to HI, also observing a difference between soil moisture, about 11% (MI) and 10% (HI) higher under WD conditions (Figure 2I). For the quantum yield of the unregulated energy dissipation of PSII (ΦNO), there was significance for the interaction between soil humidity × irradiance (P = 0.006) (Figure 2J). Thus, there was a difference between soil moisture only in the MI condition, where ΦNO was 41% higher in WD (Figure 2J). It is also observed that ΦNO was 19% higher in a WD + MI than in a WD + HI (Figure 2J). The variables related to the electron partition differed according to the different soil humidities (Figure 2K–P). The total electron flow (JT), the electron flow destined for carboxylation (JC) and oxygenation (JO) by Rubisco, the JC/JO and JC/JT ratios and the photorespiration rate (PR) were lower in the WD conditions (Figure 2K–P). It is noteworthy that JC was approximately 72% lower in WD conditions, whereas PR was 33% (MI) and 24% (HI) also lower when compared to WW condition (Figure 2L and 2P).
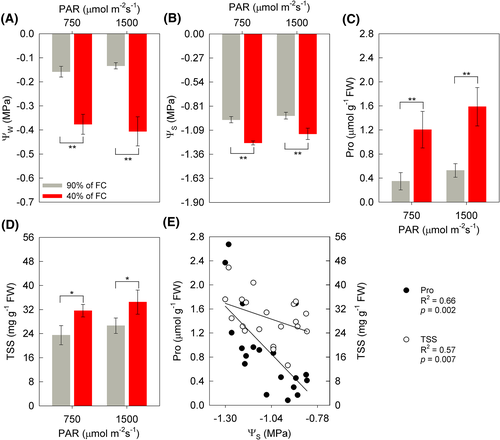
The interaction between soil humidity and irradiance was not significant for the parameters of ᴪw and ᴪs at 13 DAIT. However, there was a difference between soil moisture, with lower values observed under WD conditions, about 139% (MI) and 205% (HI) (Figure 3A,B). The concentrations of the amino acid proline (Pro) increased as a function of WD by 247 and 202% under MI and HI conditions, respectively. This difference as a function of soil moisture was also observed for the concentration of total soluble sugars (AST), with increases of 34% (WD + MI) and 29% (WD + HI) (Figure 3C,D). In addition, a negative correlation between Pro and ASR was observed with ᴪs (Pearson's—[P = 0.02; R2 = 0.66] and [P = 0.007; R2 = 0.57], respectively [Figure 3E]).
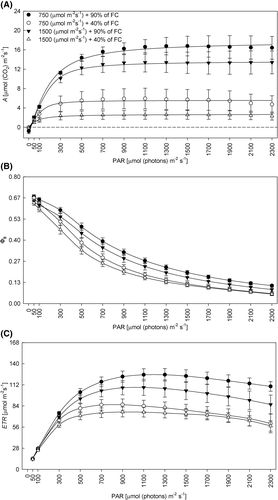
In the A, ΦII, and electron transport rate (ETR) curve as a function of PAR, the highest values recorded were for plants under WW conditions (Figure 4A–C). The lowest values of A, ΦII, and ETR were found in the WD conditions, regardless of the light condition (Figure 4A–C).
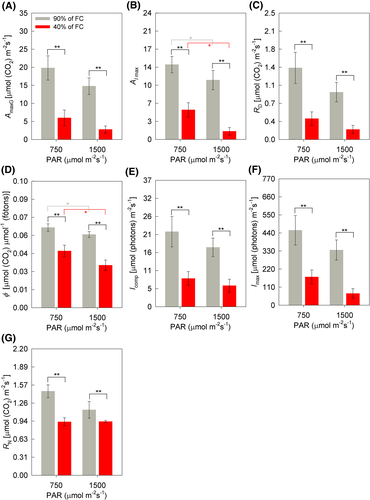
For the parameters related to the A/PAR curve, the interaction between soil humidity × irradiance was not significant (Figure 5A–F). The maximum gross photosynthetic rate (AmaxB), respiration in the dark (RE), compensation irradiance (Icomp), and maximum saturation irradiance (Imax) differed in the function of the different soil humidities, being lower in the WD condition (Figure 5A,C,E,F). It is noteworthy that AmaxB reduced 70% (MI) and 81% (HI) due to WD. The liquid photosynthesis at the point of greatest irradiance (AI max) and the apparent quantum efficiency (ϕ) also differed due to the different soil humidities, marking lower values in the WD condition, though there was also a difference due to the different irradiance, where the lowest values seen were in HI, 21% (WW) and 72% (WD) for AI max and 8% (WW) and 24% (WD) for ϕ, showing the impact of HI under the photosynthetic process, in especially when combined with WD (Figure 5B,D). Leaf respiration in the dark (RD) was 26% (MI) and 18% (HI) lower under WD (Figure 5G).
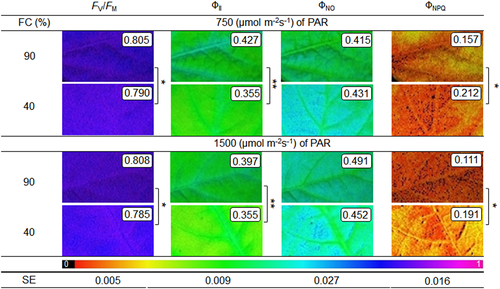
The potential quantum yield of PSII (FV/FM), and effective quantum yield of PSII (ΦII) were lower in the WD, differing only according to the soil humidity factor (Figure 6). The reduction in FV/FM as a function of WD was 2 and 3% in MI and HI, respectively. However, a more prominent decrease was observed for ΦII in relation to WW conditions, approximately 17% (WD + MI) and 11% (WD + HI). The quantum yield of regulated energy dissipation (ΦNPQ) increased in WD conditions, mainly in the HI condition (72%), and 35% in the MI in relation to WW-treatment. The interaction between soil humidity × irradiance was not significant. The quantum yield of unregulated energy dissipation (ΦNO) did not differ according to treatments (Figure 6).
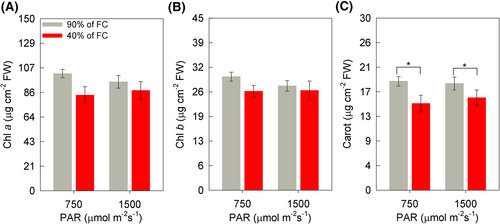
The chlorophyll a (Chl a) and chlorophyll b (Chl b) contents did not differ between treatments (Figure 7A,B). However, the carotenoid (Carot) contents differed due to the soil humidity factor, with lower values verified in WD + MI (20%) and WD + HI (13%) (Figure 7C).
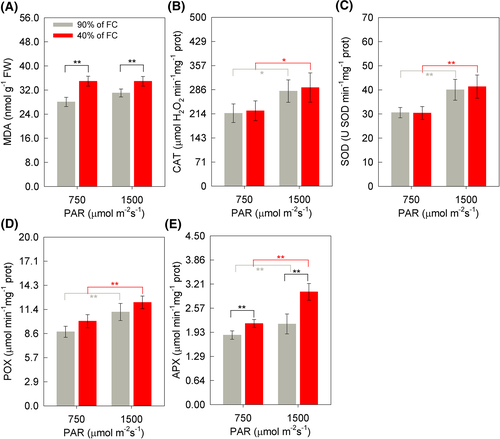
The MDA content was higher in soybean plants in the WD, with an increase of 24% (WD + MI) and 12% (WD + HI), differing only to the detriment of the soil humidity factor (Figure 8A). In the evaluation of the enzymatic antioxidant system of soybean plants, there was a difference between treatments for the irradiance factor (Figure 8B–E). Therefore, greater activity of the antioxidant enzymes CAT, SOD, POX, and APX was observed in the light condition of HI (Figure 8B–E). HI increased CAT activity by 30% in both soil moisture. SOD activity was 31 and 36% higher under WW + HI and WD + HI, respectively. The additions for POX were 27% (WW + HI) and 22% (WW + HI), whereas for the APX activity it was 16% (WW + HI) and 39% (WD + HI). It is also noteworthy, greater activity of APX in the condition of WD, which was about 17% (MI) and 40% (HI) higher than in well-watered plants, because this enzyme also differed in the function of different soil moisture (Figure 8E).
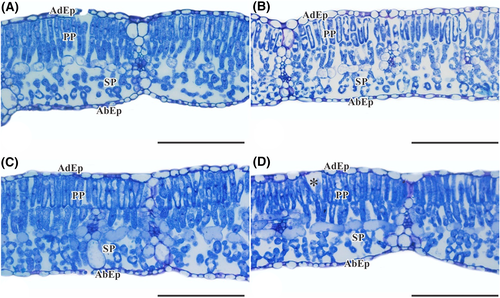
As for the anatomical parameters, it was found in the soybean leaves that the palisade parenchyma (PP) is composed of two to three layers of elongated and narrow cells (Figure 9). These cells are turned toward the adaxial surface of the leaf, juxtaposed, with reduced intercellular spaces that occur below the epidermis on the adaxial epidermis (AdEp) (Figure 9). The spongy parenchyma is formed by irregularly shaped isodiametric cells, with intercellular spaces located above the epidermis on the abaxial surface (Figure 9). Mesophyll is heterogeneous with a dorsiventral organization. It was observed that the cultivation of soybean plants is the WD condition and HI caused an increase in intercellular spaces in the PP region in relation to the other conditions (Figure 9D).
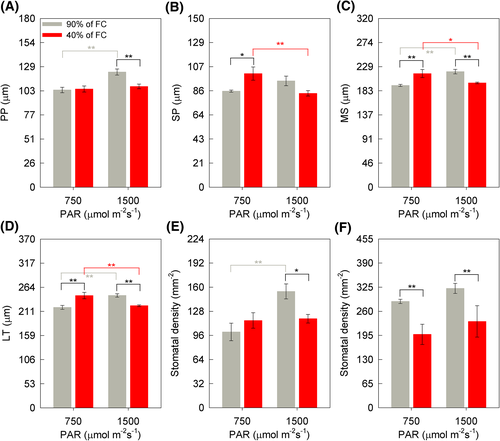
There was no difference in the AdEp thickness and abaxial epidermis (AbEp) of soybean leaves depending on the treatments imposed. The mean and standard error (SE) values for AdEp and AbEp were, respectively, (11.52 ± 0.66 μm) and (10.49 ± 0.74 μm). However, the interaction between soil humidity × irradiance factors was significant for the thickness of: PP (P < 0.001), spongy parenchyma (SP) (P = 0.003), mesophyll (MS) (P < 0.001), and leaf (LT) (P < 0.001) (Figure 10A–D). Therefore, it is observed that in the HI, the thickness of PP was 12% greater for plants maintained in the WW than in those maintained in the WD (Figure 10A). In addition, in WW-treatment, PP thickness was 18% higher in soybean plants in the HI condition compared to MI (Figure 10A). The thickness of SP, in the WD + MI condition, was 18% greater than in WW + MI (Figure 10B). It was also found that SP thickness of the plants was 17% greater in WD + MI when compared to WD + HI (Figure 10B). MS and LT thickness were 12% greater in the WD + MI, while the inverse was verified in the WD + HI, with a 10% reduction in relation to the WW-treatment (Figure 10C–D). In addition, there was a 9% greater thickness of MS and LT in WD-treatment for plants subjected to less irradiance (Figure 10C–D). In plants under WD, the thickness of MF and LT was 9% less in the condition of greater irradiance (Figure 10C–D). The interaction between soil humidity × irradiance was significant for the stomata density of the adaxial epidermis (P = 0.0242) (Figure 10E). Higher stomatal density was observed in the adaxial epidermis in the WW + HI condition, about 53% higher than WW + MI (Figure 10E). There was also a difference between soil humidity for stomata density in the adaxial epidermis only in the HI environment, with a 23% lower density in the WD condition (Figure 10E). For stomata density of the abaxial epidermis, there was a difference only for the soil humidity factor, as lower values were observed in the WD conditions, about 30%, regardless of the luminosity (Figure 10F).
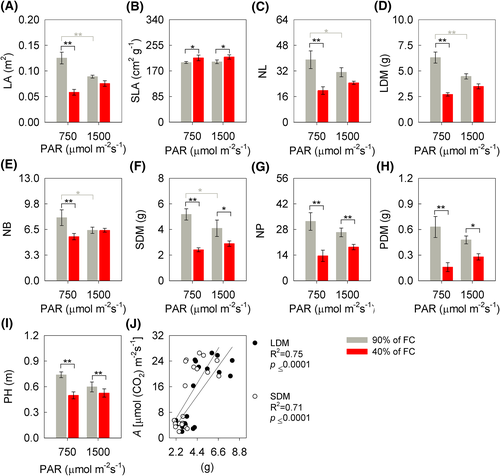
The biometric characteristics of soybean plants differed according to the treatments, except for the stem diameter (mean = 5.77; SE = 0.31 mm). The interaction between soil humidity x irradiance was significant for the leaf area (LA) (P = 0.002), NL (P = 0.025), leaf dry mass (LDM) (P = 0.021), number of branches (NB) (P = 0.004), stem dry mass (SDM) (P = 0.037), and pod dry mass (PDM) (P = 0.0341). It was found that, in the WD + MI the LA, NL, LDM, and NB of the soybean plants were 53, 49, 57, and 30% smaller, respectively than WW + MI (Figure 11A,C–E). In WW-treatment, LA, NL, LDM, and NB were 30, 20, 29, and 20% higher in the condition of HI, respectively, than in the condition of less irradiance (Figure 11A,C–E). SDM was 53% (MI) and 29% (HI) lower in WD conditions (Figure 11F). There is also, for SDM, a reduction of 21% as a function of HI among WW plants, when compared to MI (Figure 11F). The variable of specific leaf area (SLA) was 8% higher in WD conditions, regardless of the light condition (Figure 11B). The variables of number of pods (NP), and plant height (PH) differed only as a function of soil humidity, with lower values recorded for WD, with NP 58% (MI) and 30% (HI) lower, and PH 34% (MI) and 11% (HI) (Figure 11G,I). For PDM, lower values were recorded to the detriment of WD in both irradiances, about 76% (MI) and 42% (HI) (Figure 11H). Additionally, it was observed that LDM and SDM correlated positively with A (Pearson's — [P < 0.001; R2 = 0.75] and [P < 0.001; R2 = 0.71], respectively [Figure 11J]).
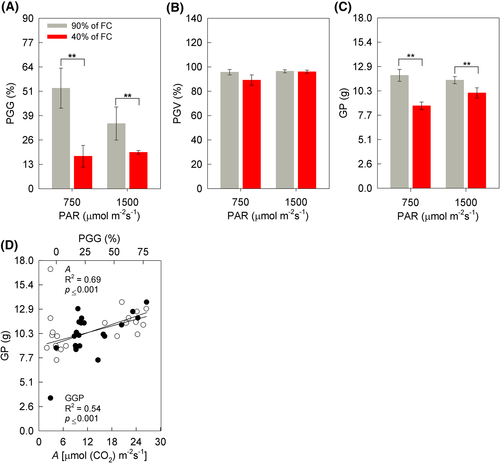
The germination percentage (PGG) and viability (PGV) of the pollen grains of the soybean plants were also determined at 13 DAIT (Figure 12A,B). The percentage of PGG differed only due to the soil humidity factor, 68% (MI) and 53% (HI) lower for plants under WD (Figure 12A). On the other hand, there was no difference between treatments for PGV, with an average value of 94% (Figure 12B). The interaction of soil humidity × irradiance was not significant for GP (Figure 12C). However, a 27% (MI) and 12% (HI) lower GP was observed for plants grown in WD, with a difference only for the soil moisture factor (Figure 12C). Finally, the variables of A and PGG correlated positively with GP (Pearson's correlation — [P = 0.001; R2 = 0.69] and [P < 0.01; R2 = 0.54], respectively [Figure 12D]).
4 DISCUSSION
The WD-treatment (40% of soil FC) reduction the leaf water potential (ᴪw) and the leaf water content in soybean plants (Figures 1A and 3A). A decrease in the ᴪw was also observed in other soybean cultivars, including Desafio®, in a previous study (Castro et al., 2019). Like the ᴪw, the osmotic potential on the leaf (ᴪs) was also reduced under WD, which may have two possible explanations (Figures 1B and 3B). The first factor that can lead to a reduction ᴪs is a decrease in water content in the cell, thus resulting in an increase in the concentration of solutes. The second factor is higher values of ᴪs as an indication of the accumulation of osmotically active compounds in cells, this being an important strategy for maintaining cell turgor (Batista et al., 2018; Parveen et al., 2019). This osmotic adjustment is important for plants to continue absorbing water, even under conditions of water restriction (Monteiro et al., 2014). Among the various accumulated compounds, we highlight polyamines, soluble sugars, calcium, potassium, organic acids, glycine, and proline (Pro) (Khan & Komatsu, 2016; Raja et al., 2020).
The increase in the concentration of Pro and total soluble sugars (TSS) in WD (Figure 3C,D) proved to be a strategy to mitigate the deleterious effects of stress due to WD (Batista et al., 2019, Castro et al., 2019, Kosar et al., 2020). This could be verified in this study through the correlation between the increased concentration of Pro and AST with the ᴪs of the plants (Figure 3E). In addition to acting as an osmolyte, the antioxidant role of Pro stands out as a non-enzymatic mechanism against ROS in plants under WD (Rivas et al., 2017), converting the OH radical in water (Azmat & Moin, 2019).
The reduction in CO2 assimilation of soybean plants observed at the photosynthetic rate (A), the maximum gross photosynthetic rate (AmaxG), and liquid photosynthesis at the point of maximum irradiance (AI max) (Figures 2A, 3A, and 5A,B) is due largely to stomatal closure, a widely known strategy, and a reduction in the stomatal density during the stress period (Figure 11F). The limitation of stomatal opening in WD conditions prevents the loss of water from the leaf to the atmosphere, which resulted in a decrease in the transpiratory rate (E) and an increase in the water use efficiency (WUE) (Figure 2C,E). In addition, the decrease in the ratio between the internal and external CO2 concentration (Ci/Ca) (Figure 2D) is an indication of no evident damage to the Calvin Benson cycle and, consequently, the enzyme Rubisco (Castro et al., 2019). The reduction in CO2 concentration in the sub-stomatal chamber is another indication of stomatal closure (Buezo et al., 2019).
Corroborating the results of gas exchange, the decrease in the total flow of electrons (JT) and electron flow destined for RuBP carboxylation (JC) and the lower ratios between JC/JO and JC/JT show the decrease in carboxylation activity by Rubisco in the condition of WD (Figures 2K,L and 5N,O). Although the flow of electrons destined for RuBP oxygenation (JO) and photorespiration rate (PR) differed between treatments (Figure 2M,P), the low Ci/Ca ratio, associated with lower values of JC/JO and JC/JT in WD conditions, is indicative of a higher proportion of electrons for the assimilation of O2 to the detriment of CO2. It is known that PR is an important drain of excess electrons in stress conditions (Bai et al., 2008; Silva et al., 2015), avoiding damage to the photosynthetic apparatus, through the consumption of the generated ATP in the photochemical stage (Rivas et al., 2017; Sousa et al., 2020). The increase in nocturnal respiration (RN) has also been reported to be an important alternative electron drain (Rivas et al., 2017). In this study, there was no increase in RN and PR (Figures 2F and 5P), however, the percentage reduction in PR (33% for MI, and 24% for HI) was less than that of JC, which was approximately 71%, demonstrating that they were not especially important electron drains, but acted in this stress condition.
The reduction of AmaxG, AImax, compensation irradiance (Icomp), and maximum saturation (Imax) light due to the WD indicate that the photosynthetic capacity of the plants was limited (Figure 5A,B,E,F). In addition, a more pronounced decrease for Imax and apparent quantum efficiency (ϕ) was observed under the higher irradiance (HI) in both soil humidities (Figure 5B,D), indicating that the decrease in photosynthetic efficiency occurred in a more pronounced way due to the combined stress (WD + HI). This is probably due to the high luminosity in the WD + HI-treatment, as the plants did not increase the thickness of the spongy parenchyma (SP) to optimize the gas exchange, as occurred in the WD + MI (Figure 11B). The values considered ideal ϕ vary from 0.04 to 0.06 (Dalmagro et al., 2014; Lobo et al., 2013; Yao et al., 2017), while values below 0.04 were verified in soybean plants under WD + HI, which was 24% lower than in WD + MI.
The narrow difference between soil humidity for the maximum quantum yield of PSII (FV/FM) and the maintenance of the values of this parameter close to 0.80 (Figures 2G and 6) demonstrate that there was no photoinhibition of the plants (Dąbrowski et al., 2019; Maxwell & Johnson, 2000). This was also observed by Castro et al. (2019) and Sousa et al. (2020), in soybean plants under WD. At 13 DAIT the reduction was greater (2% to WD + MI and 3% to WD + HI), but still small. Corroborating these results, the reduction in the content of chloroplast pigments (chlorophyll a and b) at 7 DAIT (Figure 1C,D), and of carotenoids (Carot) at 13 DAIT (Figure 7C), was not at a high level, the greatest reduction in Carot occurred in WD + MI, whereas in WD + HI it was only 13%. As a result, the plants showed lower photochemical efficiency in conditions of lower soil humidity, as observed by the values of the effective quantum yield of PSII (ΦII) and JT (Figure 2H,K), a similar reduction was observed in sunflower plants under WD (Almeida et al., 2020). The dissipation of surplus light energy occurred by non-photochemical pathways, as observed in the quantum yield of unregulated energy dissipation of PSII (ΦNO) and the quantum yield of regulated energy dissipation of PSII (ΦNPQ), mainly at 13 DAIT, with an increase of 72% of this parameter in WD + HI, indicating that the high irradiance stimulated this defense response of the plant, which was not so prominent in WD + MI (35% increase) (Figure 2I,J). The dissipation of non-photochemical energy occurs through the xanthophyll cycle, which is activated by protonation of the lumen of the thylakoid (Ruban, 2016), leading to de-epoxidation of violaxanthin and forming zeaxanthin through anteraxanthin (Kromdijk et al., 2016; Mathur et al., 2018). Thus, the regulated energy dissipation associated with the xanthophyll cycle, verified by the ΦNPQ, acts to prevent the formation of free radicals (Kramer et al., 2004). Also, there was dissipation of constitutive energy and fluorescence itself, by means of ΦNO, indicating that the photochemical energy conversion and the regulatory protection mechanisms were inefficient (Kramer et al., 2004). Thus, the ΦNPQ acted as a mechanism to protect the photosynthetic apparatus against excess excitation energy, with the objective of preventing the formation of ROS under WD + HI conditions (Cardona et al., 2018). Interestingly, at 7 DAIT in the WD + MI condition the values of ΦNO were higher than in the condition of WD + HI (Figure 2J), showing a greater level of damage to the photosynthetic apparatus under these conditions, indicating that initially the largest ΦNPQ em WD + HI was important in preventing damage to plants. In the case of combined stress, the HI differentiates the responses to the WD, when checking the parameters about the photosynthetic process together. Thus, parameters of chlorophyll a fluorescence and gas exchange measurements can be excellent indicative of the stress level, as well as the tolerance or not of the combination of stress factors (Dąbrowski et al., 2019).
In the photochemical stage, PSI is one of the main sites of ROS formation, either due to the lower regeneration of NADP+, due to stomatal limitation and reduction of A due to WD, or due to excessive irradiance (Buezo et al., 2019; Lu et al., 2017). Because PSI ferredoxin is a strong reducer, it can easily photoreduce molecular oxygen to superoxide anion (O2•–), competing with the formation of NADPH (Asada, 1999). In this study, greater activity of the SOD enzyme was observed in soybean plants to the detriment of greater irradiance (Figure 8C). Because the increase in its activity is indicative of the increase in the formation of O2•–, SOD is considered the first line of defense against damage caused by ROSs in the photochemical stage, dismuting O2•– in H2O2 (Locato et al., 2018). Possibly, the increase in the amount of H2O2 in this study was not due to the increase in PR, as these values did not increase due to the WD condition (Figure 2P). However, the higher concentration of MDA in WD conditions (Figure 8A) is indicative of possible damage to membranes by lipid peroxidation (Spicher et al., 2016). The increase in PR is a plant strategy capable of minimizing the production of ROS in the chloroplast, as it is also an ATP drain produced in the photochemical step and, thus, keeping it in operation (Allan et al., 2009). However, the formation of H2O2 at toxic levels generally occurs with the exposure of plants to stress conditions for longer periods (Bai et al., 2008, Silva et al., 2015). The increase in H2O2 in peroxisomes is controlled mainly by the activity of the enzyme CAT, which is the most abundant protein in this organelle (Foyer & Noctor, 2003). CAT activity differed only between the different irradiances (Figure 8B), confirming that H2O2 did not rise to very toxic levels due to PR. In addition to CAT, APX and POX act in the removal of H2O2 (Abedi & Pakniyat, 2010). Thus, when the activity of APX was increased in soybean plants as a function of WD + HI (Figure 8E), it is hypothesized that the greatest production of H2O2 occurred in chloroplasts, which may be related to the 72% increase in ΦNPQ in this combined stress condition. Additionally, Silva et al. (2015) observed greater APX activity due to increased expression of the gene encoding the protein, compensating for the deficiency of CAT activity, which acts predominantly in the peroxisome. These results corroborate the higher SOD activity in plants under higher irradiance.
POX activity also increased due to light stress (Figure 8D), as was observed for SOD, CAT, and APX. This enzyme acts on the decomposition of H2O2, using it as an acceptor of electrons from the oxidation of phenolic compounds (Jóźwiak & Politycka, 2019). Vital et al. (2019) found, in an experiment with the same soybean cultivar as in this study, an increase in POX activity, however, due to high temperature stress. Taken together, the photoprotective role of the antioxidant system of soybean plants stands out, due mainly to the HI condition, as evidenced by the greater activity of CAT, APX, SOD, and POX, without reduction of A. However, at 13 DAIT, in the WD + HI condition the AI max was reduced. This makes evident the lower photosynthetic capacity of soybean plants under saturating conditions of irradiance.
In this study, the reduction (68% to WD + MI and 53% to WD + HI) in the pollen grain germination (PGG) of soybean plants as a function of WD (Figure 12A) occurred even without the reduction of pollen grain viability (PGV) (Figure 12B). In relation to WW plants, the percent of PGG was like that observed in other studies, as well as those of plants under WD only (Cohen et al., 2020b). It is known that the growth of the pollen tube can be impacted by WD, by high temperatures, and the combination of these stresses (Cohen et al., 2020b). The combination of WD + HI is still little studied; however, it is observed that there was no effect of HI on the germination of pollen grains. In addition, the following question arises: why did viable pollen grains germinate to a lesser extent under WD conditions? A possible hypothesis is the reduction of water content in the plant tissues, due to the WD. It is noteworthy that the reduction in leaf ᴪw is not always like that of floral tissues, including pollen grains (Westgate et al., 1996). Additionally, though not necessarily, the reduction in ᴪw is linked to the decrease in water content in tissues. Still, it is known that the occurrence of WD during the reproductive phase can affect the germination and growth of the pollen tube of plants (Alqudah et al., 2011). However, the effects of WD on soybean pollen grains are still poorly studied. Also, it is known that in these adverse conditions, osmotic adjustment of pollen grain cells is necessary, so that germination can occur, through the growth of the pollen tube (Obermeyer, 2017). Thus, it is believed that, under the condition of water restriction, this osmotic adjustment has not adequately occurred, with the desiccation of pollen grains occurring when they were still under the anther. The signaling of the occurrence of stress factors such as WD and HI in pollen grains is carried out by the mother plant while they are still attached to the anther, and the adjustment of the water status of the pollen grains can be induced (Dolferus & Pacini, 2019). The level of this adjustment depends on the characteristics of the pollen grains of each species and can be recalcitrant (does not tolerate desiccation) or orthodox (has a greater tolerance of desiccation) (Dolferus & Pacini, 2019). However, there are no reports yet on whether pollen grains from soybean plants are recalcitrant or orthodox. Considering the reduction of PGG in WD conditions, it is suggested that soybean pollen grains are recalcitrant. Because it is an autogamous species, by the time the flowers open, fertilization has already occurred. This decreases the time of exposure of pollen grains to unfavorable environmental conditions (Djanaguiraman et al., 2013; Obermeyer, 2017; Prasad et al., 2008); therefore, this reproductive characteristic may be an evidence that the pollen grains of soybean plants are recalcitrant, highlighting the need for further studies to describe these characteristics. It is noteworthy that, in this study, the only unfavorable conditions were those of WD and HI, since the relative humidity of the air throughout the experiment was maintained at 60%.
The decrease in the leaf area (LA), NL, LDM, number of branches (NB), and SDM as a function of WD + HI were due mainly to the limitation of CO2 assimilation to the detriment of water restriction (Figure 11A,C–F). The reduction to the detriment of greater irradiance, even in HI, is due to the greater energy demand by plants through the greater activity of antioxidant metabolism. Corroborating these results, Castro et al. (2019), in an experiment with different soybean cultivars, including Desafio®, also found a decrease in LA due to WD stress.
The effect of different light intensities on the leaf morphological parameters of plants has been extensively studied (Wu et al., 2017). The greater leaf thickness (LT) in the WW + HI condition was due to the greater thickness of the palisade parenchyma (PP) (Figure 10A,D), which is associated with the maintenance of photosynthetic efficiency in conditions of HI (Hussain et al., 2019b). It is interesting to note that the greater stomatal density on the adaxial face in WW + HI, which may be related to the greater thickness of PP and a greater capacity of the photosynthetic photosynthetic machinery and, consequently, gas exchange for greater density of stomata. The highest LT in the condition of WD + MI occurred due to the greater thickness of the spongy parenchyma (SP) (Figure 11B), and its function is to collaborate with the gas exchange, especially of CO2 in the mesophyll, by means of greater intracellular spaces, because of the reduction of gas in plants exposed to treatments with WD. This was also observed by Makbul et al. (2011) in soybean plants submitted to WD, denoting a greater thickness of SP and LT. This is associated with greater mesophilic conductance in WD conditions, also reflecting a greater specific leaf area (Buezo et al., 2019). However, when the stress was combined, the anatomical changes were differential, with lower values of thickness of PP, SP, and mesophyll, resulting in a limitation of gas exchange and, consequently, reduced production of photoassimilates, reflecting the growth of plants. Corroborating these results, a lower stomatal density was found in WD, either on the adaxial or abaxial surface of the leaves, which is a clear strategy to limit water loss, together with others previously mentioned.
The reduction in plant height (PH) and the number of branches (NB) of WD + HI soybean plants (Figure 11E,I), as well as the lower LDM and SDM values, were mainly to the detriment of the decrease in A (Figure 11J). This can be seen by the correlation between the variables (Figure 11J), in which the decrease in CO2 assimilation resulted in less allocation of photoassimilates for the formation of leaves and branches. The lower number of pods and pod dry mass at 13 DAIT reflected the effects of the treatments (Figure 11G,H), mainly the WD in photosynthetic and reproductive characteristics.
The decrease in GP of soybean plants as a function of WD (Figure 12C) occurred mainly due to the decrease in A, which showed a high correlation with GP (Figure 12D). This decrease in GP was also correlated with the lower number of PGG in soybean plants under these stress conditions (Figure 12D), indicating that the reduction in PGG directly affected the GP of soybean plants. GP values per plant under WW conditions in this study were compatible with those found in other studies (Cohen et al., 2020b; Jumrani & Bhatia, 2018); however, these authors found a greater reduction in GP under WD conditions.
The luminous intensity promotes different responses of soybean plants to stress due to WD in the reproductive stage. However, interestingly, this stress is not intensified by the HI. In the HI, the antioxidant metabolism of soybean plants is increased, which requires greater energy expenditure by the plants, reflecting a reduction in the development of branches and leaves when compared to the WW + MI condition. The increase in antioxidant metabolism in HI may have favored plants under WD at the beginning of stress because photochemical energy conversion and protective regulatory mechanisms were less efficient in the WD + MI condition.
Plants under WD accumulate more proline, total soluble sugars, MDA and increase the thickness of the spongy parenchyma. However, this anatomical change was not induced in the HI. The increase in the thickness of the palisade parenchyma is induced by HI in WW plants, to maintain photosynthetic efficiency. Finally, the germination of pollen grains from soybean plants is reduced by WD, regardless of the light condition, which, associated with the reduction of CO2 assimilation, promotes the reduction of GP.
ACKNOWLEDGMENTS
The authors are grateful to the CNPq (Conselho Nacional de Desenvolvimento Científico e Tecnológico, Brazil), CAPES (Coordenação de Aperfeiçoamento de Pessoal de Nível Superior, Brazil), FAPEG (Fundação de Amparo à Pesquisa do Estado de Goiás), Instituto Federal Goiano - Campus Rio Verde and the PPGCA - AGRO (Programa de Pós-Graduação em Ciências Agrárias - Agronomia).
AUTHOR CONTRIBUTIONS
Gabriel Martins Almeida, Alan Carlos Costa, Priscila Ferreira Batista, and Adinan Alves Silva designed the experiments. Gabriel Martins Almeida, Priscila Ferreira Batista, Adinan Alves Silva, Mariela Melo de Oliveira, Dheynne Alves Vieira, Emily Carolina Duarte Santos, Verônica Barbosa Junqueira, and Arthur Almeida Rodrigues conducted the experiments, collected the samples, and performed the physiological and anatomical measurements. Gabriel Martins Almeida performed statistical analysis. All authors discussed the data. Gabriel Martins Almeida wrote the manuscript with support from Adinan Alves Silva, Priscila Ferreira Batista, and Alan Carlos Costa. Alan Carlos Costa supervised the project. All authors read and approved the final version of the manuscript.
Open Research
DATA AVAILABILITY STATEMENT
The data that support the findings of this study are available from the corresponding author upon reasonable request.


