Photosynthetic quantum efficiency in south-eastern Amazonian trees may be already affected by climate change
Funding information: ARBOLES, Grant/Award Number: NE/S011811/1; BIORED, Grant/Award Number: NE/N012542/1; CNPq/PELD, Grant/Award Number: 441244/2016-5; Conselho Nacional de Desenvolvimento Científico e Tecnológico; Coordenação de Aperfeiçoamento de Pessoal de Nível Superior, Grant/Award Number: 001; ECOFOR, Grant/Award Number: NE/K01644X/1; Fundação Carlos Chagas Filho de Amparo à Pesquisa do Estado do Rio de Janeiro; NERC IOF India grant, Grant/Award Number: NE/R005079/1; TREMOR, Grant/Award Number: NE/N004655/1; University of Leeds
Abstract
Tropical forests are experiencing unprecedented high-temperature conditions due to climate change that could limit their photosynthetic functions. We studied the high-temperature sensitivity of photosynthesis in a rainforest site in southern Amazonia, where some of the highest temperatures and most rapid warming in the Tropics have been recorded. The quantum yield (Fv/Fm) of photosystem II was measured in seven dominant tree species using leaf discs exposed to varying levels of heat stress. T50 was calculated as the temperature at which Fv/Fm was half the maximum value. T5 is defined as the breakpoint temperature, at which Fv/Fm decline was initiated. Leaf thermotolerance in the rapidly warming southern Amazonia was the highest recorded for forest tree species globally. T50 and T5 varied between species, with one mid-storey species, Amaioua guianensis, exhibiting particularly high T50 and T5 values. While the T50 values of the species sampled were several degrees above the maximum air temperatures experienced in southern Amazonia, the T5 values of several species are now exceeded under present-day maximum air temperatures.
1 INTRODUCTION
Temperatures have increased substantially in the Tropics in recent decades, by as much as 0.5°C per decade in some regions (Jiménez-Muñoz, Sobrino, Mattar, & Malhi, 2013). In many areas, these increases in mean temperatures have been accompanied by increasingly frequent heatwaves and extreme temperature days (Coumou & Robinson, 2013). Although many tropical forest tree taxa have been exposed to warmer temperatures in the past—for example, during the Pliocene–Eocene thermal maximum, the rapid warming rates currently experienced are unprecedented (Dick, Lewis, Maslin, & Bermingham, 2013). Forests in the southern Amazon experience the highest temperatures in Amazonia, with monthly maximum air temperatures during dry periods frequently reaching >40°C. They are also amongst the earth's most rapidly warming tropical forests (Gloor et al., 2018; Jiménez-Muñoz et al., 2013) making them a natural laboratory for studying the effects of global warming on tropical forests. However, despite their increasing exposure to heat stress, there is currently no empirical data on the sensitivity of southern Amazonian forests to high temperatures.
Photosynthesis, which underpins the substantial productivity and biomass storage of tropical forests, is heavily temperature-dependent (Berry & Björkman, 1980). Most investigations to date have focused on the temperature sensitivity of net CO2 exchange, at the leaf (Doughty & Goulden, 2008; Lloyd & Farquhar, 2008; Slot, Garcia, & Winter, 2016) and canopy (Tan et al., 2017) scales, leading some authors to suggest that tropical forests currently exceed their photosynthetic temperature optima (Doughty & Goulden, 2008). However, studies focusing on gas exchange measurements generally only span the typical range of leaf temperatures to which leaves are exposed under ambient climatic conditions and thus focus only on warming impacts that are reversible. Irreversible changes to the photosynthetic apparatus can ensue in leaves exposed to very high temperatures (Krause, Cheesman, Winter, Krause, & Virgo, 2013) but little is known of the temperature thresholds associated with photosynthetic impairment in Amazonian tree taxa. In the rapidly warming southern Amazon, there is a concern that maximum leaf temperatures may be approaching critical thresholds, particularly in outer canopy leaves that receive maximum irradiance, but we currently do not know the point at which irreversible thermal changes will occur. Furthermore, regions of Amazon rainforest vary in the length of dry periods as well (Fu et al., 2013) as drought intensity (Marengo, Nobre, Tomasella, Cardoso, & Oyama, 2008). In our study region, the peak of the dry season coincides with the peak of maximum air temperatures. Seasonal acclimation potential of thermal traits in trees, particularly the ones exposed to long dry/warm periods will influence the potential for carbon gain in the forest and may be very important for maintaining plant photosynthetic function under a rapidly warming climate. Variation in thermal traits across seasons has not been measured previously in Amazonia.
The measurement of leaf thermotolerance typically focuses on the response of one of two diagnostics of chlorophyll a fluorescence quenching, measured under dark-adapted conditions (Krause & Weis, 1991). This is usually analysed via heat shock treatment of leaf discs (Krause et al., 2010; Krause et al., 2013) where changes in the ‘minimal’ fluorescence (F0) the ratio of variable to maximum fluorescence yield (Fv/Fm), a parameter that is often referred to as the maximum quantum yield (QY) of photosystem II (PSII) are measured (Kitajima & Butler, 1975). The first measurement defines Tcrit as the temperature at which F0 rises sharply, while the second uses Fv/Fm to calculate T50 as the temperature associated with a 50% decline in Fv/Fm. Although the two metrics are indicators of the functional integrity of PSII, they are reporters of different underlying physiological mechanisms. A temperature-induced increase in F0 indicates disruption of the light-harvesting antenna, which is attributed to increased thylakoid membrane fluidity (Figueroa, 2003). The decline in Fv/Fm, on the other hand, signifies a loss of PSII function that has been attributed to disassembly of the light-harvesting antenna complex from the core of PSII (Kouřil et al., 2004; Lípová, Krchňák, Komenda, & Ilík, 2010; Zhang, Liu, & Yang, 2011). Hence, heat-induced changes in Fv/Fm indicate damage to PSII and are less prone to measurement artefacts (Krause et al., 2010; Slot, Krause, Krause, Hernández, & Winter, 2018).
In this study, heat-induced changes in Fv/Fm were used to characterise thermal tolerance for seven dominant tree species in a rapidly warming southern Amazonian rainforest over two different seasons, that is, the end of the wet season and end of the dry season. The following questions were addressed: (a) does the high-temperature tolerance of sun-exposed evergreen trees in the hottest Amazonian site vary across species? (b) what is the extent of seasonal plasticity in photosynthetic thermal tolerance over dry and wet seasons? In addition, (c) how does thermotolerance of southern Amazonian species compare with published data for trees from other tropical regions where maximum temperatures are typically lower? In addition to T50, as a proxy for the first heat effects, we assessed two further parameters: (a) T5, the temperature associated with the onset of the temperature-induced decline in Fv/Fm and (b) T95, the temperature at which Fv/Fm decreased below 95% of the maximum level, taken to be the limit, where PSII functions are effectively lost.
2 MATERIALS AND METHODS
2.1 Study site
The study site is located in a large Amazonian rainforest fragment in Vera Cruz farm (14.833°S 52.168°W; plot code VCR-02 in the RAINFOR forest inventory network), Nova Xavantina, Mato Grosso, Brazil. The plot is located 0.8 km from the nearest forest edge. The vegetation of the site located at the forest-savanna ecotone is a transitional Amazonian rainforest (Marimon et al., 2014) that is mostly (over 80%) characterised by typical Amazonian tree species but also containing some species more commonly found in the Cerrado biome (see Morandi et al. (2016) for floristic description). Mean canopy height is 13.6 m, but the height of some trees can exceed 25 m. The soil is dystrophic, acidic and shallow plinthosol.
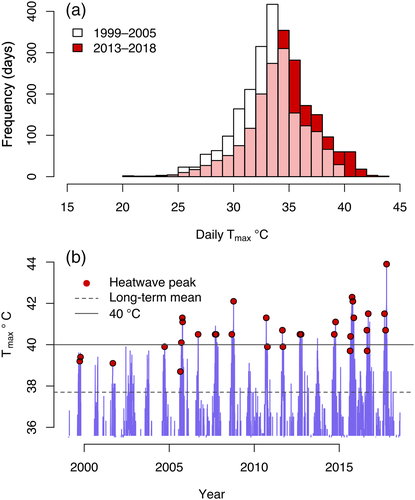
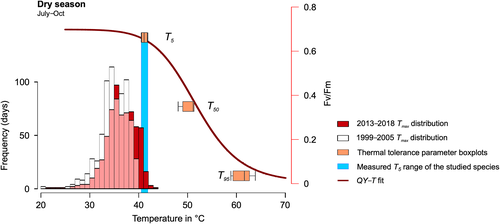
The site is at the southernmost dry limit of the Amazon rainforest, is highly seasonal and is characterised by an average annual rainfall of 1,369 mm/year (recent 20-year average). Most of the rain falls during a 6-month wet period (mid-October until April), which also experiences lower mean temperatures compared to the 6-month-long dry season (May–October). The peak of the dry season (August–October) coincides with the hottest time of the year, where maximum air temperatures (Tmax) frequently exceed 40°C. The daily maximum temperatures have risen considerably over the last two decades (Figure 1a). The recent decade recorded 19 heatwave events (consecutive 3-day spells where maximum daily air temperatures exceed the 90th percentile level for the entire 1999–2008 period) compared to 13 events during the previous decade (Figure 1b); maximum air temperatures have exceeded 40°C 95 times during 2009–2018 compared to 29 times during the 1999–2008 period. The absolute highest Tmax recorded was 43.9°C (October 15, 2017, coinciding with the hot-dry sampling period reported in this study).
2.2 Plant material
The most dominant canopy and subcanopy evergreen tree species were chosen for the study. For each species, individual trees were randomly selected from within the VCR2 plot. Branches from the same set of individual trees were sampled during both the seasons. Leaf samples were collected during two seasons: (a) the hottest and driest period of the year during October 2017, referred to as ‘end of dry’ period and (b) the end of the wet season during March–April 2018, referred to as the ‘wet’ period (Figure S1). Plant material was collected in both seasons from three individuals from each of five commonly occurring evergreen tree species: Hymenaea courbaril L. (Fabaceae), Brosimum rubescens Taub. (Moraceae), Amaioua guianensis Aubl. (Rubiaceae), Cheiloclinium cognatum (Miers) A.C.Sm. (Celastraceae) and Mouriri apiranga Spruce ex Triana. (Melastomataceae). Plant material from three individuals of two further species, Chaetocarpus echinocarpus (Baill.) Ducke (Peraceae) and Tetragastris altissima (Aubl.) Swart (Burseraceae), was only collected in the wet period; and one tree was sampled during the end of the dry period for C. echinocarpus (Table S1). Among the species studied, H. courbaril is the most dominant emergent tree with an average height of 29.9 ± 0.9 m. C. echinocarpus (12.7 ± 0.5 m), T. altissima (11.6 ± 0.5 m), B. rubescens (10.4 ± 0.6 m) and A. guianensis (9.5 ± 0.3 m) are mid-storey trees while C. cognatum (7.1 ± 0.2 m) and M. apiranga (6.8 ± 0.4 m) being the understorey trees.
Trained climbers harvested sunlit canopy branches of the trees between 07:00 to 08:00 a.m. The excised branches were separated into small twigs and transported to the lab (~35 km) in closed Styrofoam boxes with ice packs. Heat treatment assays were done typically within 12 hr of branch harvest. Fully expanded mature leaves were sampled in all cases, but during the end of the dry period campaign, H. courbaril trees had a new flush of leaves and hence, unavoidably for this species younger leaves were also sampled.
2.3 Heat tolerance assay
Following the thermal tolerance measurement protocols adapted from Krause et al. (2010), heat treatment assay was conducted on fully mature healthy leaves were transferred into a water trough in which leaf discs of ∅ 20.5 mm were cut underwater using a cork borer, consistently choosing the central part of the lamina, and avoiding the midrib area. One disc was cut from a single leaf except for a small number of cases where leaf material for analysis was limited when two discs per leaf were excised. Leaf discs were then randomly selected and wrapped in two layers of moist tissue paper on both sides covering the cut edge of the leaf discs. Care was taken not to touch the leaves, and the leaf discs always remained in water or covered in damp tissue paper to avoid anaerobiosis (Harris & Heber, 1993). The discs were transferred into separate plastic bags (30 × 100 mm) keeping them flat and covered in a thin film of water. The bags were subjected to heat treatment in sets of at least three discs per temperature point. Heat treatment was conducted in temperature-controlled thermos flasks with pre-heated water. The water temperature was recorded in the central area of the flask using an HI 9063 K-type thermocouple probe. Separate sets of leaf discs were treated to one of the following temperatures points: 30, 35, 40, 42, 44, 46, 48, 50, 52, 54, 56, 58, 60 and 70°C and a set of untreated discs were used as controls (about 25°C). Hence, one assay run, in most cases, includes measurements from at least 45 leaves. After the heat treatment, the leaf discs were dark-adapted for at least 30 min before measuring Fv/Fm with a FluorPen FP100 (Photon System Instruments, Czech Republic). FP100 uses a 455 nm light source at 1 kHz modulation frequency to irradiate a ∅ 5 mm surface aperture. F0 is read after 40 μs exposure to a 0.09 μmol m−2 s−1 light per pulse and Fm after a 1 s exposure to 3,000 μmol m−2 s−1 light pulse. The response was measured on a PIN photodiode with a 667–750 nm bandpass filter for 10 μs. The leaf discs were incubated in lab conditions (25°C, ~20 μmol m−2 s−1 light) in Petri plates with a thin film of water. Fv/Fm recovery after 24 hr was measured following a 30-min period of dark adaptation.
2.4 Determination of thermal tolerance parameters
 (1)
(1)
2.5 Analysis of field data
The analysis of field data from Nova Xavantina focused on testing for differences in, T50, T5, T95 and the decline width, across species and seasons. Two-way repeated measure linear mixed-effect analysis of variance (ANOVA) models were fitted using the ‘lme’ function in the ‘nlme’ package (Pinheiro, Bates, DebRoy, R Core Team, 2018). Season and species were included as fixed effects and individuals (trees) were included as a random effect in the models. Tukey's post-hoc tests were used to test for differences between specific pairs of species in the significant models. Data analysis was performed using the R program, version 3.5.0 (R Core Team, 2018); all means are presented with ±SEs and significance results are presented for 95% confidence interval (CI = 95%, α = .05).
2.6 Comparison with data from other tropical sites
The thermotolerance data gathered in the study presented here were compared with published data for adult tropical evergreen trees from other sites, that is, excluding seedling/greenhouse studies. The final compilation includes data from 106 species occurring in nine tropical sites (Table 1). Some of these studies determined thermotolerance using the Tcrit parameter derived from the F0 rise approach and others used T50 derived from the Fv/Fm approach used in this study. Data for each of these two metrics were treated separately in our analyses. Based on climatological records from CRU (Osborn & Jones, 2014), we classified the season during the sample collection period as ‘hot’ (three hottest months of the year) and ‘cool’ (three coldest months of the year). Similarly, from the precipitation data, we treated the sampling period that took place during the months with rainfall <100 mm as ‘dry’ and periods above 100 mm as ‘wet’. Hence, the classification of ‘dry’ is only a relative description of the site's precipitation status and does not necessarily indicate no precipitation. Data points for seasonal sites such as Iquitos were classified as ‘wet’. Details of the forest regions and study sites can be found in Table S2. The MuMIn package (Bartoń, 2018) was used to extract conditional pseudo R2 for the complete model fits.
| Location/study site | Wet season | Dry season |
|---|---|---|
| Tcrit in °C | ||
| Atherton, Queensland | 46.2 ± 0.83 (14) | |
| Iquitos, Peru | 50.8 ± 2.32 (13) | |
| Paracou, French Guiana | 49.8 ± 0.91 (19) | |
| Republic of Panama | 48.0 (1) | 47.9 ± 0.75 (2) |
| T50 in °C | ||
| Pune, India | 48.0 ± 0.27 (18) | 47.0 ± 0.31 (17) |
| Cape Tribulation, Far North Queensland | 48.4 ± 0.58 (12) | |
| Robertson Creek, Far North Queensland | 49.2 ± 0.28 (11) | |
| Republic of Panama | 51.0 (1) | 50.4 ± 0.28 (5) |
| Nova Xavantina, Brazil | 49.5 ± 0.77 (7) | 51.1 ± 1.23 (6) |
- Note: Values are mean ± SE. The number of species is shown in parenthesis.
3 RESULTS
3.1 Photosynthetic thermal tolerance
Measured Fv/Fm ratios (average of 0.69 ± 0.02 arbitrary unit, n = 35) were stable with increasing temperatures up to a maximal temperature point and declined thereafter to near-zero levels. The breakpoint temperature T5 averaged at 43.5 ± 1.7°C across species during the end of the dry period and 41.9 ± 0.9°C during the wet period (Figure 3a). The paired difference of 1.06°C over the seasons was not statistically significant. A. guianensis recorded the highest T5 at 53.9 ± 1.3°C (p < .0001, t3 = 10.7) during the end of dry period while the rest of the species recorded ~13.4°C lower T5 at 40.6 ± 3.3°C. However, during the wet period, T5 for A. guianensis was statistically indistinguishable from that of the other species. Furthermore, T5 for A. guianensis was higher during the dry period compared to the wet period—while on the contrary, the remaining species showed lower or indifferent T5 during the dry period. The mixed effects model to explain T5 variation showed a weak species effect (F = 3.48, p = .01) but no influence of season was found. The species difference was mainly due to the response of A. guianensis which was significantly different from C. cognatum (difference of 11.6°C, p = .005) and M. apiranga (difference of 8.7°C, p = .029).

For T50, we found significant species (F = 7.98, p = .0007) and season (F = 6.69, p = .022) effects (Table S3). A. guianensis was significantly different from the rest of the species except T. altissima. End of dry period T50 for all species combined was ~1.6°C higher at 51.6 ± 0.8°C compared to the wet period that averaged at 49.4 ± 0.6°C. A. guianensis showed the highest seasonal plasticity in T50 while B. rubescens the least. A. guianensis recorded the highest T50 during both at the end of dry (56.4 ± 0.5°C) and wet (53.2 ± 0.6°C) periods (Figure 3b). Compared to the rest of the species studied, T50 for A. guianensis was 6.4°C (p = .001, t14 =5.08) and 4.1°C (p = .016, t21 = 2.61) higher during the end of dry and wet seasons, respectively. Excluding A. guianensis, there was no significant difference across species in T50 during both seasons. It is important to note that all species had mature, fully expanded leaves except for H. courbaril, which had a young flush of leaves during the end of the dry period. However, T50 for H. courbaril was not different from the pool of species excluding A. guianensis.
T95 averaged 60.1 ± 0.2°C across species during the end of the dry period and 57.3 ± 0.3°C during the wet period. Although the ranges differed, the difference in means across the season of 2.9°C was not statistically significant (Figure 3c). The recovery of Fv/Fm, measured 24 hr after heat treatment following a 30-min duration dark period and found no significant recovery upon incubation under the irradiance conditions used (< 20μmol m−2 s−1 and ~25°C room temperature) in T50 (t50 = 1.23, p = .22), T5 (t50 = −0.81, p = .42) or T95 (t48 = 1.97, p = .059).
3.2 Gradual versus rapid losses in PSII maximum QY
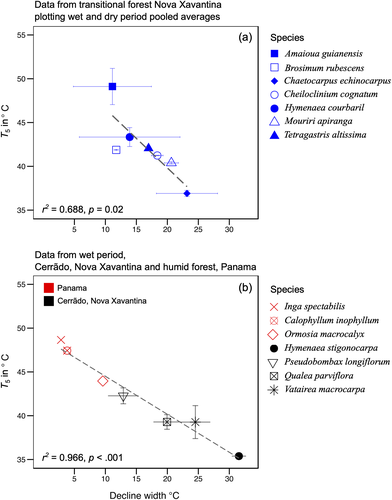
A negative relationship between the Fv/Fm breakpoint temperature, T5 and decline width was observed (R2 = .68 p = .02; Figure 4a). Moreover, species that sustain QYmax levels to a high breakpoint temperature show sudden and steeper QY decline with a narrow DW. Conversely, in cases where the QY decline started at lower temperatures, the decline was gradual (wider DW). A. guianensis and H. courbaril showed the highest seasonal variation in DW compared to other species and showed similar response over both seasons. C. echinocarpus showed the lowest T5 and widest DW. To further expand this analysis, we also included as yet unpublished dataset for four evergreen species from a Cerradão (savannah) forest about 50 km from our study site and data from three Panamanian tropical forest species (Slot et al., 2018). The results from this additional analysis (Figure 4b) showed a similar negative relationship between T5 and decline width (R2 = .96 p < .001) consistent with results from our dataset. Calophyllum inophyllum and Inga spectabilis from Panama, showed a similar response to A. guianensis in our measurement with much narrower DW; A. guianensis however, remained the species with highest T5 in our combined analysis.
3.3 Pan-tropical variation in leaf thermal tolerance
Only five studies in the literature reported data for adult evergreen trees in tropical forests. O'Sullivan et al. (2017) and Zhu et al. (2018) report the F0 rise inflexion point metric Tcrit, whereas the remaining tropical studies, namely, Krause et al. (2010), Sastry and Barua (2017), Slot et al. (2018) and this study report T50 based on Fv/Fm decline. Although the number of studies is limited, this dataset includes rainforests in Australia, India and the NeoTropics (Table 1). Both T50 (Figure 5) and Tcrit showed very closely located modes around 47–48°C. While most of the T50 was >45°C and the mode was around 47°C; the range of T50 (45–52°C) was much narrower than Tcrit, which showed very high interspecific variability within sites. Mixed-effect models showed that the choice of metric (F = 24.32, p < .001) with season (F = 52.89, p < .001) and species (F = 13.04, p < .001) explained significant variation in the data indicating that both metrics are different given different underlying mechanisms. The two metrics were therefore compared separately.
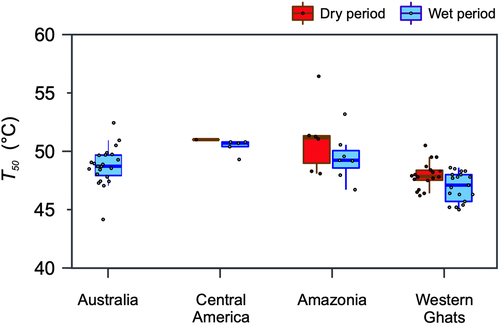
The T50 values for the Central America and Southern Amazon species in the wet period were 50.4 ± 0.36°C and 49.4 ± 0.73°C, respectively, whereas for the Western Ghats it was significantly (t31 = 2.40, p = .02) lower at 46.9 ± 0.31°C. Tcrit was found to vary much more across species and seasons than T50. While Tcrit ranged from 37.2 to 66.7°C (n = 96), T50 ranged from 45.5 to 56.4°C (n = 54). A linear mixed-effect model fitted to explain T50 showed season (F = 12.96, p < .0001) and biogeographical region (F = 15.26, p < .0001) as significant variables (pseudo R2 = .885). In contrast, Tcrit showed no effect of season, however, the variability and the limited number of sites represented, limits any meaningful comparison.
4 DISCUSSION
4.1 Thermal tolerance at the hottest Amazonian forest site
Tree species measured in Nova Xavantina showed a very high thermotolerance, with one species, Amaioua guianensis, recorded the highest T50 documented for any tropical evergreen tree thus far (52.7 ± 1.05°C). The data reported here represent the first Fv/Fm measurements made on adult Amazon trees. Thus, it is not possible to directly compare these results with published data from other Amazonian sites. However, the T50 values reported here are similar to values reported for four Panamanian species (Slot et al., 2018) and also to Tcrit values reported for two Amazonian sites (O'Sullivan et al., 2017). However, although Fv/Fm and F0 are related, they are not equivalent. Hence, care must be taken when making comparisons across metrics. However, the species in Nova Xavantina (Table 1) were considerably more thermotolerant than the Western Ghats forests in India, where the most extensive datasets by far are available for leaf thermotolerance (Sastry & Barua, 2017).
The differences in the long-term Tmax mean values for the site across the two seasons was ~2.5°C (Tmax = 35.7 ± 0.37°C for October and 33.2 ± 0.23°C for the months March–April). Consistent with the literature, T50 measurements across seasons showed significant differences, with T50 values for the hot/dry season being ~1.6°C greater than in the cooler/wetter season. A. guianensis, a characteristic mid-storey species found across a wide range of ecosystems in the region (Morandi et al., 2016), had the highest T50 and the highest seasonal plasticity in T50. A. guianensis is the slowest growing species among the species sampled (Mews, Marimon, Pinto, & Silvério, 2011). These results are consistent with studies that indicate that slow-growing species have a greater capacity for flexible heat dissipation and thermal protection mechanisms than fast-growing plants (Adams & Demmig-Adams, 1994). Maintaining high thermal tolerance during dry periods could be energetically expensive (Wahid, Gelani, Ashraf, & Foolad, 2007), thus requiring down-regulation during wet periods. Stomatal regulation varies across seasons and species. Moreover, lower water availability limits the transpiration-dependent cooling capabilities in dry periods.
The observed leaf-level differences could be due to small variations in the prehistory of the leaves within the canopy for example in terms of light or temperature exposure (Colombo & Timmer, 1992) during the peak dry period, prior to sampling. For example, the acquired tolerance induced by a pre-exposure to heat is associated with the synthesis of heat shock proteins (HSPs) and with other low molecular weight proteins that protect PSII (Gifford & Taleisnik, 1994). The variations in T95 values were higher than those observed in T5 or T50. This may indicate that there is greater variation in the high-temperature threshold for loss of photosystem integrity (T95) between species than in the initiation temperature of sensitivity (T5; Figure 6).
The mechanisms that underpin the thermal stability of photosynthesis in tropical trees have not been fully characterised. The data presented here clearly show that species such as A. guianensis are able to maintain PSII functions up to high temperatures (53.9 ± 0.75°C during the end of dry period, that is, the highest reported in literature for C3 plants). These trees could have mechanisms to not only protect the PSII from irreversible thermal inactivation but also have a high degree of plasticity in relation to temperature fluctuations. In such trees, loss of photosynthetic functions may be prevented by a more rapid repair cycle than that occurring in other species. However, the precise nature of the specific mechanisms involved remains unclear. Further molecular and metabolic studies on tropical tree species are required to understand how photosynthesis can withstand high temperatures. Some studies indicate that redundancy and diversity of light-harvesting complexes (Tang et al., 2007) could play a role in buffering the high light, high temperature-induced changes in photosystem functions. Hence, heat sensitive systems could be replaced with more thermally stable forms. Similarly, large variations in heat shock factors/proteins, oxidative stress/signalling and thermal energy dissipation could exist across taxa, hinting at differential thermal sensitivity of tropical evergreen trees to high-temperature stress.
4.2 Thermal sensitivity thresholds for PSII
A key question concerns how close tree species are to their thermal sensitivity thresholds in the warmest region of the Amazon? The data presented here show that T50 for seven focal species is at least 4°C above the highest air temperatures ever experienced at the study site (43.9°C). However, for most species, T5, the breakpoint temperature, is already surpassed in the peak of the warm/dry season (Figure 6). Thus, the site temperatures are already reaching levels where the incipient irreversible loss of PSII activity occurs during the dry/warm periods. Such periods are predicted to become more frequent with future warming (Yao, Luo, Huang, & Zhao, 2013). However, these inferences are based on air temperatures, while leaf temperatures are arguably a more meaningful measure of proximity to thermal sensitivity thresholds. During the dry/warm season, limited access to soil moisture restricts stomatal opening. This is likely to lead to leaf temperatures that exceed air temperatures (Krause et al., 2010; Slot & Winter, 2016), at least for part of the day. Under these circumstances, plants in our study area, especially those exposed to full sunlight, may operate closer to thermal sensitivity thresholds than the simple examination of air temperatures suggests.
4.3 Variations in the responses of PSII to heat
The negative relationship between T5 and decline width (Figure 4) indicates a range of response strategies in trees. The two extremes of PSII thermal sensitivity could be described as ‘sensitive’ and ‘tolerant’ (see Figure 7). Tolerators were found to sustain their PSII QY values up to a remarkably high-temperature point (high T5). They were characterised by a rapid decline to near-zero levels at higher temperatures beyond T5. Conversely, heat ‘sensitive’ responses are characterised by a sensitivity of PSII to much lower (low T5) temperatures. The decline in PSII QY to near-zero levels in these trees, however, occurs gradually over a very wide temperature range. Hence, in heat sensitive trees, when the leaf temperatures are at this ‘decline width’ range, PSII is already negatively affected by temperature stress. The slow decline could potentially indicate PSII protection mechanisms that ensue mediated by HSPs and/or xanthophyll mediated thermal protection mechanisms. Given the change in PSII activity, it is reasonable to hypothesise that electron flow could switch from the non-cyclic pathway to cyclic electron transport around PSI, a mechanism that is known to protect PSII against thermal inactivation (Essemine, Xiao, Qu, Mi, & Zhu, 2017; Sun, Geng, Du, Yang, & Zhai, 2017).
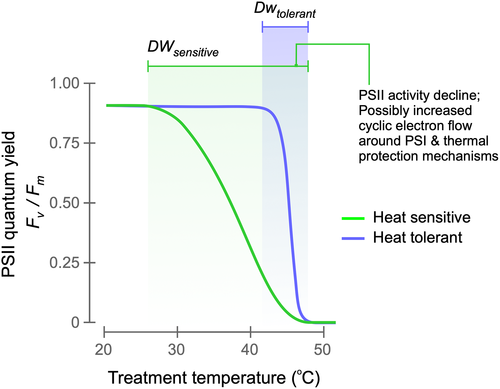
High-temperature tolerant trees, on the other hand, have better protected PSII which can continue to function up to a very high-temperature point. By sustaining PSII activity under extremely high leaf temperature conditions, tolerators could maintain better photosynthetic electron flow rates than thermosensitive species. The effective thermal sensitivity of heat tolerant trees could be linked to stomatal controls and transpiration cooling. However, evaporative cooling can reduce the need for investment in thermal tolerance mechanisms. If transpiration cooling is strong, the mechanisms that facilitate high PSII thermal tolerance might not be required. Hence, thermal tolerance of leaf metabolism must consider the molecular physiology of the leaf.
4.4 Ecophysiological relevance of PSII QY temperature sensitivity
During the dry and hot period of the seasonal cycle, leaf to air temperature differentials (Tleaf–Tair), in evergreen trees in some tropical sites have been measured to be as high as 18°C (Fauset et al., 2018; Pau, Detto, Kim, & Still, 2018; Tribuzy, 2005). Furthermore, during the parts of the day when transpirational cooling capacity is limited by stomatal closure (Slot et al., 2018), leaf temperatures reach as high as 48°C in some tropical trees (Slot & Winter, 2016). Comparing these leaf temperatures with the range of T5 measured, consistent with the ideas presented in Mau, Reed, Wood, and Cavaleri (2018) and Doughty and Goulden (2008), it is likely that some sensitive species are already experiencing temperatures that are affecting PSII functioning. Given the species level variability and largely unexplored mechanisms of thermal protection strategies of trees, it is probable that there will be a varied range of response to high-temperature conditions across species. Early leaf senescence is triggered by exposure to high temperatures (De la Haba, De la Mata, Molina, & Agüera, 2014; Way, 2013). Strategies such as increased leaf turnover rates could, therefore, be triggered by high temperatures with implications for carbon acquisition by the trees. Transpirational cooling mechanisms under high temperatures could be limited and vary between species, making species with less water available for cooling more susceptible to thermal stress. However, some species continue to transpire even at extremely high temperatures (Drake et al., 2018).
The Fv/Fm or F0 based fluorescence data only indicate the responses of PSII (see Figure S3 for Fv/Fm and F0 relationship). However, the limits of other processes such as thermal protection, stomatal and metabolic controls of CO2 assimilation are largely unknown except in a few model plant species. Hence, such integrated definitions of thermal thresholds could be more meaningful and provide a better understanding of the thermal sensitivity of trees or plants in general. Thus, concepts such as thermal safety margins (O'Sullivan et al., 2017; Sunday et al., 2014) could be expanded further to derive ecophysiologically meaningful conclusions (see Supporting Information 7 and Table S4).
Overall, the data presented here show that there is significant diversity in the temperature sensitivity of photosynthesis across tropical evergreen trees (Cseh et al., 2005; Holm, Várkonyi, Kovács, Posselt, & Garab, 2005), much of which remains uncharacterised. It is probable that with increasing temperatures, especially during the summer, the leaf temperature differences between species, together with differences in transpiration cooling capacity, will reveal large interspecific variations in tree sensitivity to extreme heat conditions.
5 CONCLUSION
This study quantified the photosynthetic thermal tolerance of seven dominant evergreen trees from the hottest and most rapidly warming forest site in the Amazonia. The key findings of this study are firstly, that evergreen trees from the site exhibit a high level of PSII thermotolerance. Although variations in thermotolerance were observed between species, this was largely caused by data from one mid-storey species, which showed exceptionally high thermotolerance (the highest recorded in the tropics). A significant but weak seasonal acclimation of T50 was observed that is consistent with the literature (Sastry & Barua, 2017; Zhu et al., 2018). Although T50 values were much higher than the absolute maximum air temperature of the region, there is some evidence of incipient loss of PSII function even under current conditions. Daily maximum air temperatures during the dry periods at our study site in recent years have reached levels that overlap with the range of T5 measured in our study. The trees in the hottest Amazonian forest site are therefore already sensitive and experiencing temperatures close to the thresholds of their high-temperature sensitivity.
ACKNOWLEDGEMENTS
The field campaign was part of and funded by BIORED (NE/N012542/1) and ECOFOR (NE/K01644X/1) projects. R.T.'s PhD was funded by University of Leeds, Leeds International Research Scholarship (2016–2018). R.T. acknowledges additional funding support from NERC IOF India grant (NE/R005079/1), Ecology and Global change cluster funds at School of Geography, University of Leeds and Climate Bursary Funds from the University of Leeds. D.G. acknowledges support from two NERC awards: TREMOR (NE/N004655/1) and ARBOLES (NE/S011811/1). We acknowledge CNPq/PELD Project 441244/2016-5 for fieldwork support during the forest inventories in Nova Xavantina. A.V. acknowledges the funding support by the Coordenacao de Aperfeicoamento de Pessoal de Nivel Superior—Brasil (CAPES)—Finance Code 001, Conselho Nacional de Desenvolvimento Científico e Tecnologico (CNPq) and Fundacao de Amparo a Pesquisa do Rio de Janeiro (FAPERJ); Centro Multiusuario CME-LBCT the infrastructure provided. Thanks to Chetan Deva, Amy Bennet, Somashekhara Achar KG, Emma Docherty and Alexander Chambers-Ostler for helpful discussions. We thank the two anonymous reviewers and Handling Editor Thomas D. Sharkey for constructive inputs and suggestions. R.T. thanks Somashekhara Achar KG, Jyothi Venkatasubhramanya and Yogesh Siddhananjaiah for the support with Kannada translation. R.T. gratefully acknowledges inputs from Oliver Phillips and Bill Rutherford on an earlier version of the manuscript.
CONFLICT OF INTEREST
The authors declare no conflict of interest.
AUTHORS CONTRIBUTION
The work was envisioned by David Galbraith. Rakesh Tiwari and David Galbraith jointly led the research. Rakesh Tiwari, Christine H. Foyer and David Ashley developed the thermal tolerance protocols with inputs from Heinrich G. Krause. Rakesh Tiwari trained the teams led by Wesley Jonatar A. da Cruz and Simone M. Reis in thermal tolerance measurements; Beatriz Schwantes Marimon and Ben Hur Marimon-Junior oversaw the field campaign. Igor Araújo de Souza collected additional data from Cerradão forest, Nova Xavantina. Denilson M. Santos sampled trees with support from Carla Heloísa L. de Oliveira, Eduardo Q. Marques and Wesley Jonatar A. da Cruz. Martijn Slot, Klaus Winter and Heinrich G. Krause provided data for Panama. Remaining team members assisted with thermal tolerance measurements. Rakesh Tiwari wrote the manuscript with primary support from David Galbraith and additional support from Emanuel Gloor, Christine H. Foyer and Sophie Fauset. All co-authors commented on the manuscript.


