Drought and heat wave impacts on grassland carbon cycling across hierarchical levels
Funding information: CAS Strategic Priority Research Programme (A), Grant/Award Numbers: XDA19030202, XDA20050103; International Cooperation and Exchange of National Natural Science Foundation of China, Grant/Award Numbers: 31761123001, 31761143018
Abstract
Droughts and heat waves are increasing in magnitude and frequency, altering the carbon cycle. However, understanding of the underlying response mechanisms remains poor, especially for the combination (hot drought). We conducted a 4-year field experiment to examine both individual and interactive effects of drought and heat wave on carbon cycling of a semiarid grassland across individual, functional group, community and ecosystem levels. Drought did not change below-ground biomass (BGB) or above-ground biomass (AGB) due to compensation effects between grass and non-grass functional groups. However, consistently decreased BGB under heat waves limited such compensation effects, resulting in reduced AGB. Ecosystem CO2 fluxes were suppressed by droughts, attributed to stomatal closure-induced reductions in leaf photosynthesis and decreased AGB of grasses, while CO2 fluxes were little affected by heat waves. Overall the hot drought produced the lowest leaf photosynthesis, AGB and ecosystem CO2 fluxes although the interactions between heat wave and drought were usually not significant. Our results highlight that the functional group compensatory effects that maintain community-level AGB rely on feedback of root system responses, and that plant adjustments at the individual level, together with shifts in composition at the functional group level, co-regulate ecosystem carbon sink strength under climate extremes.
1 INTRODUCTION
Globally, droughts, often in concert with heat waves (i.e., hot drought [Overpeck, 2013]), are the most widespread events affecting terrestrial ecosystem carbon cycling (Reichstein et al., 2013). Hot droughts are likely to occur with increasing frequency and intensity (Easterling, 2000; Stocker, 2014). Although outcomes are highly variable, multiple lines of evidence concur that droughts and heat waves generally cause reductions in ecosystem carbon uptake and productivity (Ciais et al., 2005; Doughty et al., 2015; Hoover, Knapp, & Smith, 2014; Schwalm et al., 2012; Zhao & Running, 2010; Zscheischler et al., 2014). Despite significant efforts to understand drought and heat wave impacts, current understanding of the mechanisms behind ecosystem responses to these stressors remains insufficient in multi-model simulations of climate extremes-induced changes in the carbon cycle (Piao et al., 2019). Besides, the interaction between droughts and co-occurring heat waves remains poorly understood (Reichstein et al., 2013; Smith, 2011).
Droughts and heat waves may cause widespread changes at many levels of the ecological hierarchy spanning the individual, functional group, community and ecosystem levels. Responses at lower hierarchical levels (i.e., individual or community) can have either additive, offsetting or synergistic effects and thus provide mechanisms for higher-levels responses (i.e., ecosystem). Therefore, climate extreme experiments focused on carbon cycling responses across multiple biological scales could significantly improve our understanding of mechanisms underlying carbon cycling responses to climate extremes (Corlett, 2016; Jentsch et al., 2011).
At the individual level, plants may tolerate environmental stress by a variety of physiological or structural adjustments. For example, in order to prevent leaf water potential from falling below a critical level during periods of water stress, plants decrease stomatal conductance, in turn curtailing CO2 uptake (De Boeck, Bassin, Verlinden, Zeiter, & Hiltbrunner, 2016). Additionally, individuals can adapt to water stress by specifically allocating more photosynthate to fine root production in order to increase capacity for water and nutrient uptake, at the expense of leaf production (Burri, Sturm, Prechsl, Knohl, & Buchmann, 2014; Hasibeder, Fuchslueger, Richter, & Bahn, 2015; Jaleel et al., 2009). When environmental stress reaches a tipping point beyond an individual plant's threshold tolerance, plant mortality may result (Niu et al., 2014). Response to climate extremes may vary across different functional groups due to various resource-use strategies and threshold tolerances (e.g., C4 vs. C3 functional group in responses to extreme heating event in White, Campbell, Kemp, & Hunt, 2000; forb vs. grass functional group in responses to extreme droughts in Hoover et al., 2014). As a result, asynchronous or even opposite responses of different functional groups potentially contribute to maintain community-level stability (Bai, Han, Wu, Chen, & Li, 2004). From a community perspective, such structural changes may entail profound consequences for the ecosystem carbon budget, as plant community structure regulates ecosystem-level CO2 flux responses to climate change (Kuiper, Mooij, Bragazza, & Robroek, 2014; Ward et al., 2013; Xu et al., 2015). Collectively, physiological and structural processes at the individual level, compositional shifts at the functional group level, and structural changes at the community level, as well as their interactions, culminate in complex ecosystem responses to climate extremes.
There is emerging evidence that droughts and heat waves are often coupled in nature through soil moisture-temperature feedbacks (Ciais et al., 2005; De Boeck & Verbeeck, 2011; Overpeck, 2013; Seneviratne, Luthi, Litschi, & Schar, 2006). The expectation is that the negative impacts of drought are intensified by the joint occurrence of higher temperatures (hot drought). However, past manipulative experiments showed high variation in the interactive effects between droughts and high temperatures (De Boeck et al., 2016; Dreesen, De Boeck, Janssens, & Nijs, 2012; Hoover et al., 2014). Compared with a heat wave alone, hot drought is likely to exert a greater influence on ecosystem structure and function (Ciais et al., 2005; De Boeck et al., 2016; De Boeck, Dreesen, Janssens, & Nijs, 2011), with the outcome related to the combined effects on soil moisture. In contrast, a soil microbial experiment suggested that drought could induce community tolerance to heat waves (Bérard, Sassi, Renault, & Gros, 2012). In some cases, heat waves combined and droughts unexpectedly triggered additive positive effects on grassland biomass (Dreesen et al., 2012). These heterogeneous responses to the interaction of heat and drought and the unclear mechanisms underlying vegetation responses to these combined stresses highlight that carbon cycle impacts of combined heat waves and droughts remain poorly understood.
To understand how droughts, heat waves and hot droughts affect grassland carbon cycling, we conducted a replicated, factorial manipulative experiment over 4 years in a semiarid grassland of Inner Mongolia, China. We simultaneously measured key carbon cycle processes at different levels of ecosystem hierarchy to comprehensively examine mechanistic responses, including photosynthetic physiology at the individual level, above-ground biomass (AGB) of grasses, forbs and shrubs at the functional group level, community structure, AGB, below-ground biomass (BGB) and leaf area at the community level, and CO2 fluxes at the ecosystem level. Specifically, we tested the following three hypotheses to single and combined climate extremes: (a) Climate extremes would close stoma or even damage leaves and thereby reduce leaf photosynthetic rate (A) and leaf area index (LAI). Consequently, community-level biomass and ecosystem-level CO2 exchange would be curtailed. (b) Different functional groups (e.g., grass vs. forb vs. shrub) or/and different part of biomass (i.e., AGB vs. BGB) would inconsistently or oppositely respond to climate extremes, which would amplify or buffer the reduction in community-level biomass and ecosystem-level CO2 exchange. (c) Drought would cause larger negative effects than heat waves in semiarid grasslands, because drought reduces soil moisture directly and plants often cope with high temperature well, especially when water supply is sufficient (De Boeck et al., 2011; Hoover et al., 2014). Hot drought is expected to have the largest negative effects on all of these, as warming aggravates soil water stress (Ciais et al., 2005; Teskey et al., 2015).
2 MATERIALS AND METHODS
2.1 Study site
This study, as a part of the Extreme Climate Events and Biodiversity-II (ECEB-II) experiment, was conducted at the Inner Mongolia Grassland Ecosystem Research Station in the Xilin River Basin (43°20′ N, 116°40′ E, 1200 m a.s.l). The region is characterized by a semiarid continental climate, dry in spring and humid in summer, with a mean annual air temperature (1953–2017) of 2.5°C and mean annual precipitation of 281 mm, of which 86% (∼242 mm) falls during the growing season from May to September. The soil type is classified as dark chestnut in the Chinese soil classification or as Calcis-orthic Aridisol under U.S. Soil Taxonomy classification. The water content is 0.29 m3/m3 at field capacity and 0.12 m3/m3 at the wilting point (Hao et al., 2010). In 2012, we established the ECEB-II experiment in an undisturbed, native temperate semiarid steppe which has been fenced-off to prevent grazing since 1979. The community is dominated by C3 perennial rhizome and bunch grasses, including Leymus chinensis, Stipa grandis, Achnatherum sibiricum and Agropyron cristatum, which cumulatively account for approximately 75% of total aboveground biomass.
2.2 Experimental design
In this study, we defined drought by the length of the precipitation-free period. The local precipitation regime is typically centered within the growing season. Thus, we analyzed growing-season weather data (1953–2010, longest record period) obtained from the Meteorological Station of Xilinhot city and found the longest period between two sequential rainfall events was 30 days. We therefore defined an extreme drought treatment as a rain-free period of 30 days. The drought treatments using passive rain exclusion shelters lasted between 20 July and 19 August during mid-growing season each year from 2013 to 2016. The 99th percentile of daily maximum temperature during the growing season is 38°C, which was used as the cutoff temperature to define a heat wave as per De Boeck, Dreesen, Janssens, and Nijs (2010). We found just one such event in the historical record. It occurred in July 2000 and lasted 7 days, during which the difference in daily maximum temperature above the historical average was greater (+7.0°C) than the difference in minimum nighttime temperature (+1.2°C). Thus, a heat wave in this region is characterized by large increases in daytime temperature with minimal differences at night (Li et al., 2016). Therefore, our heat wave treatment was designed to produce air temperatures of 38°C during daytime (9:00 am–3:00 pm) for a period of 7 consecutive days, with no nighttime treatment. Warming started from 9:00 am, raised the air temperature to around 38°C, then maintained this temperature till 3:00 pm. Warming was applied with a transparent infrared lamp (2000 W, 220 V, 100 cm × 31.4 cm, PHILIPS) connected with a thermal resistor (CU 50, Micro Sensor Co., Ltd., China) to an intelligent temperature controller (XMT 7100, Huibang technology Co., Ltd., China).
These two climate extreme factors, drought and heat wave, were crossed to form a fully factorial experiment including four treatments: (a) ambient conditions for control (control), extreme drought (drought), heat wave (heat wave) and drought in combination with heat wave (hot drought). There were three replicates for each treatment and 12 plots (2.0 m × 2.0 m each) randomly located in four blocks. Water exchange across plot boundaries was prevented by a metal flashing installed to a depth of 40 cm and extending 10 cm above ground. For detailed information about the rainout shelter design and heat wave treatments, see Li et al. (2016).
Due to limited electrical supply at the research site, asynchronous warming was used for heat wave and hot drought treatments. Infrared lamps were moved from heat wave treatment plots to hot drought treatment plots as soon as a heat wave treatment heating finished (for heating periods see Table S1). Ambient environmental conditions during the two heating periods were similar each year, as indicated by air and soil temperatures, wind speed and photosynthetically active radiation (Figure S1). Accordingly, ecosystem CO2 fluxes of the control treatment were also similar during these two adjacent periods (Figure S3). Compared with the dynamics observed during the whole vegetative period (about 5 months), these adjacent 7-day periods were quite similar in weather and ecosystem state; therefore, we do not expect ecosystem structure and function responses to climate extremes to be biased by the asynchronous warming.
2.3 Micro-climate
Daily precipitation data were obtained from a nearby (50 m approximately) tipping bucket rain gauge at 1.5 m above ground (TE525MM, Campbell Scientific Inc.). During the heating period hourly from 9:00 am to 3:00 pm, soil temperature at the depth of 10 cm and canopy temperature at the height of 40–60 cm were measured by soil thermometers (TL-883, Tonglixing technology Co., Ltd., China) and plant canopy thermometers (ST-2955, Shanghai Sintek International Trade Co., Ltd., China), respectively. Over the growing season from 2013 to 2016, soil water content (SWC) of the top 20 cm was measured in each plot with time domain reflectrometry probes (TDR 300, Spectrum Technologies, Inc. CST) vertically inserted into soil. SWC was measured about every 5 days in 2013, 2015 and 2016 and approximately every 10 days in 2014. Soil temperature (Ts) at the depth of 10 cm and air temperature (Ta) at 50 cm above the ground were measured manually with thermometers during CO2 flux measurements (see Ecosystem CO2 flux section). To account for any spatial variation (Figure S2), canopy temperature and SWC were measured in three different locations per plot each measurement, and their mean was used to represent the plot value.
2.4 Plant leaf physiology
We made plant leaf physiological measurements (light-saturated photosynthetic rate (A), stomatal conductance (gs) and chlorophyll fluorescence (Fv/Fm)) and leaf temperature (Tleaf) of the dominant grasses Leymus chinensis, Stipa grandis and Achnatherum sibiricum (this latter species was only measured in the latter 2 years) during and after experimental treatments from 2013 to 2016 (seven, four, four and four times, respectively). Among the measurements, A, gs and Tleaf were measured using a portable photosynthesis system (GFS-3000, Heinz Walz GmbH, Effeltrich, Germany) with a 4-cm2 leaf cuvette between 9:00 and 11:30 am, when ecosystem CO2 fluxes were also measured (see below). One or more fully expanded leaves (paralleled, but not overlapped) per plant per species in each plot was/were placed into the cuvette. Note that curly leaves of S. grandis were directly measured without flattening. Flattening is difficult to perform repeatedly and is unnecessary given our focus on the relative change across treatments. Measurements were performed under saturated light (1,700 μmol m−2 s−1), while CO2 concentration, block temperature and block humidity were set to ambient conditions. Chlorophyll fluorescence (Fv/Fm, the maximum quantum efficiency of photosystem II [PS II]), is a widely used stress indicator, because decreases in dark-adapted Fv/Fm reflect damage to PS II. Fv/Fm was recorded using a pulse-amplitude-modulated photosynthesis yield analyzer (Dual-PAM, Heinz Waltz, Effeltrich, Germany) with a leaf clip holder. We tested fluorescence values of fully expanded leaves for each species between 8:00 and 11:00 pm, allowing adequate dark adaptation on the same days when other leaf physiological measurements were made.
2.5 AGB and community structure
AGB and community structure were estimated once a year by harvesting all aboveground plant material in one 0.25-m2 quadrat located within each 4-m2 plot around 15 September. Before clipping, the number of individuals was recorded by species to assess community structure, including richness (number of species in 0.25-m2 quadrat), abundance (number of stem per m2) and Shannon's diversity (H′). All species were also categorized into three ecological functional groups: grass, forb and shrub. Within 4 hours of clipping, fresh leaves were separated from the plant and flatted to measure leaf area using a leaf area meter (LI-3000C, LI-COR Inc., Lincoln, NE) and calculate LAI. Then all plant tissues were oven dried at 65°C for 48 hr and weighed. For each year, the locations of quadrats were varied to prevent resampling of the same quadrat.
2.6 Belowground biomass
BGB was estimated by specific root length (SRL) and root length (Fischer, Hart, LeRoy, & Whitham, 2007). SRL at this site was estimated at 36 m/g (Cheng, Chu, Chen, Bai, & Niu, 2016) and root lengths were measured by the minirhizotron technique. In each plot, one transparent minirhizotron tube (7-cm external diameter, 100-cm length) was installed in the soil at a 45° angle from the horizontal to a depth of 42 cm during May 2012. Holes were made with a soil corer of the same diameter as the tubes, which ensured tight contact with surrounding soil. Portions of the tubes (20-cm length) exposed at the surface were covered with adhesive aluminum foil, and the ends were capped to prevent entry of water, light, and heat. To quantify root length, images were taken at vertical depths of 0–14 cm, 14–28 cm and 28–42 cm, using a root scanner system (CI-600 Root Growth Monitoring System, CID Inc., Vancouver, WA). Images, taken in grayscale at 400 dpi, were analyzed separately using the program RootAnalysis (Analysis Ome Co. Ltd, Beijing, China) to calculate root length. This method has been widely used in many natural multiple-species ecosystems to assess root biomass and we have increased confidence in BGB estimation by this method because it matched BGB based upon traditional soil coring methods in an area adjacent to the experiment (Li et al., 2019). We summed AGB and BGB to calculate total biomass (TB).
2.7 Ecosystem CO2 flux
In May 2012, one square stainless steel frame (50 cm × 50 cm, 10 cm high with 3 cm extending aboveground) was inserted in each plot. We used an infrared gas analyzer (LI-840A, LI-COR Inc., Lincoln, NE) and a transparent chamber (50 cm × 50 cm × 50 cm), attached to one air pump (6262-04, LI-COR Inc.) and two plastic pipes, to measure CO2 fluxes between 9:00 and 11:30 am on sunny days (measurement data see Figure S2). The chamber was successively used without and with a lightproof covering to measure net ecosystem exchange (NEE) and ecosystem respiration (ER), respectively. Each measurement lasted 90 s and there was an interval of at least 10 s. between two consecutive recordings to replace the air in the chamber. CO2 flux rates were determined from the time-course of CO2 concentrations (Chen, Lin, Huang, & Jenerette, 2009). Gross ecosystem production (GEP) was calculated as the difference between NEE and ER. Positive and negative CO2 flux values indicate net ecosystem CO2 emission and uptake, respectively.
2.8 Statistical analyses
We used a repeated measures analysis of variance to test for the effects of heat waves, drought, year, and their interactive effects on community biomass (AGB, BGB and TB), community structure (LAI, abundance, richness and Shannon's diversity), annual averaged ecosystem CO2 fluxes (NEE, ER and GEP), and annual averaged plant physiology (A, gs and Fv/Fm) for each species. A post-hoc Duncan test was used to test for mean differences of the above variables across the four treatments each year. We also used a paired t-test for heat wave effects on soil temperature and vegetation surface temperature during the heating period. T-tests were also used to determine the differences in treatment effects on relative abundance of grass, as well as AGB of grass and non-grass (forb plus shrub) between control and drought/heat wave/hot drought. Treatment effects were considered to be statistically significant at p ≤ .05 and marginally significant at p ≤ .10 given the small number of treatment replicates (n = 3). All statistical analyses were performed with R v.3.4.4, R (R Core Team, 2018).
We used structural equation modeling (SEM) to quantify the direct and indirect impacts of heat waves and drought on A per species and ecosystem-level net CO2 uptake (-NEE). Drought and heat wave-induced changes in leaf temperature (Tleaf), SWC, gs and Fv/Fm were included in the SEM to explore the effects of climate extremes on A. Similarly, several major pathways were constructed to explore the effects of climate extremes on -NEE, including environmental variables (SWC, Ta), A, and LAI, abundance of grass and non-grass, and biomass (AGB of grass and non-grass as well as BGB). Data were fitted to the model using the maximum likelihood estimation method. Adequate model fit was indicated by a non-significant chi-squared test (p > .05). SEM analysis was performed using the AMOS 25 software (IBM, SPSS, Armonk, NY). Before SEM analyses were conducted, we first tested for individual relationships between each variable pairing to identify significant and linear relationships (Figures S3 and S4).
3 RESULTS
3.1 Micro-climate
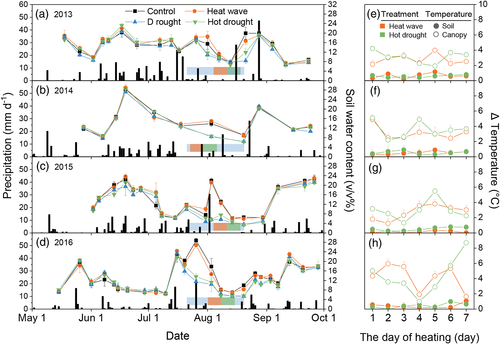
During the 4 years of the experiment (2013–2016), rain shelters excluded 49, 37, 52 and 42 mm of ambient precipitation during 30 days of drought treatments, which is equal to 17%, 15%, 22% and 22% of growing season precipitation (GSP) (Figure 1a–d). The SWC declined clearly during drought periods and recovered rapidly with the first precipitation after drought, while the heat wave treatment did not significantly change SWC (Figure 1a–d). Heat waves significantly increased the mean canopy temperature by 3.2 and 3.5°C during the heating period in heat wave and hot drought treatments, respectively (p < .01 for both, Figure 1e–h). Meanwhile, soil temperature was significantly raised by 0.4 and 0.5°C in the heat wave and hot drought treatment compared with the ambient control, respectively (p < .01 for both, Figure 1e–h).
3.2 Plant physiological responses
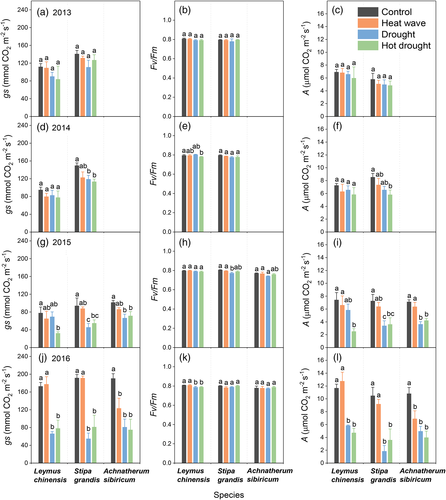
Both drought treatments (drought and hot drought) decreased stomatal conductance (gs) and light-saturated photosynthetic rate (A) over the last 3 years (but not in 2013), regardless of species and heat wave treatment (Figure 2 and Table S2). The Fv/Fm values of the three species were ~0.8 in all treatments across the 4 years, even though they were significantly and marginally significantly reduced by drought for Leymus chinensis and Stipe grandis, respectively (Figures 2b, e, h and k, and Table S2). No clear significant heat wave effects were recorded for gS, A and Fv/Fm over the 4 years. There were no significant interaction effects between drought and heat wave for these plant physiology parameters in any years, except for the drought and heat wave interaction for Fv/Fm of Stipe grandis (Figure 2 and Table S2).
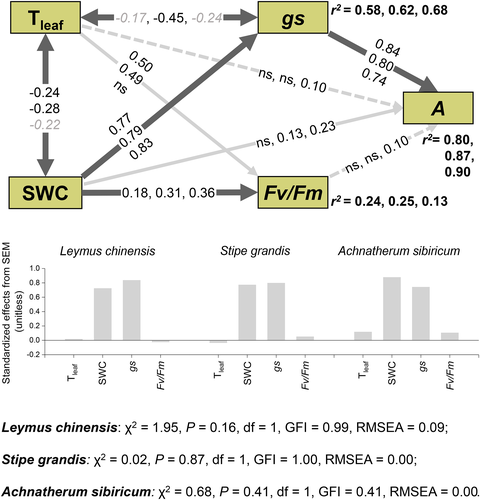
Results of SEM suggest that SWC had significant positive effects on gs which further had a strongly positive effect on A for all three species. Similarly, SWC had a significant positive effect on Fv/Fm, but Fv/Fm had significant positive effects on A only for Achnatherum sibiricum. Tleaf had significant or marginally significant negative relationships with SWC and Gs. Tleaf significantly increased Fv/Fm for Leymus chinensis and Stipe grandis but not Achnatherum sibiricum. SWC significantly increased A for Stipe grandis and Achnatherum sibiricum, but not Leymus chinensis. A was significantly increased by Tleaf and Fv/Fm only for Achnatherum sibiricum (Figure 3).
3.3 Functional group-level responses
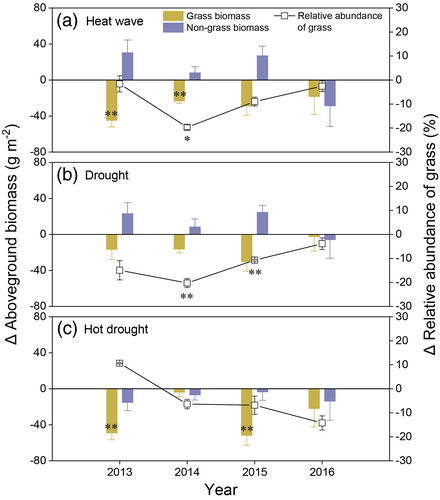
At the functional group-level, we found a decreasing trend of relative abundance of grass in response to all of the climate extreme treatments across the 4 years, which are evident under the heat wave treatment in year 2014 and under the drought treatment in years 2015 and 2016, except for the hot drought treatment in the first year. Similarly, AGB of grass consistently declined under the heat wave or drought treatments over the first 3 years, while AGB of non-grass increased. Both AGB of grass and non-grass decreased under the hot drought treatment across the 4 years and under the separate heat wave and drought treatments in the last year (Figure 4 and Table S4).
3.4 Community-level responses
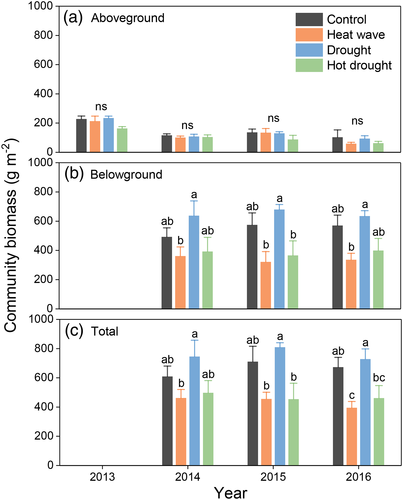
At the whole community level, heat waves significantly reduced AGB, BGB and thereby TB, while droughts did not significantly change any component of biomass (Figure 5 and Table 1). There was a marginally significant two-way interaction between heat wave and year on TB with larger reductions in 2016 than in the other 2 years, as AGB reduction was mainly reflected in 2016. Interactive effects of drought and heat wave on biomass were not significant. However, the lowest AGB was usually found in the hot drought treatment (Figure 5 and Table 1). Overall, climate extremes had little effects on the whole community-level structure (LAI, abundance, richness and Shannon's diversity (H′), Figure S5 and Table S3).
| AGB | BGB | TB | NEE | ER | GEP | |
|---|---|---|---|---|---|---|
| Heat wave | 0.05 | 0.01 | <0.01 | 0.07 | 0.81 | 0.13 |
| Drought | 0.31 | 0.34 | 0.40 | <0.01 | <0.01 | <0.01 |
| Year | <0.01 | 0.68 | 0.17 | <0.01 | <0.01 | <0.01 |
| Heat wave × drought | 0.48 | 0.71 | 0.68 | 0.73 | 0.99 | 0.79 |
| Heat wave × year | 0.68 | 0.06 | 0.07 | 0.91 | 0.84 | 0.89 |
| Drought × year | 0.79 | 0.80 | 0.70 | 0.03 | 0.59 | 0.08 |
| Heat wave × drought × year | 0.56 | 0.34 | 0.37 | 0.93 | 0.42 | 0.93 |
- Notes: p-Values in bold are statistically significant to an alpha value of .05.
3.5 Ecosystem CO2 fluxes
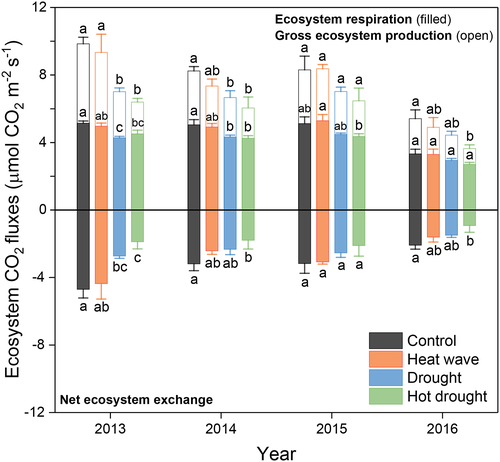
Droughts significantly suppressed growing season average ecosystem CO2 fluxes (NEE, ER and GEP) across the 4 years, and such effect was smaller in 2015 than the other 3 years (drought × year interaction, p = .03 and .08 for NEE and GEP, respectively; Figure 6, Figure S6 and Table 1). Heat waves had no significant effects on any growing season average CO2 fluxes, whereas there was a marginally significant positive effect on NEE (p = .07, Figure 6, Figure S2 and Table 1). Across all CO2 fluxes, there were no significant two-way interactions between drought and heat wave, nor three-way interactions among drought, heat wave and year; however, the magnitude of CO2 fluxes was generally the lowest in the hot drought treatment (Figure 6).
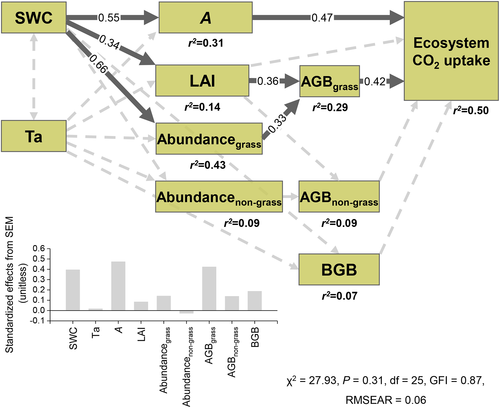
Results of SEM suggest that SWC had positive effects on A, LAI and grass abundance. LAI and grass abundance further had positive effects on AGB of grass. A and AGB of grass had positive effects on ecosystem CO2 uptake. Air temperature (Ta) had no significant effects on other variables (Figure 7).
4 DISCUSSION
It has long been recognized that carbon cycling processes in semiarid grasslands are highly sensitive to climate change (Biederman et al., 2017; Christensen, Coughenour, Ellis, & Chen, 2004). Here we conducted a full factorial manipulative experiment to test single and especially interaction of climate extremes, which is more meaningful and powerful in predicting global change effects than single-factor studies (Luo et al., 2008; Zhu, Chiariello, Tobeck, Fukami, & Field, 2016). Importantly, we measured physical and biological responses across multiple levels of ecological hierarchy simultaneously, allowing us to identify comprehensive mechanisms of grassland carbon cycle response to heat wave and drought.
4.1 Drought impacts on grassland carbon cycling across hierarchical levels
Overall, drought reduced stomatal conductance and leaf photosynthetic rate of all three dominant grass species, Leymus chinensis, Stipe grandis and Achnatherum sibiricum (Table S2), partly supporting our first hypothesis that reduced SWC would have a negative effect on stomatal conductance, reducing leaf photosynthetic rate (Figure 2). Our results are in accordance with other drought studies showing that plants may respond to water deficit by closing their stomata to prevent water loss, consequently curtailing leaf photosynthetic rate due to reductions of CO2 diffusion from air into leaf (Asensio, Penuelas, Ogaya, & Llusia, 2007; Erice et al., 2011). However, drought did not reduce chlorophyll fluorescence (around 0.8, Figure 2), the optimal value of which is about 0.83 for most non-stressed plant species (Björkman & Demmig, 1987). Our results suggest that immediate but transient stomatal closure allowed plants to tolerate the water stress without permanent leaf damage.
Decreased leaf photosynthesis of grasses led to reductions in AGB of grasses fuctional group under drought. Additionally, relative abundance of grass was generally reduced in the face of drought (Figure 4b). It means grass functional group is vulnerable to drought in this simiarid grassland. However, community-level AGB was not significantly reduced by drought (Figure 5a), which was attributed to the fact that AGB and relative abundance of non-grass functional group were increased at the same time (Figure 4b). This may be because many shrub and forb species in this grassland, such as Artemisia frigida, Potentilla acaulis and Carex, are characterized by drought tolerance or/and strong colonization ability (Y. Gao et al., 2009; Y. Z. Gao et al., 2007). Such compensatory effects among major components at the functional group levels buffered the effects of climate inter-annual and seasonal variability on community-level structure and biomass in this mature grassland with high species richness and community biodiversity (Bai et al., 2004; Liu et al., 2017).
In addition to biomass, whole community-level structure was stable in the face of drought (Figure S5b, c, and d). Taken together, our results suggest aboveground components of this semiarid grassland were resistant to the drought of ~60-year recurrence interval. The minor changes in community structure and AGB under droughts in this study might also partly result from feedbacks of root system response. There was a slight non-significant increasing trend of BGB in the drought treatment (Figure 5), possibly due to plant structural adaptive strategies in response to water stress; that is, drought stimulated translocation of newly assimilated carbon from shoot to root (Burri et al., 2014; Huang & Fu, 2000; Sanaullah, Chabbi, Rumpel, & Kuzyakov, 2012) to increase the potential for water and nutrient uptake (van der Molen et al., 2011). Stronger root systems in turn promote resistance of aboveground parts to climate stress.
SEM results suggest that decreases in leaf photosynthesis and AGB of grass via LAI and grass abundance under drought made large contribution to reduced net carbon uptake at the ecosystem level in this semiarid ecosystem (Figures 6 and 7). As we hypothesized, ecosystem CO2 uptake in response to water stress was strongly regulated by photosynthesis at the individual level (Figure 7), as CO2 uptake directly achieved by this metabolic process. Individual photosynthesis was mainly controlled by stomatal conductance (Figure 3), indicating stomatal conductance is a powerful proxy for ecosystem CO2 uptake.
Prior manipulative experiments in this grassland have demonstrated that LAI has a positive relationship with carbon uptake in the face of precipitation changes at the ecosystem scale (Liu et al., 2017). A multiple-model study at this site suggested that inter-annual variability of GEP was attributed to responses of A and LAI to soil water (Hu et al., 2018). Our SEM results provide an insight into positive effects of LAI on ecosystem CO2 uptake and suggest that LAI regulated CO2 uptake through AGB of grasses, but not of forbs and shrubs (Figure 7). Besides, grass abundance could also exert positive effects on ecosystem CO2 uptake via AGB of grass, while non-grass abundance had no significant effects. It highlights the key and important role of grass in controlling ecosystem CO2 uptake, consistent with vegetation removal experiments showing that the greatest decrease in CO2 sink strength after warming when grasses were present in peatlands (Ward et al., 2013) and that grass removal lead to larger losses in CO2 sink than shrub removal under drought (Kuiper et al., 2014).
4.2 Heat wave impacts on grassland carbon cycling across hierarchical levels
Heat wave did not affect chlorophyll fluorescence while slightly decreased leaf photosynthetic rates for all the species (Figure 2), consistent with the negative relationship between leaf temperature and stomatal conductance (Figure 3). Our results suggest that photosynthesis may remain resistant to temperatures as high as 38°C in the dominant species of this long-term fenced semiarid grassland.
Similar to drought, functional group compensation, decreasing grass and increasing non-grass biomass, was also found under heat wave during the first 3 years (Figure 4a), maintaining the community-level AGB largely unchanged. However, a negative AGB response was measured in the fourth year, when AGB of grass and non-grass declined together (Figure 5a). We suggest the AGB compensatory effects disappeared because of the cumulative negative effects of 4 years of heat waves on root production, limiting nutrient and water uptake and ultimately aboveground growth (Figure 5b). Reduced AGB in the fourth year advances understanding from prior, shorter-term manipulative heat wave experiments showing AGB is little affected after 1–2 years heat wave treatment, especially when soil moisture remains sufficient (De Boeck et al., 2011; De Boeck et al., 2016; Dreesen et al., 2012; Hoover et al., 2014). It is unknown whether reductions in BGB were prevalent in these prior heat wave studies, because it was not measured. It is also unclear whether the observed unchanged AGB in prior short-term heat wave experiments would have shown declines after additional years.
Our results that community-level biomass both aboveground and belowground were significantly reduced in response to heat wave (Figure 5), in agreement with another heat wave experiment suggesting that a 7-day heat wave of +12°C above ambient decreased leaf, stem and root biomass (Bauweraerts et al., 2014). However, a recent meta-analysis suggested that experimental warming stimulates grassland aboveground and belowground primary productivity (Wang et al., 2019). Large reductions in BGB dominated the negative response of TB, also contrasting with past findings that long-term climate warming shifted TB allocation belowground (Liu et al., 2018). These results hightlight discrepant effects of long-term “press” warming and short-term “pulse” heat waves on grassland biomass.
4.3 Combined drought and heat wave impacts on grassland carbon cycling across hierarchical levels
Contrary to our third hypothesis, the interactions of drought and heat wave on ecosystem carbon cycling were not significant at any hierarchal level, regardless of timing of hot drought treatment (Table 1, S5 and S6). A potential limitation with respect to our examination of interactions was asynchronous warming for heat wave and hot drought treatments due to limited electrical supply at the research site. Fortunately, in the absence of large fluctuation in ambient environmental conditions during the two heating periods each year made the four treatments comparable to a large extent. Additionally, direct comparison of drought with hot drought treatment showed key states and fluxes of the hot drought treatment (e.g., A, AGB, NEE, ER and GEP), just non-significantly lower than those of the drought treatment alone. Therefore, we are confident that there were not significant interactions of drought and heat wave in this study.
In contrast to the single drought or heat wave treatment, we did not find compensatory effects between grass and non-grass functional groups under the hot drought treatment. Instead, AGB of both grass and non-grass were consistently reduced across the 4 years (Figure 4c). Hot drought plots had the lowest AGB of all treatments in each year, although the interactions of heat wave and drought were not significant (Figure 5a). It is because root production was reduced, similar to the heat wave treatment (Figure 5b), curtailing capacity for water and nutrition uptake as mentioned above. Importantly, SWC was lower under the hot drought treatment than the heat wave treatment alone, further limiting transportation of water and nutrition to aboveground plant parts. Consequently, the compensatory effects of plant functional groups which initially maintained AGB under the hot drought treatment disappeared after the first year.
Although the interactions of drought and heat wave on ecosystem CO2 fluxes were not significant, the hot drought treatment had the lowest magnitudes of NEE, ER and GEP in each year (Figure 6), suggesting apparent additive negative effects. This non-significance of interaction may be because the heat wave did not cause significant effects on soil moisture as compared with the drought alone (Figure 1). The additive negative effects of drought and heat wave on ecosystem CO2 exchange could result from negative effects of leaf temperature on stomatal conductance and thereby leaf photosynthetic rates (Figure 1e-h and 3) as well as larger reduction in AGB of grass (Figure 5c).
This study has direct implications for understanding of grassland structure and functions amid future climate changes. By connecting responses across multiple hierarchal levels, we can provide a more comprehensive mechanism behind carbon cycle response to climate extremes than past “patch” studies. Our findings indicate that individual physiological adjustments controlled photosynthesis responses, and then drove corresponding species biomass responses, ultimately co-regulating ecosystem carbon exchange. Meanwhile, individual structural adjustments and compensation effects between functional groups co-determined TB response.
ACKNOWLEDGEMENTS
This project was funded by the CAS Strategic Priority Research Programme (A) (Grant No. XDA20050103, XDA19030202) and the International Cooperation and Exchange of National Natural Science Foundation of China (Grant No. 31761123001, 31761143018). Great thanks for the help of the Inner Mongolia Grassland Ecosystem Research Station.
CONFLICT OF INTEREST
There is no conflict of interest to declare.


