Shade avoidance responses become more aggressive in warm environments
Funding information: Deutsche Forschungsgemeinschaft, Grant/Award Number: ZU259/2-1; Deutscher Akademischer Austauschdienst and Secretariat of Science of Argentina, Grant/Award Number: DA/16/04; Fondo para la Investigación Científica y Tecnológica, Grant/Award Number: PICT-2016-1459; Germany's Excellence Strategy, Grant/Award Number: CEPLAS EXC2048/1 ID 390686111; Universidad de Buenos Aires, Grant/Award Number: 20020100100437
Abstract
When exposed to neighbour cues, competitive plants increase stem growth to reduce the degree of current or future shade. The aim of this work is to investigate the impact of weather conditions on the magnitude of shade avoidance responses in Arabidopsis thaliana. We first generated a growth rate database under controlled conditions and elaborated a model that predicts daytime hypocotyl growth as a function of the activity of the main photosensory receptors (phytochromes A and B, cryptochromes 1 and 2) in combination with light and temperature inputs. We then incorporated the action of thermal amplitude to account for its effect on selected genotypes, which correlates with the dynamics of the growth-promoting transcription factor PHYTOCHROME-INTERACTING FACTOR 4. The model predicted growth rate in the field with reasonable accuracy. Thus, we used the model in combination with a worldwide data set of current and future whether conditions. The analysis predicted enhanced shade avoidance responses as a result of higher temperatures due to the geographical location or global warming. Irradiance and thermal amplitude had no effects. These trends were also observed for our local growth rate measurements. We conclude that, if water and nutrients do not become limiting, warm environments enhance the shade avoidance response.
1 INTRODUCTION
Stem growth can affect the yield of agricultural crops (Foulkes et al. 2011). Excessive growth enhances the vulnerability to wind and the associated risk of lodging, as well as the competition for resources between the stem and harvestable organs. Variations in these factors were of fundamental importance for the success caused by the introduction of dwarfing genes during the breeding process that generated the green revolution. At the other end of the scale, short plants can also be suboptimal as the resulting canopy architecture involves strong overlap among leaves and poor penetration of the light. This condition may result in upper leaves with photosynthesis saturated by light, simultaneously with lower strata with negative net carbon dioxide exchange.
The light environment has a major influence on stem growth. Due to the optical properties of the leaves, which absorb strongly in the ultraviolet (UV) blue and red wavelengths while transmitting and reflecting more in the far-red range, the presence of nearby vegetation reduces the red/far-red ratio even if the plants are close by without shading each other and reduces the irradiance as mutual shading becomes more intense (Ballaré & Pierik, 2017; Casal, 2013; Franklin, 2008; Martínez-García et al., 2010). These neighbour signals reduce the activity of photosensory receptors that control stem growth. The low red/far-red ratios and/or the reduced red irradiances of canopy shade are perceived by phytochrome B (phyB) in Arabidopsis thaliana (Robson, Whitelam, & Smith, 1993; Sellaro et al., 2010; Trupkin, Legris, Buchovsky, Rivero, & Casal, 2014), Brassica rapa (Devlin, Rood, Somers, Quail, & Whitelam, 1992), cucumber (Ballaré, Casal, & Kendrick, 1991; López Juez et al. 1992), and tomato (Casal, 2013). The low blue light irradiances and low blue/green ratios caused by neighbours are perceived by cryptochrome 1 (cry1) and cry2 (Keller et al., 2011; Sellaro et al., 2010). Increasing intensities of neighbour cues initiate the so-called shade avoidance responses, including enhanced stem growth, mainly by reducing the activities of phyB and cry1. At high irradiances (as those observed in the field), phyA becomes an effective sensor of red irradiance in addition to far-red light, and, therefore, phyA also contributes to the inhibition of stem growth by progressive reductions in canopy shade (Franklin, Allen, & Whitelam, 2007; Sellaro et al., 2010). Finally, the UV-B RESISTANT 8 (UVR8) receptor perceives brief interruptions of canopy shade to reduce stem growth (Moriconi et al., 2018). Major points of signalling convergence downstream these photosensory receptors include PHYTOCHROME INTERACTING FACTORS (Hornitschek et al., 2012; Leivar & Quail, 2011) and CONSTITUTIVE PHOTOMORPHOGENIC 1 (Lau & Deng, 2012; Pacín, Semmoloni, Legris, Finlayson, & Casal, 2016).
In addition to its role in the perception of the light environment, phyB is also able to sense temperature (Jung et al., 2016; Legris et al., 2016). Although high, compared with low red/far-red ratios, increase the proportion of phyB in its active conformation, warm temperatures have the opposite effect via thermal reversion from the active to the inactive phyB conformer. When irradiance is not high, phyB is in a steady state that depends strongly on temperature (Sellaro, Smith, Legris, Fleck, & Casal, 2019). The blue light receptor phototropin (Fujii et al., 2017) has also been shown to sense temperature, but this photoreceptor only has a transient effect on straight stem growth (Folta & Spalding, 2001).
Plants can eventually experience similar neighbour cues under different weather conditions. The overall irradiance can be affected by solar angle and clouds, and air temperature patterns are very dynamic. The aim of this work was to elucidate the degree of impact of weather conditions (specifically irradiance patterns, mean temperature, and thermal amplitude) on the response of stem growth to plant neighbour cues. This issue is particularly important in the scenario of global warming and climate change because crops, where stem growth is adjusted to current weather conditions, could become suboptimal in terms of architecture in the future. A reductionist approach could simply involve testing the effect of similar neighbour signals in combination with different temperatures and overall irradiances under controlled environments. The latter type of experiments has already been conducted in the past (Halliday & Whitelam, 2003; Mazzella, Bertero, & Casal, 2000; Patel et al., 2013; Wall & Johnson, 1982; Weinig, 2000). Although informative, such approach bears serious limitations to predict plant responses under natural conditions for two reasons. One is that the natural environment is more complex than the conditions typically used in growth cambers. For instance, light and temperature fluctuate diurnally, and this pattern is difficult to simulate in combination with many light conditions. Second, some environmental variables such as overall irradiance and temperature do not fluctuate fully independently in nature, and the use of simulated combinations do not necessarily reflect those that a plant is more likely to find in the field. Therefore, to address this issue, we followed a more sophisticated approach, where we conducted experiments under controlled conditions to extend a stem growth rate model based on phyB activity (Legris et al., 2016) to incorporate the action of cry1, cry2, and phyA. We also analysed the need to incorporate ad hoc model terms to account for the effects of diurnal thermal and irradiance fluctuations. Then, we generated a growth rate database by cultivating A. thaliana plants in the field under sunlight and two levels of shade and tested against this data the predictions of the model parameterized under controlled conditions. Because the model predicted stem growth rate with reasonable accuracy, we used it in combination with weather data from different regions of the Earth and models that predict future trends to evaluate the impact of realistic weather conditions on the shade avoidance response.
2 MATERIALS AND METHODS
2.1 Plant material
We used seedlings of A. thaliana of the wild-type (WT) Columbia background in all the experiments. WT plants and the phyA-211, phyB-9, phyA-211 phyB-9, cry1-304, cry2-1, and cry1-304 cry2-1 mutants (for references, see Sellaro, Pacín, & Casal, 2012) were included in all the experiments, except those aimed to model the action of either phyA or cry1 and cry2, which included only the relevant mutants. For all the experiments, 10–15 seeds per genotype were sown on 8 ml of 0.8% agar in clear plastic boxes and kept in the dark at 4°C for 4 days. Then, they were transferred to white light conditions for 3 days in a growth room at 22°C with a photoperiod of 10 hr under 100 μmol·m−2·s−1 (400–700 nm) provided by a mixture of fluorescent and halogen lamps (red/far-red ratio = 1.1). At the time of initiation of the photoperiod of the fourth day, the seedlings were transferred to the corresponding experimental light conditions.
2.2 Hypocotyl length increment
For field experiments and all indoor experiments under constant conditions, pictures of the seedlings were taken at the beginning and at the end of the photoperiod of the fourth day. For experiments with fluctuating temperatures, pictures were taken every 2.5 hr during the photoperiod of the fourth day. For experiments with fluctuating light, pictures were taken at the beginning, at the middle, and at the end of the photoperiod of the fourth day. Hypocotyls were measured using image processing software (Sellaro, Hoecker, Yanovsky, Chory, & Casal, 2009), and length increments were divided by the duration of the period to obtain growth rates. Data obtained in experiments under controlled conditions are shown in Table S1, and those obtained in the field are shown in Table S2. When using growth data to either adjust or test the growth model, the hourly growth rates were converted to length increments during a period of 9 hr (by multiplying by 9) for consistency with the original model (Legris et al., 2016).
2.3 Light treatments under controlled conditions
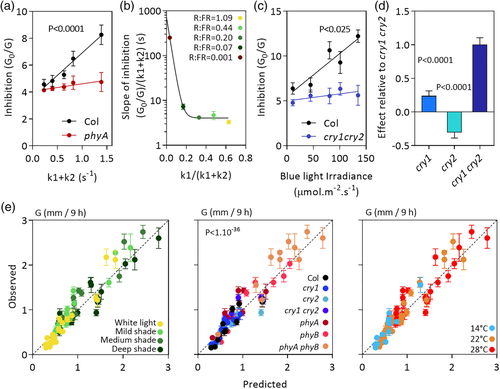
To model the contribution of phyA (see Figure 1a,b), we used five different mixtures of red and far-red light provided by 150-W incandescent R95 lamps (Philips) in combination with a water filter, a yellow, orange, and red acetate filter set (LEE filters 101, 105, and 106, respectively), either alone or plus a green acetate filter (LEE filters 138, 121, or 089), or six blue acrylic filters (Paolini 2031, Buenos Aires, Argentina). Scans of the light fields were obtained with a spectroradiometer (USB400, Ocean Optics, USA). The red/far-red ratios were 1.09, 0.44, 0.20, 0.07, and 0.001, and the irradiances ranged from 63 to 834 μmol·m−2·s−1 (spectra are shown in Figure S1a). Spectral data were used in combination with photoconversion cross-section data (Mancinelli, 1994) to obtain the rates of photoconversion from Pr to Pfr (k1) and from Pfr to Pr (k2). To model the contribution of cry1 and cry2 (see Figure 1c,d), blue light was provided by light-emitting diodes (the spectrum is shown in Figure S1b).
To test the model under stable conditions of light and temperature, simulated sunlight was provided by a combination of fluorescent and halogen lamps (100 μmol·m−2·s−1, between 400 and 700 nm), and increasing degrees of shade were simulated by the combination with different green acetate filters (LEE filters 138, 121, or 089 for mild, medium, and deep shade, respectively). The red/far-red ratios were 0.76, 0.41, and 0.12, and the irradiances between 400 and 700 nm ranged from 18 to 70 μmol·m−2·s−1 (spectra are shown in Figure S1e). Different growth chambers were used for the different temperature conditions (14°C, 22°C, and 28°C).
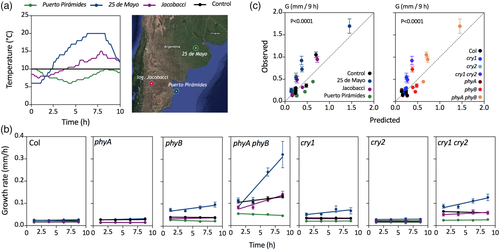
For experiments with temperature fluctuations (see below Figure 2), we used a growth chamber (Percival E-308; Percival Scientific Inc., Perry, IA, USA) with fluorescent light tubes (30 μmol·m−2·s−1 between 400 and 700 nm, the spectrum is shown in Figure S1c) and simulated real temperature patterns obtained from climate stations at three different locations in Argentina (25 de Mayo, Ingeniero Jacobacci, and Puerto Pirámides) for a date when photoperiod was 10 hr. The three cases show similar medium temperature but different thermal amplitudes.
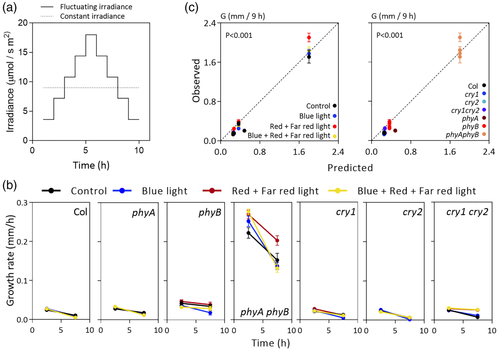
For experiments with light fluctuations (see Figure 3), we used a light-emitting diode panel with three light channels: red, far red, and blue (spectra are shown in Figure S1d). For the control, each one of the three channels was kept constant at 9 μmol·m−2·s−1. For the blue light treatment, the red and far-red channels were kept constant at 9 μmol·m−2·s−1, and blue light intensity was increased 20% every hour (starting with 3.6 μmol·m−2·s−1) during the first half of the photoperiod (when it reached maximum intensity, 18 μmol·m−2·s−1) and then decreased symmetrically, that is, 20% every hour during the second half of the photoperiod. The same pattern and intensity values were used for red plus far-red treatment, where the blue channel was kept constant and the red and far-red channels were shifted during the photoperiod. For the blue plus red plus far-red treatment, all the channels were shifted during the photoperiod following the same pattern.
2.4 Field experiments
On the fourth day, light-grown seedlings of all the genotypes were transferred either to unfiltered sunlight or under one of two different canopy shade conditions (mild and deep shade) in the experimental field of Facultad de Agronomía, University of Buenos Aires (latitude: 34.5914, longitude: 58.4798). Ten different experiments were performed at different dates, starting in June (winter) and ending in February (summer) to obtain a range of different light and temperature combinations. Temperature inside the growth boxes that contained the seedlings was recorded hourly by using a datalogger (DS1922L-F5# Thermochroni Button, Maxim Integrated, California, USA). Photosynthetically active radiation, blue, red, and far-red light, were recorded hourly by using a 4-channel light sensor (SKR 1850, Skye Instruments, Llandrindod Wells, UK).
2.5 Weather data
To investigate the impact of diurnal temperature fluctuations on hypocotyl growth rate, we searched a local weather database (Sistema de Información y Gestión Meteorológica INTA, Argentina, http://siga2.inta.gov.ar/). We identified locations and dates where the photoperiod was 10 hr. Then, we selected tree cases where mean temperature was similar (close to 10°C) and thermal amplitude was contrasting. One of the locations (25 de Mayo) showed considerable thermal amplitude; the second (Ingeniero Jacobacci) showed small thermal amplitude; and the third (Puerto Pirámides) showed thermal inversion caused by the important oceanic influence.
To apply the growth rate model at a global scale of current weather, maximum temperature, minimum temperature, and solar radiation data for 100 different locations were obtained from the Climate Change, Agriculture, and Food Security-Climate data portal (http://www.ccafs-climate.org). The processing of data sets was conducted by using GIS software (QGIS 3, http://www.qgis.org/). The data correspond to dates when the photoperiod is close to 10 hr (this excludes latitudes where days are longer throughout the year).
For future projections (year 2080) of weather conditions, the climate model mpi-echam5 (http://ccafs-climate.org/data_spatial_downscaling/) and the emission scenario A1B were used. The latter scenario predicts an integrated world characterised by rapid economic growth, a population that reaches 9 billion by 2050 and then declines gradually, and the rapid development of alternative energy sources that facilitate increased economic growth while limiting and eventually reducing carbon emissions. The starting point (current weather conditions) was defined by the conditions obtained from the Climate Change, Agriculture, and Food Security-Climate data portal, as described above.
2.6 Bioluminiscence assay
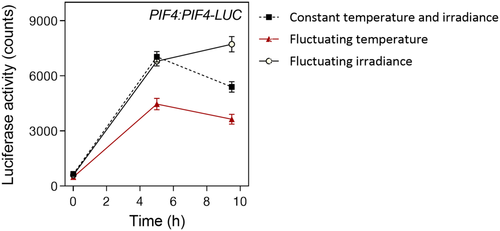
For bioluminescence assays, we exposed 3-day-old light-grown seedling of the Columbia WT carrying the PIF4:PIF4-LUC transgene to a photoperiod with irradiance or temperature manually adjusted hourly to obtain a peak at midday, compared with a control under constant light and temperature. Seeds carrying the bioluminescent PIF4 reporter were kindly provided by Salomé Prat (Centro Nacional de Biotecnología, Madrid, Spain) and will be described in further detail elsewhere. In the morning, light increased linearly from 41 μmol·m−2·s−1 during the first hour to 230 μmol·m−2·s−1 during the fifth hour. Similarly, temperature increased linearly from 13°C during the first hour to 27°C during the fifth hour. In both cases, the opposite trend was applied during the afternoon. The control was exposed to 135 μmol·m−2·s−1 and 20°C throughout the 10-hr photoperiod. Twenty-four hours before starting luciferase readings, 20 μL of 0.5-mM d-luciferin were added to each well. Luciferase activity was detected with a Centro LB 960 (Berthold, Bad Wildbad, Germany) luminometer.
2.7 Structure of the growth rate model

3 RESULTS
3.1 Basic growth rate model under stable light and temperature
The model developed by Legris et al. (2016) predicts the average hypocotyl growth of a 3-day-old light-grown seedling during the photoperiod as a function of phyB activity (Table S3a), temperature (Table S3b), the interaction between phyB and temperature (Table S3c), and white light irradiance. The last term is used to incorporate the activity of the additional photosensory receptors (phyA, cry1, and cry2), which are not included in the term corresponding to phyB. To make the model more accurate under natural radiation conditions, where changes in spectral composition can alter the relative activation of different photosensory receptors, we modelled the specific contributions of phyA, cry1, and cry2 under controlled conditions. As in previous models, growth rate (G) is represented as a function of maximum growth rate (G 0) divided by the sum of all the terms that reduce growth below the maximum (phyB, low temperature, interaction between phyB and low temperature, phyA, cry1, and cry2) plus 1 (Table S3), that is, G = G 0 if there are no inhibitory terms.
To parameterize the term corresponding to phyA, we measured G both in WT and the phyA mutant 3-day-old light-grown seedlings exposed to a photoperiod of different mixtures of red plus far-red light, each one of them at a range of irradiances. Figure 1a shows the G 0/G ratio for one of these red plus far-red light mixtures plotted against the sum of the rates of photoconversion from Pr to Pfr (k1) and from Pfr to Pr (k2). G 0/G increases above 1 when there is inhibition (i.e., G < G 0). For a given spectral composition, k1 + k2 increases with irradiance. The phyA mutant retained a significant degree of inhibition (equivalent to the phyB-mediated inhibition predicted by Legris et al., 2016), and the difference in slope between the WT and phyA provides an estimate of the inhibitory effect of phyA. Figure 1b shows the difference in slope between the WT and phyA observed in plots similar to that shown in Figure 1a but with different red/far-red ratios. The effect of spectral composition is captured by the k1/(k1 + k2) ratio (we prefer the latter to the red/far-red ratio itself because the photoconversion rates are calculated with information provided by the whole spectrum [Mancinelli, 1994]). The inhibitory effect is maximal for almost pure far-red light (the lowest k1/[k1 + k2]) and steeply decreases with increasing proportions of red light to reach a plateau. This pattern is consistent with the well-known maximal effect of phyA under far-red light (Quail et al., 1995), the contribution of phyA even under pure red light when the irradiance is high enough (Franklin et al., 2007), and the lack of effects of red/far-red ratio in the upper range of ratios (Sellaro et al., 2010). Then, the contribution of phyA was modelled by incorporating to the denominator a term where the activity of phyA depends on irradiance (k1 + k2) in a manner that, in turn, depends on spectral composition and more specifically red/far-red ratio (k1/[k1 + k2]; Table S3d).
To parameterize the terms corresponding to cry1 and cry2, we measured G both in WT and cry1 cry2 mutant 3-day-old light-grown seedlings exposed to a photoperiod of different irradiances of blue light. Figure 1c shows the G 0/G ratio plotted against blue light irradiance (400–500 nm), and the difference in slope indicates the combined contribution of cry1 and cry2. To discriminate the role of each one of these receptors, we compared the double mutant with the cry1 and cry2 single mutants under a range of simulated sunlight and shade conditions and calculated the average ratio between G for each mutant and G for cry1 cry2. Figure 1d indicates strong genetic redundancy between cry1 and cry2 because the cry2 mutation on its own causes a reduction of G (reflected mathematically as “negative inhibition”) but significantly released the growth potential when combined with the cry1 mutation. The contribution of cry1 and cry2 was modelled by incorporating a term where blue light irradiance is multiplied by the slope of response when both cry1 and cry2 are present (Figure 1d) multiplied by the specific contribution (Figure 1e, Table S3e).
To test the performance of the model, seedlings of the WT and of the phyA, phyB, phyA phyB, cry1, cry2, and cry1 cry2 were exposed to different simulated sunlight and shade conditions and different temperatures. Figure 1e shows the relationship between observed and predicted G, which did not significantly depart from the 1:1 line and showed adequate accuracy.
3.2 The impact of daily temperature fluctuations
Although the model was able to capture the impact of temperature, the above experiments were conducted under conditions where this parameter remained constant through the photoperiod, which is not typical of natural settings. To investigate the impact of temperature fluctuations, we first searched for natural patterns characterised by divergent daily trends and not very large differences in average temperature, in places with a photoperiod of 10 hr (i.e., similar to the photoperiod used in our indoor experiments). We selected three locations in Argentina (Figure 2a), and we exposed 3-day-old light-grown seedling of the WT and photosensory receptor mutants to a stable photoperiod in a growth chamber manually set to reproduce the three temperature patterns and a constant temperature control. We then measured G at different times of the photoperiod (Figure 2b). The analysis of the residuals unaccounted by the growth rate model indicated that the accuracy of fit was improved by a factor reducing growth rate with increasing thermal amplitude in seedlings of the WT and of the phyA and cry2 mutants (Table S4). This effect was not significant for the phyB, cry1, and cry1 cry2 mutants and was actually negative in the phyA phyB double mutant (Table S4). Thermal amplitude was calculated as the difference between maximum and minimum temperature with a negative signal if temperature decreases rather than increase towards midday, as in the case of Puerto Piramide (Figure 2a). Our interpretation of this effect is that in the WT (as well as phyA and cry2), during the photoperiod maximum, hypocotyl growth rate occurs in the morning, and then growth decreases gradually (Nozue et al., 2007; Sellaro et al., 2012). Therefore, if a given average temperature results from lower morning temperatures and higher values at midday, there is a coincidence between lower temperature and the time of maximal growth potential, which lowers average G. The phyB, cry1, cry1 cry2, and phyA phyB mutants have higher rates not in the morning but later in the photoperiod and, therefore, do not become affected by temperature fluctuations in the same way. The model incorporating this additional term (Table S3f) accounted for the G values observed under fluctuating temperatures with reasonable accuracy (Figure 1c).
3.3 The impact of daily light fluctuations
Following the same argument used for the analysis of fluctuating temperatures, we exposed 3-day-old light-grown seedling of the WT and photosensory receptor mutants to a photoperiod with irradiance manually adjusted hourly to obtain a peak at midday. We modified the red plus far-red light or the blue light component leaving the other constant or both components, and we also included a control without temperature fluctuations (Figure 3a). We then measured G during the first and second halves of the photoperiod (Figure 3b). The model (which is based on average irradiance values) was able to predict G under these conditions with reasonable accuracy, and no need for a correction associated to light fluctuations was apparent (Figure 3c).
3.4 The impact of temperature or light fluctuations on PIF4 dynamics
The above experiments indicate that, compared with a stable condition with the same average temperature and irradiance, fluctuations in temperature peaking at midday tend to reduce growth, whereas fluctuations in irradiance do not have large effects. Because one of the most important players in the control of hypocotyl growth by light and temperature is PIF4 (Franklin et al., 2011; Hornitschek et al., 2012; Huq & Quail, 2002; Niwa, Yamashino, & Mizuno, 2009), we investigated whether light and/or temperature fluctuations affect PIF4 dynamics. Figure 4 shows that compared with the stable conditions, increasing thermal amplitude significantly decreased PIF4 levels at midday, whereas fluctuating light only had effects at the end of the photoperiod. This observation offers a molecular correlate to the observed pattern of the physiological output.
3.5 Model performance in the field
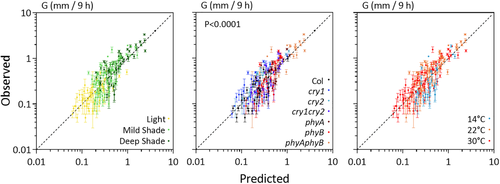
To test the model developed under controlled conditions, we exposed 3-day-old light-grown seedling of the WT and photosensory receptor mutants to a photoperiod (10 hr) of natural radiation either under full sunlight or under two levels of natural shade provided by grass canopies of different stature. The experiment was repeated on 10 different dates between the beginning of winter and mid-summer to obtain a range of temperatures and irradiances. Light and temperature conditions inside the boxes where the plants were grown were monitored every hour. The daily average values were used as inputs to the model to estimate G (Table S3h). Figure 5 shows the relationship between observed and predicted data. The relationship did not departure significantly from the 1:1 ratio. For some of the mutants, the model underestimated field growth rates under conditions that combine shade and warm temperature (Figure S2). Conversely, the WT showed no obvious bias, and, therefore, the model can predict G of WT seedlings under field conditions with reasonable accuracy. The analysis of adjusted R2 values indicates that all the terms contributed to account for the field data (Table S6). The weakest contribution was that of the term reflecting the interaction between low temperature and high phyB activity, likely because the latter combination was not as frequent in our field conditions as under controlled conditions.
3.6 Impact of weather conditions on shade avoidance
To investigate the impact of weather conditions on shade avoidance, we first downloaded light and temperature data from 100 locations distributed over the Earth at the time of the year when the photoperiod is 10 hr (Figure 6a, Table S5). This photoperiod occurs only within certain latitudes, and very high latitudes are not included due to their extremely low temperatures (which are not suitable for Arabidopsis growth). Light and temperature data were used to estimate G under sunlight conditions and corrected by the impact of the canopy to estimate G under mild and strong shade conditions. Figure 6b shows estimated G values under sunlight and shade conditions, plotted against the mean irradiance, mean temperature, or thermal amplitude corresponding to each location (G values are the same in the three plots). The environmental values correspond to sunlight conditions (even though shade conditions were used to estimate G) because the aim is to explore the impact of weather. Of the three environmental variables, only mean temperature affected the magnitude of the shade avoidance response (the interaction between mean temperature and light/shade condition is significant at p < 10−26). The magnitude of the difference between G under sunlight compared with shade conditions increased under warmer temperatures.
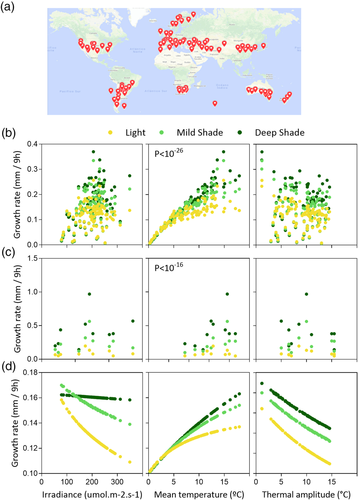
Figure 6c shows a similar plot, but, in this case, G corresponds to the values measured in our field experiments (Table S2, rather than model estimates) and their corresponding environmental data. Compared with the values observed in nature, the range is shifted towards higher temperatures because in our experiments, the seedlings were exposed to natural radiation for 10 hr even in the warm season, when natural photoperiod is above 10 hr. Despite this, the results show the same pattern providing independent support to the conclusion based on the application of the model: Of the three environmental variables, only mean temperature affected the magnitude of the shade avoidance response (the interaction between mean temperature and light/shade condition is significant at p < 10−16).
Finally, in Figure 6d, G was again estimated by using the model and the variables corresponding to the 100 world locations, but, in this case, only the variable plotted in abscissas was varied, whereas for the other two, the average for the 100 locations was used as input. This procedure eliminates the natural correlations among temperature, irradiance, and thermal amplitude. The results of this exercise show that irradiance and thermal amplitude theoretically do have impact on shade avoidance, which becomes more intense under better irradiated conditions with weaker thermal amplitude. The comparison of Figure 6a,c indicates that the effect of irradiance and thermal amplitude are not obvious in natural settings because they become diluted and/or counteracted by variations in the other variables.
3.7 Predicted impact of climate change on the magnitude of shade avoidance responses
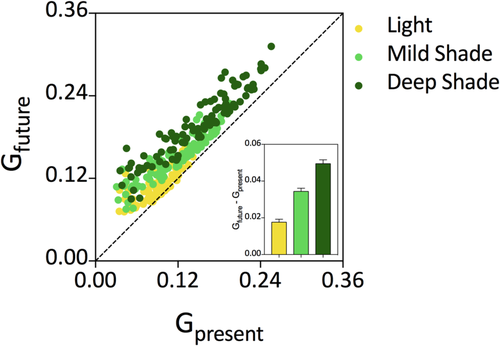
By using current weather data in combination with a model that estimates climate trends, we obtained predicted whether conditions for 2080 at a global scale. These data were used as input for the growth rate model (Table S3h) to estimate current and future growth rate under sunlight and two different degrees of shade. In the plot of future versus current growth rate, most of the points are above the 1:1 line (Figure 7). This pattern is consistent with the fact that the elevation of average temperature with global warming increases hypocotyl growth. The extent of change (future minus current estimated growth) is significantly higher for the seedlings grown under deep shade, compared with mild shade or sunlight (Figure 7, inset). This indicates that shade avoidance responses are predicted to increase in a scenario of global warming. It must be emphasised, however, that this exercise is valid only to investigate the impact of future combinations of temperature, irradiance, and thermal amplitude, whereas a prediction of the actual growth rates would require the incorporation of other variables to the model (e.g., water availability).
4 DISCUSSION
Our understanding of the mechanisms involved in sensing the degree of shade or temperature as well as of the nature of the downstream signalling steps has progressed substantially in recent years (see Section 1 for references). In this context, it is fair to ask how accurately this knowledge, obtained largely under controlled conditions, accounts for the patterns of plant growth in the field. Here, we present a model that reasonably predicts hypocotyl growth rate in A. thaliana seedlings during the photoperiod as a function of field conditions of light and temperature (Figure 5). The structure of the model resembles that used for previous hypocotyl growth models (Legris et al., 2016;Rausenberger et al., 2010; Sellaro et al., 2010) as it is based on the maximum growth values divided by terms that represent the conditions that reduce growth below the maximum (Table S3h). However, it differs from previous models because it predicts growth rate within a specific time window rather than final hypocotyl length (Rausenberger et al., 2010; Sellaro et al., 2010); it incorporates light and temperature inputs as opposed to models based on light conditions only (Rausenberger et al., 2010; Sellaro et al., 2010); and/or it dissects phyB, phyA, and cry activity rather than phyB alone or a general term for various photosensory receptors (Legris et al., 2016; Rausenberger et al., 2010). In addition, the model incorporates several interactions between light and temperature conditions that fine tune the predictions. The model predicts the growth rate of WT seedlings in the field with reasonable accuracy (Figures 5 and S2) and was applied here with that purpose (Figures 6 and 7). However, it underestimates the growth rates of some mutants under shade plus warm temperatures (Figure S2), that is, a combination of genetic and environmental conditions largely unexplored in the literature, which will require further analysis.
When compared with the conditions normally used in growth chambers, one of the distinctive features of the natural environment is the fluctuation of light and temperature, which often peak close to midday. Our analysis did not reveal a significant impact of the light fluctuations (i.e., the daily light average was a sufficiently accurate input, Figure 3). However, we did observe that hypocotyl growth rate decreased with thermal amplitude (Figure 2). A reasonable interpretation of this observation could be based on the fact that faster hypocotyl growth rates occur in the morning (Nozue et al., 2007; Sellaro et al., 2012). Larger thermal amplitudes would imply lower morning temperatures; therefore, growth rate would be limited by low temperatures at the time of maximum potential. Thermal amplitude decreased the abundance of PIF4 (Figure 4), which is a key driver of hypocotyl growth (Franklin et al., 2011; Hornitschek et al., 2012; Huq & Quail, 2002; Niwa et al., 2009).
We applied the model to investigate the impact of weather conditions (incoming irradiance, average temperature, and thermal amplitude) on the hypocotyl growth rate response to shade. We used weather conditions typical of different locations of the world at the time of the year when the photoperiod is ~10 hr (Figure 6a). The latter is the photoperiod under which the model was developed under controlled conditions and tested in the field. The model indicates a significant positive effect of average temperature on the extent of response to shade (Figure 6b). Meanwhile, neither incoming irradiance nor thermal amplitude affected the magnitude of shade avoidance. Although more restricted in terms of spread of weather conditions, the actual field data supports the same conclusion (Figure 6c). Therefore, for a given genotype, shade avoidance responses tend to be more intense at warmer locations of the Earth. A different issue that remains to be elucidated is whether there is adaptation and whether the genotypes typical of warmer places are more or less responsive to shade than those from cooler areas. It must also be noted that the model does not incorporate other environmental conditions (water and nutrients), which can also limit growth. A stronger shade avoidance under warm conditions would reduce the double jeopardy caused by the low light input for photosynthesis under shade plus the high consumption of carbohydrates in respiration under high temperatures (Casal & Balasubramanian, 2019).
Different features of the system could generate the observed synergism between shade and warm temperature on the growth rate of the hypocotyl. For instance, the activity of phyB is more affected by warm temperatures under shade than under full sunlight conditions (Sellaro et al., 2019). The abundance of PIF4 is synergistically increased by shade and warm temperatures (Legris, Nieto, Sellaro, Prat, & Casal, 2017).
There are previous reports showing that plants may exert a stronger responses to neighbour signals at warmer than at cooler temperatures when light and temperature conditions are manipulated independently (Halliday & Whitelam, 2003; Mazzella et al., 2000; Patel et al., 2013; Wall & Johnson, 1982; Weinig, 2000). One could therefore ask whether the model approach was actually necessary in the first place. The observations reported here provide a conclusive answer to this question. The model approach was necessary because under natural conditions, light and temperature features of the environment do not fluctuate in a fully independent manner (Legris et al., 2017). As a result of the latter, the impact of one variable can be compensated by the effects of another variable correlated with the former. In fact, if we change one variable at the time (i.e., leaving the others at a constant value), shade avoidance responses should be affected not only by average temperature but also by irradiance and thermal amplitude (Figure 6d). The impacts of irradiance and thermal amplitude only disappear when we use the actual records of these variables for different locations, which imply the natural correlations among environmental variables.
Our model predicts that as a result of global warming, shade avoidance responses would tend to increase in the future (Figure 7). Of course, other aspects of global climate change (e.g., water availability) are not considered by the current growth rate model and could distort this trend. Bearing in mind this limitation and the differences between A. thaliana and crop plants and taking into account that shade avoidance responses have both negative (Robson, McCormac, Irvine, & Smith, 1996) and positive effects (López Pereira, Sadras, Batista, Casal & Hall 2017) on crop productivity, the sensitivity to neighbour cues might need to be modified to optimize crop plant architecture in the context of global climate change.
ACKNOWLEDGEMENTS
We thank Salomé Prat (Centro Nacional de Biotecnología, Madrid, Spain) for her kind provision of Arabidopsis seeds carrying the PIF4:PIF4-LUC transgene. This work was supported by a joint proposal funded by Deutscher Akademischer Austauschdienst (DAAD) and the Secretariat of Science of Argentina (grant DA/16/04 to M.D.Z and J.J.C.), the Deutsche Forschungsgemeinschaft (grant ZU259/2-1 to M.D.Z.) and under Germany's Excellence Strategy CEPLAS EXC2048/1 ID 390686111 (to M.D.Z.), the University of Buenos Aires (Grant 20020100100437 to J. J. C.), and Agencia Nacional de Promoción Científica y Tecnológica (Grant PICT-2016-1459 to J. J. C.).


