Verification of the Fusarium-Increasing Properties of the Dominant Dwarfing Gene Ddw1 in triticale (×Triticosecale)
Funding: This project was supported by funds of the Federal Ministry of Food and Agriculture (BMEL) based on a decision of the Parliament of the Federal Republic of Germany partly via the Federal Office for Agriculture and Food (BLE) under the innovation support programme GetreideProtekt (Grant 281B202116) and partly via the Fachagentur für Nachwachsende Rohstoffe e.V. (FNR) within the project SENSELGO (Grant FKZ 22024515).
ABSTRACT
Dwarfing genes that are considerably reducing plant height are used in many cereals. In triticale, the rye-derived dominant dwarfing gene Ddw1 was introgressed in commercial varieties. It has already been shown that this gene increases Fusarium head blight (FHB) susceptibility in one segregating population. We aimed for verifying this effect in the genetically unrelated doubled haploid (DH) population Cando (Ddw1) × Tritikon (ddw1), with 182 progenies in an experiment with artificial inoculation across six location–year combinations (environments). Linkage mapping was performed with DArTseq markers. The progenies significantly (p < 0.001) varied for FHB severity, plant height and heading stage with high entry-mean heritabilities (0.85–0.98). The population showed a bimodal distribution for plant height. A significant QTL on chromosome 5RL was found for all three traits explaining 38%, 62% and 43% of the genotypic variation for FHB severity, plant height and heading stage, respectively, and most likely representing Ddw1. This gene increased FHB severity by 5.6 percentage points, delayed heading by 2.7 EC stages and reduced plant height by 29.6 cm on average. To use this gene in practical triticale breeding, the genetic background must be enriched with FHB resistance QTL to counterbalance the negative effect of Ddw1 either by introgression of major FHB QTL from exotic sources or by genomic selection within the adapted gene pool.
1 Introduction
Reduced height (Rht) or semidwarfing genes are successfully integrated into international wheat breeding since the Green Revolution in the 1960s (Würschum et al. 2017). They provide a short stature and a higher spike fertility and allow a higher nitrogen application with a lower risk for lodging. Moreover, they seem to be better adjusted to heavy storms that are expected to increase with global climate change (Barten et al. 2022). Finally, they also require little or no use of growth regulators, which supports the reduction of pesticides in agriculture. Semidwarfing genes are now beginning to be used in other crops. In oats, there are already some varieties with the Dw6 gene (Milach, Rines, and Phillips 2002); in maize, a short-stature maize is being propagated in the United States based on the mutant br2 (Barten, Brown, and Cargill 2019); and in rye, the first short-strawed hybrid was registered in Germany in 2021 (‘Durinos’). In triticale, the dominant short straw gene Ddw1, which originates from rye, has been used in Poland for a long time in triticale breeding (Banaszak 2010), and more recently, some varieties were registered in Germany and Poland (e.g., ‘Grenado’, ‘Cando’ and ‘Pigmej’). Trini et al. (2021) reported that especially since the 2000s, this gene was more frequently used in triticale. Ddw1 was firstly described by Kobyljanski (1972) as spontaneous mutant (‘EM1 mutant’) from the germplasm collection of the Vavilov-Institute in St. Petersburg, Russia, and originally named Hl (Humilus). The gene was firstly mapped by Korzun, Börner, and Melz (1996) on chromosome 5RL. Ddw1 is a gibberellin acid (GA)–sensitive dwarfing gene (Börner et al. 1999) and cosegregates with a Gibberellin 2-Oxidase gene that is homoeologous to Rht12 in wheat (Braun et al. 2019). Previously, it was reported that Ddw1 not only reduces plant height (PH) in triticale but also delays heading by 2.2 EC stages and increases susceptibility for Fusarium head blight by 32.5% (Kalih et al. 2014).
Fusarium head blight (FHB) is a severe disease of all small-grain cereals caused by Fusarium graminearum, Fusarium culmorum and other Fusarium species. In the German breeding industry, FHB resistance in triticale is of high importance because it is tested in the official value of cultivation and use (VCU) tests during the registration process (Miedaner, Flamm, and Oberforster 2024). A higher susceptibility to FHB has also been observed for the GA-sensitive Dw6 gene in oats (Herrmann et al. 2020) and the GA-insensitive Rht-B1 and Rht-D1 genes in wheat (Srinivasachary et al. 2008; Miedaner and Voss 2008). As FHB-infected grains accumulate mycotoxins such as deoxynivalenol (DON) and zearalenone, which are particularly harmful to pigs, this is a problem when triticale is used as feed as is common in the European Union (Heraud et al. 2013).
The first observation on the Fusarium-increasing properties of Ddw1 was found in one biparental cross of an experimental triticale breeding line HeTi117-06 and the Polish cultivar Pigmej which had Ddw1 (Kalih et al. 2014). Because cross-specific effects could always be a cause in such investigations, we wanted to verify the results regarding Fusarium resistance with a second, unrelated cross, Cando × Tritikon. The objectives of this study were to (1) analyse the effect of Ddw1 in the triticale cultivar Cando on FHB resistance, PH and heading stage; (2) determine correlations among these traits; and (3) map the three mentioned traits in a doubled haploid (DH) triticale population of 182 lines.
2 Materials and Methods
A DH population of 182 winter triticale lines derived from the cross Cando × Tritikon was used in this experiment. Microspore culture procedure was followed to produce DH plants (Würschum, Tucker, and Maurer 2014). Cando was a high-yielding variety released in Germany in 2007 and containing the dwarfing mutant Ddw1 (TIW 540, Lantmännen Seed B.V.), Tritikon was released in 2003 possessing the wild-type allele ddw1 (TIW 367, Fr. Strube Saatzucht GmbH & Co. KG).
Field experiments were carried out in 2019 and 2020 at three locations: Stuttgart-Hohenheim (HOH, latitude 48°42′52.9″ N, longitude 9°11′15.5″ E, altitude 389 m, mean annual air temperature [MAAT, 2019–2020] 10.8°C, mean annual precipitation [MAP, 2019–2020] 762 mm), Oberer Lindenhof near Reutlingen (OLI, latitude 48°28′27.6″ N, longitude 9°18′15.6″ E, altitude 707 m, MAAT 8.8°C, MAP 947 mm), Bohlingen near Singen (BOH, latitude 47°43′31.4N, longitude 8°54′24.6″ E, altitude 400 m, MAAT 10.8°C, MAP 878 mm), thus comprising six environments (location × year combinations). Each entry was grown in single (HOH) or double-row microplots (BOH and OLI) 1.2–1.5 m long with approximately 40–60 kernels per row. Plots were randomised using an alpha lattice design with two replicates. The population was included in a larger experiment with another segregating DH population of 162 progenies (Tulus × Massimo, T × M) and 656 additional winter triticale breeding lines (BL) as described in Miedaner et al. (2022). Their results were not included in this paper; however, they were used to calculate the block adjustment with greater accuracy. Crop management followed standard field practices at each location, except for fungicides and growth regulators, which were not applied.
The highly aggressive isolate of F. culmorum strain FC46 (IPO 39-01) (Snijders and Van Eeuwijk 1991) was used for inoculation in the field trial each year at all locations. To produce inoculum, sterilised winter wheat grains were incubated with the fungus to produce enough conidiospores (Miedaner, Gang, and Geiger 1996). Experimental plots were inoculated three to four times per site to ensure that early, mid and late flowering genotypes were captured at least once at full flowering (EC 65). For this purpose, 100-mL m−2 spore suspension with a concentration of 7.5 × 10⁵ spores mL−1 was applied directly onto the ears using a small plot sprayer (Hege 75, Waldenburg, Germany).
All traits were scored visually on a plot basis. For FHB ratings, symptoms were estimated as a percentage (0%–100%) of infected spikelets showing premature bleaching. Two to three ratings were made in each of the six environments, with the last rating made before yellow ripening. In addition, PH in cm was measured after flowering. Heading stage was recorded according to the BBCH scale (Lancashire et al. 1991) at a time point when the ear tip of most genotypes emerged from the flag leaf sheath individually for each plot.
Marker data were obtained by a genotyping-by-sequencing approach from Diversity Arrays Technology, Canberra, Australia (www.diversityarrays.com). For analysis, only codominant SNP markers were considered. For better readability, markers were named ‘X’ plus Clone ID plus the two alleles separated by dots. As from biparental populations, no low allele frequencies were expected, markers were filtered for call rate > 95%, 20% missing values and a minor allele frequency of larger > 20%. Marker data were transformed into ABH format according to the parental marker alleles. If those had missing values, markers were dropped. Finally, 3028 markers were used. Linkage map was constructed by using the ASmap R package (Taylor and Butler 2017), but for display and comparison between populations, marker sequences were BLASTed in the wheat and rye reference genomes (https://galaxy-web.ipk-gatersleben.de; Zhu et al. 2021, Rabanus-Wallace et al. 2021). BLAST results were combined with linkage maps, and multiple BLAST hits for a single marker were first filtered by linkage groups and then sorted by e value, and the most like position was chosen. Only physical positions with e value smaller 10−4 were used, and the markers with no physical position were placed on an artificial chromosome called ‘unmapped’ with arbitrary positions.
Quantitative trait locus (QTL) mapping was performed by regressing each marker in codominant coding on the BLUEs. To adjust for errors from phenotypic data, the reciprocal of the squared standard errors of the BLUEs were used as weights and residual variance was fixed at one. Additionally, a ‘van Raden’ kinship matrix (Method 1, Van Raden 2008) was used to correct for genotype relationships. p values were extracted from Wald statistics. Explained genetic variance (pG) was estimated as difference of genetic variance estimated in a model with and without fixed marker effect divided by the genetic variance estimated in a model without marker effect. After a first run, the most significant markers were used as cofactors in second run. A linkage matrix was constructed so that markers were not used as cofactors when the linkage disequilibrium was smaller than 20 cM.
3 Results
FHB severity, PH and heading stage showed a wide range with a preponderance of genotypic variation (Table 1). All components of the ANOVA were highly significant. Entry-mean heritabilities were high throughout, ranging from 0.87 to 0.99.
| Parameter | Heading stage (BBCH) | Plant height (cm) | Fusarium head blight severity (%) |
|---|---|---|---|
| Phenotypic data | |||
| Range | 51.0–59.8 | 76.2–132.1 | 12.6–54.2 |
| Mean | 57.0 | 105.4 | 29.1 |
| Analyses of variance | |||
| Genotype (G) | 4.5*** | 359.9*** | 42.0*** |
| G × Environment | 0.4*** | 4.3*** | 23.1*** |
| Residual | 1.8 | 16.0 | 28.2 |
| H2 | 0.96 | 0.99 | 0.87 |
- *** Significant at p < 0.001.
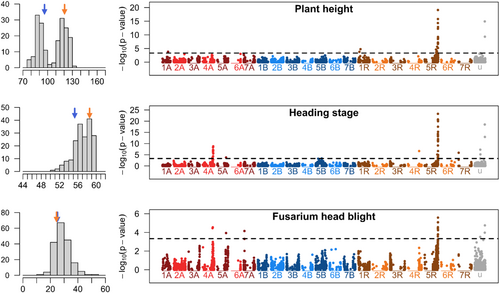
The progeny clearly showed a bimodal distribution for PH (Figure 1), with a shorter subpopulation comparable to the PH of Cando (96.8 cm) and a taller subpopulation comparable to that of Tritikon (121.2 cm). Cando was heading later than Tritikon; mean FHB severity was similar (27.4 vs. 27.6%). A significant marker on chromosome 5RL was detected for all three traits (Figure 1 and Table 2). This locus explains 38%, 62% and 43% of the genotypic variation for PH, heading stage and FHB severity, respectively, and is most likely identical to the dominant dwarfing gene Ddw1. The additive effect for PH in this population is 20.2 cm. In addition, two other loci were detected for each of the traits with smaller effects on PH, heading stage and FHB severity. Heading stage and FHB severity had a cosegregating marker on chromosome 4A, explaining 14% of genotypic variance for each trait (Table 2). The total explained genotypic variance reached 48% for PH, 87% for heading stage and 65% for FHB severity.

| Marker | Chr.a | Pos (bp)b | p value | p value cofac | Effect | SE | N (marker allele) | pG | ||
|---|---|---|---|---|---|---|---|---|---|---|
| 0 | 1 | 2 | ||||||||
| Plant height | ||||||||||
| X10515274.11.A.C | 1A | 368,801,916 | 5.0 × 10⁻³ | 1.5 × 10⁻⁴ | 9.5 | 3.2 | 82 | 18 | 76 | 0.04 |
| X3618946.41.G.T | 1R | 139,463,612 | 1.2 × 10⁻³ | 1.7 × 10⁻⁵ | 9.7 | 2.8 | 80 | 17 | 75 | 0.06 |
| X4564512.41.T.C | 5R | 861,647,881 | 8.6 × 10⁻¹⁶ | 8.6 × 10⁻¹⁶ | 20.2 | 2.5 | 66 | 22 | 88 | 0.38 |
| Total | 0.48 | |||||||||
| Heading stage | ||||||||||
| X4350170.6.C.A | 4A | 683,442,354 | 5.6 × 10⁻⁵ | 1.7 × 10⁻⁹ | 1.7 | 0.4 | 76 | 13 | 86 | 0.14 |
| X10515868.30.T.C | 5B | 398,059,128 | 4.6 × 10⁻³ | 4.3 × 10⁻⁴ | 1.3 | 0.5 | 52 | 9 | 115 | 0.09 |
| X4564512.41.T.C | 5R | 861,647,881 | 1.1 × 10⁻²⁰ | 1.1 × 10⁻²⁰ | 3.0 | 0.3 | 66 | 22 | 88 | 0.62 |
| Total | 0.87 | |||||||||
| Fusarium head blight severity | ||||||||||
| X10524637.30.G.A | 4A | 654,058,778 | 4.8 × 10⁻⁴ | 2.8 × 10⁻⁵ | 4.0 | 1.2 | 66 | 15 | 93 | 0.23 |
| X4350170.6.C.A | 4A | 683,442,354 | 2.0 × 10⁻² | 4.4 × 10⁻³ | 2.8 | 1.2 | 76 | 13 | 86 | 0.14 |
| X4564512.41.T.C | 5R | 861,647,881 | 3.7 × 10⁻⁵ | 3.7 × 10⁻⁵ | −4.7 | 1.1 | 66 | 22 | 88 | 0.43 |
| Total | 0.65 | |||||||||
- a Chr. = chromosome, cofac = p value with significant markers as cofactors, SE = standard error of the effect, N = number of genotypes in the respective class, 0 = Parent 1, 1 = heterozygous, 2 = Parent 2, pG = percentage of explained genotypic variance.
- b Physical locations of according to a BLAST of marker sequences in the reference genomes of rye and wheat.
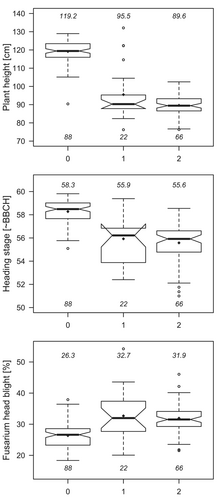
To illustrate the effects of Ddw1, we divided the total population into subpopulations according to the three allelic states of a Ddw1-linked marker (Figure 2). The homozygous short subpopulation (allelic state 2) was 29.6 cm shorter, 2.7 BBCH stages later and 5.6% more susceptible to FHB than the homozygous tall subpopulation (allelic state 0). The dominant effect of Ddw1 on all three traits is clearly evident. Reasons for the heterozygous allele status in DH populations will be discussed later.

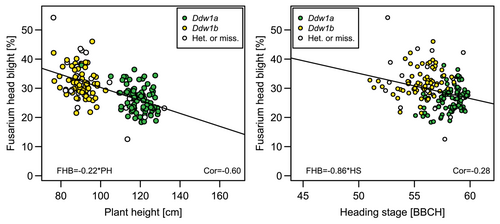
The negative phenotypic correlation between FHB severity and PH was significant (r = −0.60, p < 0.001) due to the two subpopulations with the short and tall alleles of Ddw1 (Figure 3). Although one QTL of FHB severity and heading stage was shared, the correlation between both traits was of lower importance (r = 0.28, p < 0.001).

4 Discussion
The agronomic benefits of semidwarfing genes are clear across all crops. They reduce lodging and thus allow a lower growth regulator use and a higher nitrogen fertilisation. They could become even more important with the increase in high winds and heavy rainfall associated with climate change. In Germany, about 70% of all wheat varieties carry one of the two dwarfing alleles Rht-B1b or Rht-D1b, the latter often in combination with Rht24 (Miedaner, Flamm, and Oberforster 2024). However, they also have side effects including a higher susceptibility to FHB that Rht-B1b, and to a greater extent Rht-D1b, confer on wheat (Buerstmayr and Buerstmayr 2016). This is not only due to shorter growth and thus a different plant architecture but also seems to be related to the gene itself. Ddw1 was also reported to increase FHB susceptibility and to delay heading in triticale (Kalih et al. 2014; Ollier et al. 2020). This gene was introduced into triticale in Poland in the 1980s (Banaszak 2010) and is also present in some German triticale varieties. To quantify the effects of Ddw1 on PH, heading stage and FHB severity, genetic mapping with DArTseq markers was carried out in this study.
DArTseq markers are relatively cheap and cover both, rye and triticale genomes, but it appears that some markers detected heterozygous loci where we did not expect them because DH lines should be fully homozygous. This can be due to a threshold-based SNP calling of the marker technology, but there is also chance of cross pollination in triticale during several seed multiplications. Based on markers, actually 51 genotypes in our population had a heterozygosity larger than 10%. This heterozygosity was not a problem as both marker and phenotypic analysis were done with the same material, but it generally should be taken into account in a breeding programme. Additionally, the homoeology of chromosomal sets (A genome, B genome and R genome) is a challenge for marker and sequencing technology. Thus, we applied a rather strict marker filtering to avoid any artefacts. Unfortunately, this filtering also reduced the number of final markers, and there might be some markers filtered out that were actually more close to respective gene sequences. On the Lo7 reference sequence (Rabanus-Wallace et al. 2021), the sequence of our closest linked marker X4564512.41.T.C on chromosome 5R was only 0.66 Mbp apart from MACE3, a Ddw1 linked marker reported by Braun et al. (2019). The physical interval of markers with p values above the adjusted global threshold was between 859,405,210 (X3610345.15.G.C) and 868,161,464 bp (X4551280.8.T.C) on chromosome 5R (data not shown).
Although Cando and Tritikon had the same mean values for FHB severity, their progeny significantly varied for this trait due to transgressive segregation. This indicates that both parents have at least some partially different QTL, a feature well known in FHB resistance of triticale (Kalih et al. 2014) and wheat (Miedaner, Schneider, and Geiger 2003; Zhang et al. 2018). Interestingly, this result also shows that Cando has a good FHB resistance as it has the same FHB severity as Tritikon despite the presence of the FHB increasing dwarfing allele.
The high estimates for the genetic variance and heritability are slightly overestimated, because it is mainly based on a single gene that affected all traits and thus genotype means are only approximately normally distributed. For all traits, the ratios between variance estimates and the heritability estimate were comparable with the estimates from Kalih et al. (2014), except for FHB, where this study reached a higher heritability.
The correlation between PH and FHB severity was significant and moderately narrow (r = −0.60). The correlation between heading date and FHB severity was negative illustrating the large effect of Ddw1. Usually, later genotypes tend to be more resistant to FHB; however, plants with Ddw1 were later heading and, caused by the dwarfing allele, more susceptible to FHB resulting in a negative correlation.
Phenotypic data clearly showed a bimodal distribution for PH showing again the large effect of this gene in triticale. This was consistent with the high explained genetic variance of 38% by this single locus on chromosome 5RL. The effects on FHB severity and heading stage were even higher with 43% and 62%, respectively, of explained genetic variance. This confirms the results of a previous study with a genetically nonrelated triticale population (Kalih et al. 2014). Also in the present study, plants carrying Ddw1 increased FHB susceptibility by 5.6 percentage points and delayed heading by 2.7 EC stages while reducing PH by 29. cm. Similar results were reported from another triticale population (AG) segregating for Ddw1, where the dwarfing gene accounted for 78% and 25% of the phenotypic variation for PH and flowering date (Ollier et al. 2020). The same locus explained in their study 27.6% of phenotypic variation for FHB severity measured as area under disease progress curve (AUDPC). Thus, it has been confirmed now in three independent biparental triticale populations that Ddw1 had a significant negative impact on Fusarium resistance. This should result in a higher DON content after infection. Indeed, in multiyear state variety trials in Thuringia, Germany, the Ddw1-bearing parent Cando had about twice the DON content of Tritikon (Schreiber and Guddat 2011) after inoculation by the maize-stubble method. In wheat, it was shown that the negative impact of the Rht-D1 dwarfing allele on FHB resistance is partly caused by a higher anther retention (Buerstmayr and Buerstmayr 2016; Akohoue et al. 2022). This should be analysed in triticale in future.
Interestingly, the other QTLs for FHB resistance and those detected earlier (Kalih et al. 2014) showed no overlap illustrating also in triticale a large QTL diversity for this trait as already known from wheat (Venske et al. 2019; Buerstmayr, Steiner, and Buerstmayr 2020).
The Fusarium-increasing property of Ddw1 means that triticale breeders that want to use this gene either have to select the few more FHB-resistant Ddw1-bearing progenies, which account for about 3% of the short subpopulation (3 out of 91, Figure 2), and/or to enrich the genomic background with FHB-resistance QTL. The latter can easily be done by the backcrossing of Ddw1 to resistant parents. The introgression of the wheat major FHB resistance QTL Fhb1 into triticale was not able to fully counterbalance the negative effect of Ddw1 on FHB severity (Ollier et al. 2020, rf. to their Figure 3) as the short subpopulation with Fhb1 was still significantly more susceptible than the tall subpopulation with Fhb1. However, the tall type without Fhb1 and the short type with Fhb1 were not statistically significant anymore although the latter was still more diseased. Because other FHB resistance mediating QTL have only small to moderate effects, as shown in this study (Table 2) and others (Kalih et al. 2014; Dhariwal et al. 2018; Galiano-Carneiro et al. 2019; Ollier et al. 2020), and therefore need to be pyramided, genomic selection should be a better option than the introduction of individual QTLs by marker-assisted backcrossing. In a recent study in wheat, it could be shown that more FHB-resistant cultivars with the dwarfing allele Rht-D1b could be selected by genomic estimated breeding values (Akohoue et al. 2022). For this, of course, a more diverse triticale population than tested here would be necessary, but this is available in commercial breeding nurseries.
Author Contributions
Thomas Miedaner: conceptualization, writing – original draft, funding acquisition, project administration, supervision. Paul Gruner: writing – review and editing, formal analysis. Hans Peter Maurer: supervision, data curation, investigation.
Acknowledgements
Thanks to the excellent work of the technical staff at the locations Oberer Lindenhof (University of Hohenheim) and Bohlingen (HegeSaat GmbH & Co KG) and especially to Thomas Grafe (University of Hohenheim) who provided technical support for the trials at Hohenheim and carried out the phenotyping at all locations. This project was supported by funds of the Federal Ministry of Food and Agriculture (BMEL) based on a decision of the Parliament of the Federal Republic of Germany partly via the Federal Office for Agriculture and Food (BLE) under the innovation support programme GetreideProtekt (Grant 281B202116) and partly via the Fachagentur für Nachwachsende Rohstoffe e.V. (FNR) within the project SENSELGO (Grant FKZ 22024515). Open Access funding enabled and organized by Projekt DEAL.
Conflicts of Interest
Thomas Miedaner is member of the editorial board of this journal. All other authors have no conflict of interest to declare.
Open Research
Data Availability Statement
All relevant data are part of this paper.


