Phytochrome B-mediated light signalling enhances rice resistance to saline-alkaline and sheath blight by regulating multiple downstream transcription factors
Summary
Light signalling regulates plant growth and stress resistance, whereas its mechanism in controlling saline-alkaline tolerance (SAT) remains largely unknown. This study identified that light signalling, primarily mediated by Phytochrome B (PhyB), inhibited ammonium transporter 1 (AMT1) to negatively regulate SAT. Our previous findings have shown that PhyB can impede the transcription factors indeterminate domain 10 (IDD10) and brassinazole resistant 1 (BZR1) to reduce NH4+ uptake, thereby modulating SAT and sheath blight (ShB) resistance in rice. However, inhibition of IDD10 and BZR1 in the phyB background did not fully suppress NH4+ uptake, suggesting that other signalling pathways regulated AMT1 downstream of PhyB. Further analysis revealed that PhyB interacted with Calcineurin B-like protein-interacting protein kinase 31 (CIPK31), which positively regulated AMT1 expression. CIPK31 also interacted with Teosinte Branched1/Cycloidea/PCF19 (TCP19), a key regulator of nitrogen use efficiency (NUE). However, PhyB neither degraded CIPK31 nor directly interacted with TCP19. Instead, PhyB inhibited the CIPK31-TCP19 interaction, releasing TCP19, which repressed AMT1;2 directly and AMT1;1 and AMT1;3 indirectly, thereby inhibiting NH4+ uptake and SAT while reducing ShB resistance. Additionally, Phytochrome Interacting Factor-Like 15 (PIL15) interacted with TCP19. Different from TCP19, PIL15 directly activated AMT1;2 to promote SAT, suggesting a balancing mechanism for NH4+ uptake downstream of PhyB. Furthermore, PIL15 interacted with IDD10 and BZR1 to form a transcriptional complex that collaboratively activated AMT1;2 expression. Overall, this study provides novel insights into how PhyB signalling regulates NH4+ uptake and coordinates SAT and ShB resistance in rice.
Introduction
Light signalling is fundamental for regulating various biological processes, including plant development and stress responses, and red/far-red light signals are perceived by the phytochrome (Phy) family of photoreceptors (Quail et al., 1995). Among them, PhyB serves as a major receptor (Sambade et al., 2012), converting from its Pr to Pfr form upon light perception and translocation from the cytosol to the nucleus to initiate downstream signalling events (Fankhauser and Chen, 2008; Zhao et al., 2023). The Phys signalling pathway exerts complex effects on plant responses to diverse stresses, positively regulating resistance to pathogens and insects in Arabidopsis thaliana (Campos et al., 2016; Huang et al., 2023). Additionally, PhyB also influences hormonal regulation, including jasmonic acid, salicylic acid, and ethylene, which are crucial for plant defence mechanisms (Cortés et al., 2016; Li et al., 2015). PhyB interacts with transcription factors such as Phytochrome-Interacting Factors (PIFs) and Ethylene Insensitive 3 (EIN3) to trigger their degradation (Heng et al., 2019), and PIFs play a significant role in biotic and abiotic stress responses (Bae and Choi, 2008; Lee and Choi, 2017; Li et al., 2011). Rising temperatures can independently convert PhyB into its Pr form, confirming its function as both a photoreceptor and a thermosensor (Casal and Qüesta, 2018; Jung et al., 2016). PhyB also plays a role in low-temperature stress adaptation in Arabidopsis (Lee and Thomashow, 2012), and phyB mutations improve drought tolerance in rice by reducing the leaf area and stomatal density (Liu et al., 2012). In Nicotiana tobacum, PhyA and PhyB negatively regulate salt resistance (Yang et al., 2018). A recent study revealed that PhyB mutations regulate plant immunity and SAT resistance through IDD10- and BZR1-mediated ammonium (NH4+) uptake (Jung et al., 2023). However, the mechanisms by which light signalling regulates SAT remain unclear.
Light signals can affect calcium ion concentrations (Shacklock et al., 1992), indicating a complex interplay between the light and calcium signalling pathways in plant cells. Recent studies have reported that Ca2+-binding protein kinases (CPK6/12) interact with PhyB, phosphorylate it, and facilitate its nuclear translocation (Zhao et al., 2023). Additionally, PhyB interacts with SALT OVERLY SENSITIVE2 (SOS2), also known as Calcineurin B-like protein (CBL)-interacting protein kinase 24 (CIPK24), enhancing its kinase activity to improve stress adaptation (Han et al., 2023; Ma et al., 2023). However, the specific mechanisms underlying the interaction between phytochromes and calcium signals in plants remain unclear and require further investigation.
Transcriptomic and phosphoproteomic studies have indicated that the transcription and phosphorylation of CIPKs are upregulated during NH4+ response (Engelsberger and Schulze, 2012; Patterson et al., 2010), indicating a potential link between CIPK and nutrient signalling in plants. NH4+ is a major source of nitrogen for plants and can be transported radially through root tissues (Duan et al., 2018), and its uptake is regulated at the transcriptional, posttranscriptional, and posttranslational levels (Ganz et al., 2022). Ammonium transporters (AMTs) play crucial roles in NH4+ uptake and transport, and C-terminal phosphorylation allosterically inactivates AMT1 to reduce NH4+ uptake and mitigate toxicity. CIPK23 has been demonstrated to phosphorylate AMT1 and inhibit NH4+ transport in Arabidopsis (Straub et al., 2017), whereas CIPK15 inhibits NH4+ accumulation through AMT1 phosphorylation (Chen et al., 2020). CIPK9 has been implicated in NH4+-dependent root growth by acting downstream of IDD10 (Xuan et al., 2019). However, the relationship between CIPKs and AMTs in rice may differ from that in Arabidopsis, necessitating further research to explore the role of CIPK in NH4+ uptake in rice.
Rice (Oryza sativa) is inherently sensitive to saline-alkaline stress, particularly at the seedling and reproductive stages, and is also vulnerable to sheath blight (ShB), a major disease caused by Rhizoctonia solani. In this study, we presented new insights into how PhyB signalling could regulate NH4+ uptake and orchestrate both SAT and ShB resistance in rice. We discovered that PhyB negatively regulated NH4+ uptake by inhibiting the interaction between CIPK31 and TCP19, releasing TCP19 to bind directly to the AMT1;2 promoter and repress AMT1;2-mediated NH4+ uptake. Moreover, PIL15, another PhyB-interacting protein, engaged with TCP19 and activated AMT1;2-mediated NH4+ uptake, suggesting a balancing mechanism of AMT1;2 regulation downstream of PhyB-mediated light signalling. Enhanced NH4+ uptake improved rice SAT. PIL15 also interacted with IDD10 and BZR1 to form a transcriptional complex that collaboratively activated the AMT1;2 expression. Thus, our findings demonstrated that the PhyB signalling network regulated NH4+ uptake, orchestrating rice SAT and ShB resistance.
Results
PhyB is a key component in light signalling for SAT
Light signalling is closely linked to plant growth and stress tolerance. To investigate the effects of light on SAT in rice, we compared the salt damage rates in rice roots under full light (with shoots and roots fully exposed to continuous light) and full dark conditions using a seedling growth assay in 0.5 × MS medium containing 100 mm NaCl or 80 mm NaHCO3. The results indicated that rice grown under full light had lower salt damage rates than those grown in the full dark (Figure 1a,b), except for the saline-alkaline treatment, where the opposite trend was observed, with lower inhibition rates in the full dark (Figure 1b). As the key regulators of plant growth under various light conditions, phytochromes were examined for their role in regulating rice SAT. Following saline and alkaline treatments, the salt damage rate of phyB mutants was significantly lower than that of wild-type Dongjin (DJ) (Figure 1c–e), whereas no significant differences were observed for phyA and phyC mutants (Figure 1c–e). Previous studies have suggested that NH4+ is a crucial factor for light-regulated root growth (Hirano et al., 2008). To further explore this, we treated rice with methylammonium (MeA), a toxic ammonium analog, under different light conditions (Figure 1f). Root growth was significantly reduced under full light, with or without MeA, compared to the full dark conditions, where MeA treatment significantly inhibited root growth (Figure 1f,g). However, MeA showed no inhibitory effect under full light conditions (Figure 1f,g). These findings suggest that different light conditions affect NH4+ uptake in rice roots, with higher uptake occurring in the full dark, indicating that light signalling could play distinct roles in salt and saline-alkaline tolerance mechanisms in rice.
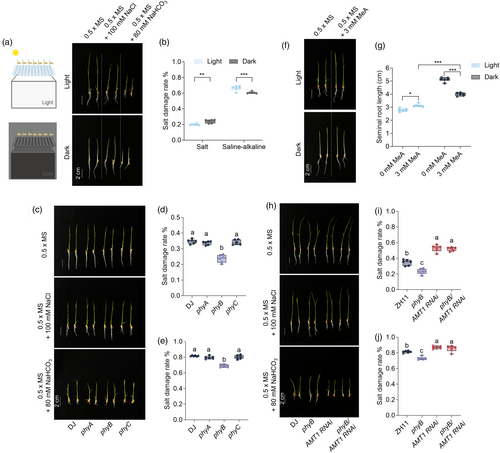
To further confirm the role of PhyB in regulating rice SAT, we evaluated the salt damage rates under stress conditions using DJ, phyB, AMT1 RNA interference (RNAi), and phyB/AMT1 RNAi. The results demonstrated that the SAT of phyB was completely inhibited by AMT1 RNAi (Figure 1h), as indicated by the similar salt damage rates in phyB/AMT1 RNAi and AMT1 RNAi, both of which were significantly higher than that of phyB and DJ (Figure 1i,j). These findings suggest that PhyB is a key regulator of rice SAT mediated by phytochrome-regulated light signalling.
PhyB interacts with CIPK31
Recent findings have revealed that PhyB inhibits NH4+ uptake by inhibiting the transcription factors IDD10 and BZR1, which directly activate AMT1;2 in rice (Jung et al., 2023). Data have shown that phyB/idd10 mutants accumulate more NH4+ than the idd10 mutants alone (Jung et al., 2023). Additionally, it has been previously demonstrated that brassinosteroid (BR) signalling promotes NH4+ uptake via BZR1 in rice (Xuan et al., 2017), with BZR1 being a key transcription factor in BR signalling (Wang et al., 2002). To explore this further, phyB/idd10 and idd10 mutants were treated with the BR biosynthesis inhibitor propiconazole (PCZ) (Hartwig et al., 2012), and NH4+ levels were measured. These results indicate that phyB/idd10 mutants accumulate more NH4+ than idd10 mutants after PCZ treatment (Figure 2a), suggesting that PhyB may regulate NH4+ uptake through additional pathways beyond the IDD10-BZR1 pathway.
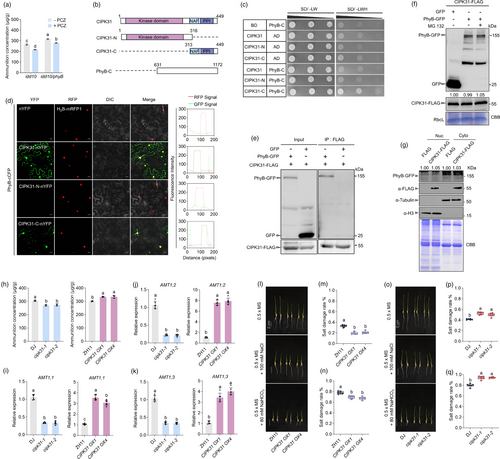
To investigate the molecular mechanism of PhyB-mediated NH4+ uptake, PhyB-interacting proteins were isolated using a yeast two-hybrid (Y2H) assay. Among the identified interactors, the C-terminus of CIPK31, an NH4+-induced gene (Xuan et al., 2019), was identified to interact with PhyB-C (Figure 2b,c). The BiFC assay confirmed that CIPK31 interacted with PhyB in both the cytosol and the nucleus (Figure 2d). Additionally, a co-immunoprecipitation (co-IP) assay in tobacco leaves, where PhyB-GFP/CIPK31-FLAG or GFP/CIPK31-FLAG were co-expressed, revealed that PhyB-GFP, but not GFP alone, interacted with CIPK31-FLAG (Figure 2e), confirming the in vivo interaction. Upon photoactivation, PhyB converts from its Pr to Pfr form, where it interacts with transcription factors to inhibit their activity, either by degrading them or inhibiting their DNA binding (Dong et al., 2020; Leivar and Monte, 2014; Yasui et al., 2012). Co-expression of PhyB-GFP/CIPK31-FLAG or GFP/CIPK31-FLAG in tobacco leaves, followed by the western blot analysis, showed that CIPK31-FLAG levels remained similar with or without PhyB-GFP coexpression (Figure 2f), indicating that the interaction between PhyB and CIPK31 does not result in CIPK31 degradation. Additionally, CPK6 and CPK12 interact with and phosphorylate PhyB to regulate its nuclear translocation in Arabidopsis (Zhao et al., 2023). CIPK31-C, rather than its N-terminal kinase domain (CIPK31-N), interacted with PhyB (Figure 2b–d). To assess the impact of this interaction on PhyB localisation, we co-expressed CIPK31-FLAG/PhyB-GFP and FLAG/PhyB-GFP in tobacco leaves and analysed PhyB accumulation in the cytoplasm and nucleus. Western blot results demonstrated that co-expression of CIPK31-FLAG did not alter cytosolic or nuclear PhyB-GFP levels (Figure 2g). These findings suggest that although PhyB interacts with CIPK31, this interaction does not affect PhyB localisation or CIPK31 degradation.
CIPK31 promotes NH4+ uptake by activation of AMT1 expression
CIPK31 expression is sensitive to NH4+ supply (Xuan et al., 2019). Therefore, NH4+ content was measured in Dongjin (DJ), cipk31 mutants, Zhonghua11 (ZH11), and CIPK31 OX plant roots. The results indicated that cipk31 mutants accumulated less NH4+, whereas CIPK31 OXs accumulated more NH4+ than their respective wild-types (Figure 2h). Subsequently, AMT1 expression levels were examined in CIPK31 plant roots. The RT-qPCR results revealed that the expressions of AMT1 genes (AMT1;1, AMT1;2, and AMT1;3) were significantly lower in cipk31 than in DJ plants, whereas their expressions in CIPK31 OXs were higher than that in ZH11 plants (Figure 2j–k). Previous studies have indicated that CIPK23 inhibits AMT1 by phosphorylating its C-terminal, reducing its NH4+ transport function (Straub et al., 2017). However, CIPK31 did not interact with AMT1 in tobacco leaves (Figure S1), suggesting that CIPK31 promotes NH4+ uptake via a mechanism different from that of CIPK23.
A previous study found that cipk31 mutants exhibited hypersensitivity to abiotic stress during the early seedling stage (Piao et al., 2010). Given the higher NH4+ content in CIPK31 OX plants (Figure 2h) and the known link between NH4+ uptake and SAT (Jung et al., 2023), the role of CIPK31 in rice SAT was examined using a seedling growth assay in 0.5 × MS medium containing 100 mm NaCl or 80 mm NaHCO3. After the saline and alkaline treatments, the results revealed that the CIPK31 OX plants exhibited higher SAT (Figure 2l–n), consistent with the trend in AMT1;2 expression in CIPK31 plants (Figure 2j–k), while the cipk31 mutants were more sensitive to the salt-alkaline treatment (Figure 2o–q). Collectively, these findings indicated that CIPK31 promoted NH4+ uptake and SAT by activating AMT1 expression.
PhyB disrupts the interaction between CIPK31 and TCP19 to repress AMT1;2
CIPK31 is a protein kinase, raising the question of how it regulates NH4+-dependent AMT1 expression. Interestingly, TCP19, a key regulator of NUE in rice (Liu et al., 2021), was identified to interact with CIPK31 (Figure 3a). A BiFC assay confirmed that CIPK31 and TCP19 interacted in the nucleus (Figure 3b), and a co-IP assay further validated the interaction between TCP19-MYC and CIPK31-GFP but not GFP alone (Figure 3c), indicating that CIPK31 interacted with TCP19 in vivo. As shown in Figure 2b, CIPK31 contained a kinase domain at the N-terminus and a regulatory domain at the C-terminus. Further analysis revealed that the CIPK31-C terminal, rather than the N-terminus, of CIPK31 interacted with TCP19 (Figure 3d). To test whether phosphorylation affected the interaction between CIPK31 and TCP19, we co-expressed both proteins in tobacco leaves and used a pSer/Thr antibody to detect immunoprecipitated TCP19. However, the western blot analysis did not detect phosphorylated TCP19 (Figure 3e).
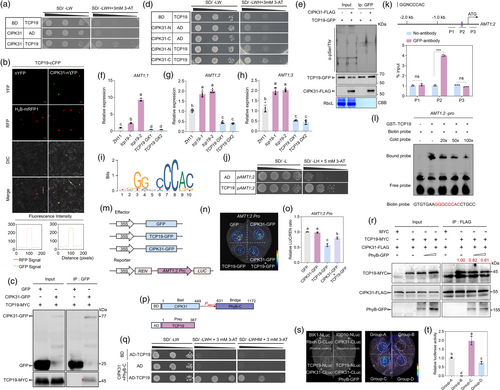
As TCP19 is a key transcription factor in NUE (Liu et al., 2021), its regulation of AMT1 gene expression was examined. Using the CRISPR/Cas9 system, two in-dependent homozygous TCP19 knockout lines, tcp19-1 and tcp19-2, with 1-bp insertions in the exon, were generated (Figure S2a). Additionally, TCP19-GFP overexpressors (TCP19 OXs) were produced. RT-qPCR results confirmed significantly higher TCP19 expression in TCP19 OXs than in wild-type ZH11 (Figure S2b). Transcriptomic analysis revealed that most AMTs were downregulated in TCP19 OXs (Liu et al., 2021) (Figure S2c). RT-qPCR further validated these findings, showing higher AMT1 expression in tcp19 mutants and lower expression in TCP19 OXs than in ZH11 (Figure 3f–h). To determine whether TCP19 directly regulates AMT1 gene expression, promoter sequences of AMT1 were analysed, and the JASPAR 2024 database (Rauluseviciute et al., 2024) predicted the cis-element GGNCCCAC as the TCP19-binding motif (Figure 3i). Promoter sequence analysis identified the putative TCP19-binding site GGGCCCAC in the AMT1;1 and AMT1;2 promoter regions (Figures S2d and 3k), but not in the AMT1;3 promoter. The yeast-one hybrid (Y1H) assay confirmed that TCP19 directly activated the AMT1;2 promoter but did not bind to the AMT1;1 or AMT1;3 promoter (Figures 3j and S2e, f). To examine the in vivo binding of TCP19 to the GGNCCCAC motif, a chromatin immunoprecipitation assay was conducted, which showed significant enrichment of AMT1;2 promoter fragments (P2) containing the motif, while fragments P1 and P3 did not show enrichment (Figure 3k). This interaction was further validated by electrophoretic mobility shift assay (EMSA). A specific shift band was generated when TCP19 protein was added, while this shift band was competed by unlabeled P2 probe (Figure 3l). To verify the regulation of AMT1;2 by TCP19, a transient transactivation assay was performed on tobacco leaves using a dual-luciferase reporter (DLR) system. The relative LUC/REN ratio was lower in leaves co-expressing TCP19-GFP with AMT1;2pro:LUC, confirming that TCP19-GFP, but not GFP, directly represses AMT1;2 (Figure 3m–o). These results suggested that TCP19 directly repressed AMT1;2 expression via promoter binding. The C-terminal regulatory domain of CIPK31, rather than its kinase domain, interacts with TCP19 (Figure 3d), prompting an analysis of CIPK31's role in the TCP19-mediated repression of AMT1;2. Transient assay results demonstrated that CIPK31 did not activate or repress the AMT1;2 promoter on its own. However, the co-expression of CIPK31 inhibited the TCP19-mediated repression of AMT1;2 (Figure 3m–o), suggesting that CIPK31 may inhibit TCP19 repression to AMT1;2. promoter.
Since PhyB interacted with CIPK31 and CIPK31 interacted with TCP19, the potential interaction between PhyB and TCP19 was tested. The Y2H results demonstrated that PhyB did not interact with TCP19 (Figure S2), suggesting that PhyB may inhibit CIPK31-TCP19 interaction through competitive binding with CIPK31. To test this hypothesis, a yeast three-hybrid (Y3H) assay was conducted using constructs expressing CIPK31 (bait), TCP19 (prey), and PhyB-C (bridge protein) (Figure 3p). The Y3H results showed that PhyB-C coexpression inhibited the yeast growth, indicating that PhyB-C inhibited CIPK31-TCP19 interaction in yeast cells (Figure 3q). Additionally, a competition immunoprecipitation assay was used to further test the effect of PhyB on CIPK31-TCP19 interaction. We transiently infiltrated the tobacco leaves with equal proportions of TCP19-MYC, CIPK31-FLAG, and PhyB-GFP. As increasing amounts of PhyB-GFP were added, the interaction affinity between CIPK31-FLAG and TCP19-MYC decreased (Figure 3r). Immunoblotting analysis confirmed that PhyB-GFP inhibited the interaction between CIPK31-FLAG and TCP19-MYC (Figure 3r). Similar results were observed in the luciferase complementation imaging (LCI) assay (Figure 3s,t), where the interaction affinity between CIPK31-CLuc and TCP19-NLuc was weakened by coexpression of PhyB-GFP. These findings suggest that PhyB inhibits the CIPK31-TCP19 interaction, thereby affecting the formation of the CIPK31-TCP19 complex.
TCP19 negatively regulates rice SAT by repression of AMT1
Our previous study demonstrated that NH4+ accumulation, rather than NH4+ metabolites, enhanced rice SAT (Jung et al., 2023). In rice, inhibition of AMT1 expression reduced NH4+ uptake in the roots, and because TCP19 repressed AMT1;2 expression, the role of TCP19 in SAT was investigated. The seedling growth assay revealed that the tcp19 mutants were tolerant, whereas the TCP19 OX plants were sensitive to salt and saline-alkaline stress (Figure 4a). The salt damage rates were significantly lower in tcp19 plants than in wild-type ZH11, whereas TCP19 OX plants demonstrated higher damage rates (Figure 4b,c). Analysis of the natural variation in TCP19 revealed two major haplotypes (Haps), distinguished by a few single-nucleotide polymorphisms (SNPs) and deletions in the promoter and exon regions (Figure S4a). RT-qPCR analysis indicated that TCP19 expression was higher in the cultivars belonging to Hap_H (marked by the red line) than in Hap_L (Figure S4b,c). Salt stress responses in these haplotype plants indicated that cultivars with lower TCP19 expression exhibited better tolerance to salt stress (Figure S4b,c). These findings indicate that TCP19 negatively regulates salt tolerance in rice. Because AMT1 RNAi plants accumulate less NH4+ and are more sensitive to saline-alkaline stress (Jung et al., 2023), tcp19-1 was crossed with AMT1 RNAi to produce double transgenic plants (tcp19-1/AMT1 RNAi). After saline and alkaline treatments, the salt damage rate of tcp19-1/AMT1 RNAi plants was higher than that of tcp19-1 (Figure 4d–f) and exhibited a similar damage rate to AMT1 RNAi (Figure 4d–f). This confirmed that AMT1 RNAi could reduce the saline-alkaline tolerance of tcp19 plants.
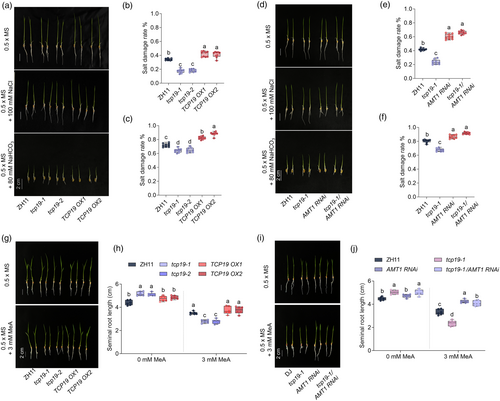
To determine whether the differences in SAT were due to reduced ammonium transporter activity and NH4+ uptake in roots, we conducted sensitivity tests for MeA in TCP19 plants. In the absence of MeA, the root lengths of ZH11 and TCP19 OXs were similar but significantly shorter than those of the tcp19 mutants (Figure 4d–f). However, in the presence of MeA, tcp19 mutant roots were more sensitive to MeA, presenting a greater reduction in root length than ZH11 and TCP19 OXs (Figure 4g,h). Additionally, the tcp19-1/AMT1 RNAi plants exhibited a similar SAT to that of AMT1 RNAi (Figure 4d–f), and their MeA sensitivity results were consistent, showing similar hyposensitivity as tcp19-1 (Figure 4i,j). These findings suggest that AMT1 RNAi attenuates NH4+ uptake in tcp19 plants. Collectively, these results indicated that TCP19 negatively regulated rice SAT and NH4+ uptake by repressing AMT1 expression.
PIL15 interacts with TCP19 and positively regulates rice SAT
Interestingly, PIL15, an Arabidopsis PIF homologue and a PhyB-interacting protein, also interacted with TCP19 (Figure 5a), as confirmed by BiFC and Co-IP assays (Figure 5b,c). To investigate whether PIL15 is involved in the regulation of AMT1;2 expression, PIL15 knockout lines and PIL15-GFP overexpressors (PIL15 OXs) were generated (Figure S5a,b). RT-qPCR results demonstrated that AMT1;2 expression levels were higher in PIL15 OXs and lower in pil15 mutants than in ZH11 (Figure S5c). As TCP19 directly repressed AMT1;2, we examined whether PIL15 could bind to AMT1;2. A previous study identified the PIL15 binding site (PBE-box) as CACATG (Figure 5e) (Li et al., 2022), and four PBE-boxes were observed in the AMT1;2 promoter region (Figure 5f). A subsequent Y1H assay confirmed that PIL15 interacted with the AMT1;2 promoter (Figure 5d). A ChIP assay further demonstrated that PIL15 binds to the AMT1;2 promoter in vivo, with significant enrichment of promoter fragments (P2) containing the CACATG motif, whereas P1 and P3 did not demonstrate enrichment (Figure 5f). Further experiment confirmed that PIL15 directly bound to the PBE-box element of AMT1;2 by EMSA (Figure 5g). As both PIL15 and TCP19 could bind to the AMT1;2 promoter, we analysed the role of the PIL15-TCP19 module in regulating AMT1;2 expression. A transient transactivation assay in tobacco leaves using the DLR system revealed that the co-expression of PIL15-GFP with AMT1;2pro:LUC led to a higher LUC/REN ratio, confirming that PIL15-GFP directly activated AMT1;2 (Figure 5h–j). Interestingly, when PIL15 was co-expressed, it significantly inhibited TCP19-mediated repression of AMT1;2 and even activated its expression (Figure 5h–j).
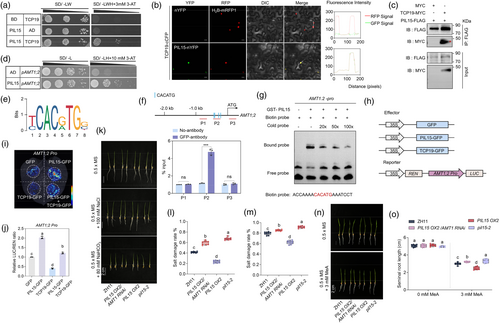
Since PIL15 directly activated AMT1;2 expression, we investigated the response of PIL15 plants to SAT. PIL15 OX2 plants exhibited higher SAT (Figure 5k), whereas the pil15-2 mutants were more sensitive to salt-alkaline treatment (Figure 5k–m). Additionally, crossing PIL15 OX2 with AMT1 RNAi plants showed that after saline and alkaline treatments, the salt damage rate of PIL15 OX2/AMT1 RNAi plants was higher than that of PIL15 OX2 alone (Figure 5k–m). Sensitivity tests to MeA revealed that the PIL15 OX2 roots were more susceptible to MeA, with a greater reduction in root length compared to PIL15 OX2/AMT1 RNAi and pil15-2 plants (Figure 5n,o). These biochemical and genetic findings indicate that AMT1;2 is a direct target of PIL15 and that PIL15 positively regulates rice SAT and NH4+ uptake by activating AMT1.
PIL15 interacts with IDD10 and BZR1 co-activate AMT1;2
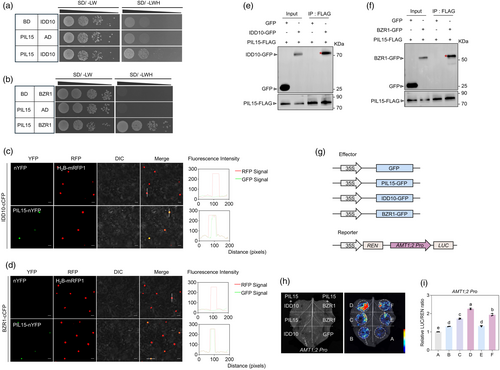
We previously identified that PhyB inhibits IDD10 and BZR1, which directly activates AMT1;2 in rice (Jung et al., 2023). Given that PIL15 also activated AMT1;2, we investigated whether it interacted with IDD10 and BZR1. In Arabidopsis, BZR1 interacts with PIF to regulate light signalling and hypocotyl elongation (Oh et al., 2012). To explore this, we conducted a Y2H assay, which revealed that PIL15 interacted with both IDD10 and BZR1 (Figure 6a,b). These interactions were further confirmed in vivo using the BiFC and Co-IP assays (Figure 6c–f). A transient transactivation assay was conducted to assess the roles of PIL15, IDD10, and BZR1 in activating AMT1;2. The results indicated that PIL15, IDD10, and BZR1 individually activated AMT1;2, and the co-expression of PIL15 with either IDD10 or BZR1 resulted in an additive effect on AMT1;2 activation (Figure 6g–i). These findings suggest that PIL15 forms a transcriptional complex with IDD10 and BZR1 to collaboratively activate AMT1;2 expression and regulate NH4+ uptake.
PhyB downstream TFs differ in ShB resistance
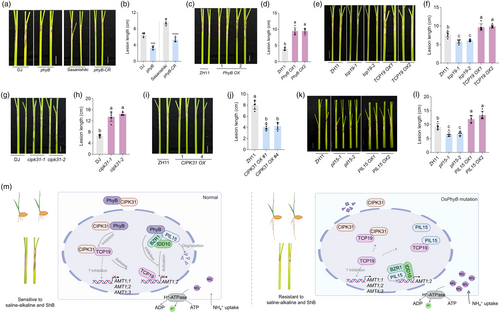
Given that NH4+ uptake enhances resistance to ShB (Wu et al., 2022), which is one of the three major rice diseases, the role of PhyB and its interacting proteins in ShB resistance was investigated. Consistent with the trend in NH4+ uptake, the phyB mutants showed increased resistance to ShB, whereas PhyB OXs were more susceptible (Figure 7a–d). Similar results were observed for CIPK31 and TCP19 plants. TCP19, which could inhibit NH4+ uptake, negatively regulated ShB resistance (Figure 7e,f), whereas CIPK31, by inhibiting the TCP19-mediated AMT1;2 repression, positively regulated the ShB resistance (Figure 7g–j). Interestingly, in contrast to PIL15 OXs enhancing SAT (Figure 5k–m), pil15 mutants were less susceptible to ShB, whereas PIL15 OXs were more susceptible than wild-type ZH11, consistent with previous findings (Yuan et al., 2023) (Figure 7k,l). These results suggest distinct mechanisms in rice responses to SAT and ShB resistance involving PhyB-interacting transcription factors.
Discussion
Previous studies have identified PhyB as a key regulator of plant responses to light, particularly in mediating stress responses (Liu et al., 2023; Yuan et al., 2023). However, the mechanisms linking light, nutrient uptake, and stress signalling pathways remain poorly understood. Recent studies have indicated that photoactivated PhyA and PhyB can physically interact with SOS2, enhancing its kinase activity to improve salt tolerance (Han et al., 2023; Ma et al., 2023), suggesting a strong connection between light signalling and plant salt tolerance. These findings have expanded our understanding of the role of PhyB beyond that of photomorphogenesis, highlighting its involvement in complex signalling networks that modulate plant physiology under various environmental conditions. Recent studies have also discovered a new mechanism by which the blue light receptor Cryptochrome 2 (CRY2) regulates root elongation in Arabidopsis under dark conditions. This mechanism does not rely on the known CRY-CIBs pathway and directly affects root development (Zeng et al., 2024), especially under low-light conditions, where the role of CRY is particularly pronounced.
Light has also been shown to inhibit root growth, with rice roots growing better in full darkness (Figure 1a), which is consistent with previous reports (Shimizu et al., 2009). Additionally, phytochrome-mediated light signalling regulates NH4+-dependent root growth (Shimizu et al., 2009). NH4+ uptake enhanced the rice SAT, with a stronger suppression effect of MeA under dark conditions (Figure 1f,g), indicating greater NH4+ accumulation in the dark. In Arabidopsis, light has been shown to significantly increase NH4+ influx into roots, primarily through the upregulation of AtAMT1;3 (Gazzarrini et al., 1999). However, our MeA sensitivity tests produced contrasting results. In rice, OsAMT1;3 is nitrogen-depressible, whereas OsAMT1;2 expressed in the central cylinder and root tips likely plays a major role in NH4+ uptake (Sonoda et al., 2003), partially explaining the differing effects of light on NH4+ uptake in monocots and dicots. Rice seedlings exposed to full light exhibited higher salt tolerance but reduced alkaline tolerance (Figure 1a,b), suggesting that plant stress responses vary under different light conditions, as different light qualities significantly affect root growth (Shimizu et al., 2009). Our study demonstrated that PhyB may be a key regulator of rice salt tolerance and NH4+ uptake through phytochrome-mediated light signalling (Figure 1c–e).
Light and calcium signalling plays a crucial role in responding to external stimuli and coordinating plant growth and development. As a key regulator of plant signalling networks, CIPK is particularly important in abiotic stress responses and nutrient uptake (Chen et al., 2024). In this study, CIPK31, an interacting protein of PhyB, was identified as a positive regulator of NH4+ uptake, SAT, and resistance to ShB (Figures 2 and 7g–j). CIPKs interact with and modulate key transporters such as NRT1.1, AKT1, and AMT1 (Li et al., 2014; Mao et al., 2023; Tang et al., 2020), whereas CIPK31 does not directly interact with AMT1 (Figure S1). It regulated AMT1;2 expression through its interaction with TCP19 (Figure 3a–c), thereby influencing NH4+ uptake. Our study demonstrated that TCP19 directly repressed AMT1;2 (Figure 3k–o), aligning with its role as a key regulator of NUE, likely optimising NH4+ uptake under varying environmental conditions. Unlike RAVL1, which specifically regulates AMT1;2 expression in brassinosteroid-mediated signalling (Xuan et al., 2017), TCP19 repressed all the AMT1 genes (Figure 3f–h). Promoter analysis and Y1H assays revealed that TCP19 did not directly regulate AMT1;1 or AMT1;3 (Figure S2d–f), suggesting that they may influence their expression through other unknown mechanisms. PhyB modulated TCP19-mediated repression by inhibiting the CIPK31-TCP19 interaction, thereby releasing TCP19 control over AMT1;2 (Figure 3q–t). This highlighted a feedback mechanism in which the action of PhyB on CIPK31 indirectly affected TCP19's repression of AMT1;2. Additionally, PIL15 interacted with both TCP19, IDD10 and BZR1 transcription factors (Figures 5a–c and 6a–f). Although TCP19 repressed AMT1;2, PIL15 activated it (Figure 5i,j), indicating a regulatory balance in NH4+ uptake at downstream of PhyB. Plant immune responses necessitate substantial energy and nutrient investment, often at the expense of growth and nitrogen uptake (Wang and Wang, 2014), thereby impacting NUE. PIL15 may balance the allocation of resources between defence and nutrient acquisition. Under biotic stress, PIL15 might prioritise immune activation, whereas under nutrient-limiting conditions, it likely promotes nitrogen uptake to support metabolic demands. This balance is crucial for the plant's ability to adapt to changing environmental conditions and to optimise nutrient absorption.
Soil salinization negatively affects plant growth and soil fertility by reducing nutrient availability and producing harmful substances that hinder plant development. A few genes related to alkaline stress have been identified in plants (Cui et al., 2023; Kamran et al., 2020). Recent studies have suggested that certain exogenous substances can alleviate saline-alkaline stress. Osmotic regulators such as sugars, betaine, and other compounds such as silicon (Li et al., 2016), γ-aminobutyric acid (Li et al., 2024), and melatonin (Jiang et al., 2016) have been shown to enhance tolerance to salt-alkaline stress. Previous research has indicated that NH4+ uptake can improve the salt-alkaline tolerance of rice roots (Jung et al., 2023), likely due to the release of H+ ions during NH4+ absorption. These H+ ions are expelled through the plasma membrane H+-ATPase (Meier et al., 2020), leading to apoplast acidification, which may help mitigate the high pH levels caused by saline-alkaline stress. Overexpression of OsAHA3, which encodes a plasma membrane-localised H+-ATPase, has been shown to increase H+-ATPase activity, promote nutrient absorption and assimilation in roots (Zhang et al., 2021), and enhance tolerance to SAT (Li et al., 2023). In this study, we revealed a complex mechanism regulating NH4+ uptake through the TCP19-PIL15 interaction. TCP19 negatively regulated NH4+ uptake (Figure 4), and plants with the TCP19 Hap-L variant showed better salt tolerance (Figure S4), suggesting that targeted editing of TCP19 could improve rice yields (Liu et al., 2021) and salt tolerance. Although enhancing NH4+ uptake can significantly improve plant tolerance to saline-alkaline stress and increase yields, excessive uptake poses environmental risks and reduces plant resistance. Our results demonstrated that TCP19 negatively regulated both NH4+ uptake and resistance to rice ShB (Figure 7e,f). In contrast, PIL15 OXs exhibited increased NH4+ uptake but were more susceptible to ShB, indicating that PIL15 is involved in a more complex regulatory network in disease defence. Previous studies have shown that PIL14 integrates light and gibberellin signalling to regulate rice growth under salt stress (Mo et al., 2020). However, our findings further revealed the function of PIL15, which links light signalling with the regulation of ammonium transporters (AMT1) and disease resistance responses. Future research should focus on elucidating NH4+ absorption and metabolism pathways in plants, particularly the signalling networks related to NUE, SAT, and plant immunity.
This study provides new insights into the molecular mechanisms by which PhyB regulates NH4+ uptake and stress responses through the PhyB-CIPK31-TCP19 and PhyB-PIL15-IDD10-BZR1 signalling pathways, offering novel perspectives on how light signalling influences nutrient uptake in plants. We identified a critical interaction between PhyB and CIPK31 (Figure 2c–e), a key regulator of NH4+ uptake in rice (Figure 2h–k), and discovered that CIPK31's C-terminal region interacts with TCP19 (Figure 3d), a central player in NUE. Notably, PhyB did not degrade CIPK31 or directly interact with TCP19; instead, it inhibited the CIPK31-TCP19 interaction, allowing TCP19 to repress AMT1;2 expression, thereby reducing NH4+ uptake (Figure 3q–s). Conversely, PIL15, another key component of this network, activates AMT1;2 expression, thereby promoting NH4+ uptake. PIL15 interacted with TCP19, suggesting a balancing mechanism for NH4+ uptake downstream of PhyB-mediated light signalling. Additionally, PIL15 formed a transcriptional complex with IDD10 and BZR1, collaboratively regulating AMT1;2 expression (Figure 7m). It remained an open question whether these regulatory functions were conserved across different plant species or were specific to rice. Furthermore, the involvement of other components in the PhyB signalling pathway and their interactions with these proteins remained unexplored, leaving pathway complexity only partially understood. Future research should focus on identifying additional factors that influence this signalling cascade and their roles in nutrient uptake and stress responses.
In summary, our study provides significant insights into the PhyB-CIPK31-TCP19 and PhyB-PIL15-IDD1-BZR1 signalling pathways and their roles in regulating NH4+ uptake, SAT, and ShB resistance in rice. Exploring the complex interactions between these key components deepens our understanding of how light signalling, and nutrient uptake are integrated in plants. These findings have important implications for improving rice resilience to environmental stresses and for enhancing NUE, thereby offering new directions for research and crop improvement.
Materials and methods
Plant growth condition and seedling growth assay
In the glass cultivation room at Nankai University, plants were grown under controlled conditions: temperatures between 24 and 30 °C, 70% relative humidity, and a 12-h light period. Nicotiana benthamiana plants were cultivated in growth rooms at 22–25 °C with a cycle of 16 h of light followed by 8-h darkness.
For the seedling growth assay, following the methods described (Leicher and Stegmann, 2024; Wang et al., 2021), the sterilised seeds were first germinated in ddH2O and then transferred to 96-well hydroponic boxes (one seedling per well). Each box contained 1 L of liquid medium containing either 0.5× MS, 0.5× MS with 100 mm NaCl, or 0.5× MS with 80 mm NaHCO3. Plants were grown under normal light/dark cycle conditions, for rice 12 h : 12 h, light : dark cycle and for tobacco 16 h : 8 h, light : dark cycle. Root length was measured after 5–10 days under these growth conditions. ImageJ software (version 1.5.3) (https://imagej.net/ij/) was employed for the root length analysis. Each experiment was conducted in triplicate.
Rhizoctonia solani inoculation assay
The R. solani strain AG1-IA was propagated on potato dextrose agar (PDA) at a constant temperature of 28 °C. The resistance of all rice plants to ShB was evaluated at the third-leaf stage following the methodology described by Cao (Cao et al., 2022). Lesion quantification was performed using ImageJ software. Each experiment was conducted in triplicate.
Methylammonium (MeA) sensitivity test
Sterilised seeds were germinated in ddH2O and then transferred to a 96-well hydroponic box with one seedling per well. Each box contained 1 L of liquid medium, either 0.5× MS or 0.5× MS, supplemented with 3 mm MeA (Sigma-Aldrich). Root lengths were measured after 5–10 days under these growth conditions, and ImageJ software (version 1.5.3) (https://imagej.net/ij/) was used for root length analysis. Each experiment was conducted in triplicate.
Mutants and transgenic plants
The preparation of phyA, phyB, phyC, PhyB OXs, cipk31, CIPK31 OXs, AMT1 RNAi, idd10, idd10/phyB, and phyB/AMT1 RNAi plants has been described previously (Chen et al., 2023; Wu et al., 2022; Yuan et al., 2023). tcp19 and pil15 mutants were generated using CRISPR/Cas9 genome editing technology on the Zhonghua11 background (Ma et al., 2015). Genomic DNA was extracted from the rice transformants for mutation detection, and the PCR products were analysed using primers flanking the target site (Ma et al., 2015). Double mutants, including tcp19-1/AMT1 RNAi, PIL15 OX2/AMT1 RNAi, and tcp19-1/PIL15 RNAi, were obtained by crossing parental lines and genotyping double homozygous mutants in the F2 generation. To generate overexpression lines, the coding sequences of TCP19 and PIL15 were synthesized and cloned into the pCambia1381-Ubi vector. The constructs were introduced into Agrobacterium tumefaciens strain EHA105 and transferred into the rice cultivar Zhonghua11, following the method described (Hiei et al., 1994). The primers used for cloning are listed in Table S1.
Determination of NH4+ concentration
Ammonium (NH4+) concentration in the roots of 7-day-old rice seedlings was quantified using an F-kit (Roche) following the manufacturer's instructions (Oliveira et al., 2002).
RNA extraction and qRT-PCR
Total RNA from three-week-old rice plants was extracted using TRIzol reagent (Invitrogen) following the manufacturer's instructions. The RNA was reverse-transcribed into cDNA using the HiScript III RT SuperMix for qPCR Kit (Vazyme), and qPCR was conducted with ChamQ Universal SYBR qPCR Master Mix reagent (Vazyme) as per the manufacturer's guidelines. RT-qPCR analysis was performed using an ABI-QS1 real-time PCR instrument (Thermo Fisher), with ubiquitin as the control (Xuan et al., 2013). The relative expression levels were calculated using the 2−ΔΔCt method. The primers used for qRT-PCR are listed in Table S1.
Yeast-two hybrid (Y2H) assay
Y2H assays were conducted using the Matchmaker Gold Yeast Two-Hybrid System (Clontech). The coding sequences (CDS) of PhyB, CIPK31, PIL15, TCP19, IDD10, and BZR1 were cloned into pGAD424 and pGBT9 vectors to fuse with AD and BD, respectively, and co-transformed into the yeast strain Y2H Gold. Yeast transformants were selected on synthetic defined (SD) dropout medium. Colonies containing both vectors were first selected on SD medium without leucine and tryptophan (SD/−Leu-Trp) and then tested on a three-deficiency medium lacking leucine, tryptophan, and histidine (SD/−Leu-Trp-His). The plates were incubated at 30 °C for 3–7 days and then photographed. The primers used for Y2H are listed in Table S1.
Yeast-one hybrid (Y1H) assay and yeast-three hybrid (Y3H) assay
Y1H assays were performed using the Matchmaker Gold Yeast One-Hybrid System (Clontech). The 2 kb sequences upstream of AMT1;1, AMT1;2, and AMT1;3 start codon (ATG) were cloned into the pHisi-1 vector and transformed into yeast strain YM4271. Yeast transformants were selected on SD/-His medium. The CDS regions of TCP19 and PIL15 were cloned into the pGAD424 vector and transformed into reporter yeast cells containing pHisi-1-pAMT1. The interactions were analysed in SD/−Leu-His medium containing varying concentrations of 3-aminotriazole (3-AT). For the Y3H assay, the CDS regions of PhyB-C and CIPK31 were cloned into the pBridge vector and co-transformed with AD-TCP19 into the yeast strain AH109. Yeast transformants were selected on SD/−Leu-Trp medium, and the interactions were analysed on SD/−Leu-Trp-His or SD/−Leu-Trp-His-Met medium. The yeast cells were incubated at 30 °C for 3 days and then photographed. The primers used for the Y1H and Y3H assays are listed in Table S1.
Bimolecular fluorescence complementation (BiFC) assay
The coding sequences of PhyB, CIPK31, TCP19, PIL15, IDD10, BZR1, and AMT1 (without stop codons) were cloned into BiFC vectors pXNGW and pXCGW, respectively. All plasmids were transformed into the Agrobacterium tumefaciens strain GV3101 (Kim et al., 2009). To test for specific interactions, pairs of plasmids were co-transformed into the leaves of 5-week-old N. benthamiana plants by infiltration, as previously described. H2B-mRFP1 was utilised as a nuclear marker, and fluorescence signals were imaged 36–48 h after transformation using an Olympus FV3000 laser scanning confocal microscope with 488 and 594 nm lasers to excite the fluorophores. The primers used for BiFC are listed in Table S1.
Co-immunoprecipitation (co-IP) and Western blot (WB) assay
Co-IP of N. benthamiana cells was performed as previously described. The coding sequences of PhyB, CIPK31, PIL15, TCP19, IDD10, and BZR1 (without stop codons) were cloned into pGD-3FLAG, -MYC, and -GFP vectors, respectively. The combinations to be tested were infiltrated into tobacco leaves by Agrobacterium strain GV3101. The samples were harvested at 48 hpi and extracted using an extraction buffer containing 75 mm NaCl, 50 mm Tris–HCl, 1 mm EDTA, 5% glycerol, 0.1% Triton X-100, 1 mm PMSF, and 1x protease inhibitor cocktail. Total protein was immunoprecipitated using anti-GFP magnetic beads (ABclonal Technology) or anti-FLAG magnetic beads (Sigma Aldrich), with 30 μL beads per sample. Protein samples were boiled with 2× loading buffer (1 M Tris–HCl, pH 6.8, 5% SDS, 0.25% Bromophenol Blue, and 25% glycerol) for 10 min and loaded onto 10% or 12.5% SDS-PAGE gels for immunoblot analysis. The WB blotting was performed using anti-GFP, anti-FLAG, and anti-MYC antibodies (Abmart), and signals were detected using a Tanon 4600 system (Tanon).
For competitive co-IP assays, the components were mixed in equal volumes before Agrobacterium infiltration into tobacco leaves. Samples were harvested at 48 hpi, extracted, and incubated with the corresponding beads, followed by western blot analysis. Protein levels were quantified using the Bradford Protein Assay Kit, and ImageJ software was used for protein quantification. Primers used for co-IP are listed in Table S1.
Luciferase complementation imaging (LCI) assay
The coding sequence of CIPK31 was amplified and fused to the C-terminal fragment of luciferase (CLuc) to create CLuc-CIPK31, whereas that of TCP19 was amplified and fused to the N-terminal fragment of luciferase (NLuc) to create NLuc-TCP19. All plasmids were transformed into the Agrobacterium tumefaciens strain GV3101. To test specific interactions, the constructs were co-transformed into the leaves of 5-week-old tobacco plants via infiltration as previously described. After 36–48 h, tobacco leaves were treated with 1 mm luciferin (Promega) for 5 min, and luciferase activity was measured using an imaging apparatus (SH-523, SHbio). Primers used for LCI are listed in Table S1.
Chromatin immunoprecipitation (ChIP) assay
The chromatin immunoprecipitation (ChIP) assays were performed as previously described (Je et al., 2010). Briefly, 10-day-old PIL15-GFP and TCP19-GFP rice seedlings were used. The chromatin from these seedlings was cross-linked with 1% formaldehyde, which was sheared into 200–500 bp fragments by sonication, and used for immunoprecipitation with anti-GFP (ABclonal Technology). After reversing the cross-links, the immunoprecipitated DNA was analysed by qRT-PCR using primers specific to regions of the AMT1 gene. The primers used for target genes in the ChIP assay are listed in Table S1.
Electrophoretic mobility shift assay (EMSA)
The open reading frame (ORF) sequences of TCP19 and PIL15 were cloned into the pGEX-5X-1 vector and the GST-TCP19 or GST-PIL15 recombinant proteins expressed in the Escherichia coli BL21 (DE3) strain. The recombinant GST-TCP19 and GST-PIL15 fusion proteins were induced with addition of 0.5 mm isopropyl-β-D-thiogalactopyranoside (IPTG) for 6 h at 37 °C, followed by purification using GST purification columns (LABLEAD, China). Oligonucleotide probes were directly synthesized and were biotin end-labelled following annealed to double-stranded probe DNA. The assays were performed using the chemiluminescent EMSA kit (Thermo). Primers used for EMSA are listed in Table S1.
Transactivation assay
The pGreenII 0800-LUC cloning vector was used in the transient transactivation assay (Hellens et al., 2005). The promoter region of AMT1;2 (−1 to −1800 bp) was cloned into pGreenII 0800-LUC to drive the LUC gene and generate a reporter construct. Effector plasmids (p35S::TCP19, p35S:CIPK31, p35S::PIL15, p35S::IDD10, and p35S::BZR1) and a reporter plasmid (pAMT1;2) were co-transformed into tobacco leaves. After 36–48 h, the leaves were treated with 1 mm D-luciferin (Promega) for 5 min, and luciferase activity was measured using an imaging apparatus (SH-523, SHbio). The primers used for transactivation assays are listed in Table S1.
Statistical analysis
The statistical analysis was performed using GraphPad Prism software (version 9.4.1). All data were presented as the mean ± standard error (SE; n > 3). Student's t-test was applied to determine the statistically significant differences between two groups, while one-way analysis of variance (ANOVA) was used for comparisons between more than two groups. Significantly different means are indicated by different letters, as determined by two-way ANOVA with Tukey's post hoc test (P < 0.05). NS indicates no significant difference. All experiments were performed at least three times in the laboratory.
Acknowledgements
We sincerely appreciate Prof. Shimin Zuo from Yangzhou University for providing haplotypes Hap-H and Hap-L rice seeds used in this study. We thank Prof. Jianmin Zhou from the Institute of Genetics and Developmental Biology, Chinese Academy of Sciences for providing the vectors used in the LCI assay. This study was supported by the National Natural Science Foundation of China (grants numbers 32372482, 32072406 and 32402332), and the China Postdoctoral Science Foundation (2024 M751276).
Conflict of interest
The authors declare no conflicts of interest.
Author contributions
YHX and HC planned and designed the study. HC, TGZ, XXW and VK performed the experiments. HC, and TGZ analysed the data. HC, XGL and YHX wrote the manuscript. All authors approved the final manuscript.
Open Research
Data availability statement
Sequence data from this study can be accessed in the Rice Annotation Project Database under the following accession numbers: PhyB (LOC_Os03g19590), PhyA (LOC_Os03g51030), PhyC (LOC_Os03g54084), CIPK31 (LOC_Os03g20380), TCP19 (LOC_Os06g12230), PIL15 (LOC_Os01g18290), IDD10 (LOC_Os04g47860), BZR1 (LOC_Os07g39220), AMT1;1 (LOC_Os04g43070), AMT1;2 (LOC_Os02g40730), AMT1;3 (LOC_Os02g40710).


