Epizoic yellow sponge (Poecilosclerida, Demospongiae) expansion on living Scleractinian corals in Bintan, Riau Archipelago, Indonesia
Abstract
Coral reef ecosystems in Indonesia are under threat due to changes in the environment driven by global climate change, along with local disturbances such as sedimentation and eutrophication. Consequently, comprehensive coral reef monitoring activities have been initiated at numerous locations across Indonesia. In this study, the findings from coral reef health surveys across 14 reef sites (within 40 hectares) in the Bintan area (Riau Archipelago, Indonesia; 100 km southeast of Singapore) revealed a potentially novel epizoic yellow sponge species (Phorbas sp.) that overgrows coral colonies. This species, tentatively classified as a new Phorbas sp. (order Poecilosclerida: family Hymedesmiidae), was identified through a combined approach employing classical taxonomic methods along with DNA barcoding using the cytochrome c oxidase I (COI) gene. At every site, three permanent 20-m transects were established to annually monitor live coral coverage and species composition between 2014 and 2017. The survey indicated a notable change in the overall coral cover during this period. The abundance of coral diseases was investigated in 2014 and 2017. Additionally, the progress of Phorbas sp., was closely monitored (i.e., every second day for one week) at Bintan Island (site 11) during the dry season in August 2017. This approach aimed to approximate the relative impact of each incident on the coral's condition. The results indicated that the most comprehensive change occurred due to the overgrowth of Phorbas sp., which affected 12 scleractinian coral species across eight genera in almost all sites except one. The abundance of this epizoic sponge infestation was highest at Pulau Beralas Pasir (site 10), constituting 22.9% of all recorded life forms, and lowest at Pulau Pangkil-Besar (site 13), with only 0.7%. The expansion of the thin yellow sponge tissue was estimated to increase by up to 0.51 ± 0.48 cm2 per day on Porites coral.
1 INTRODUCTION
Marine sponges, complex benthic sessile invertebrates, and filter-feeding organisms are frequently associated with other marine biota, including corals. Encrusting sponges found on hard surfaces, including corals, typically appear in various surface shapes such as branching, tubular, globular, flabellate, encrusting, massive, repent, cub, and foliose forms (Boury-Esnault & Rützler, 1997; Hadi et al., 2018). Sponges belonging to the Clionaidae family are organisms that bore into surfaces, employing chemical or mechanical defense mechanisms to compete for space (Calcinai et al., 2000; Risk et al., 1995; Zundelevich et al., 2007).
Few reports exist regarding coral diseases and sponge expansions affecting coral health in Indonesian waters, despite the regular monitoring carried out in several areas since 1996 using permanent coral transects by the Coral Reef Monitoring and Management Program (COREMAP). As reported by Johan et al. (2017) in Bintan, Riau Archipelago, and by Riegl et al. (2012) in Abu Dhabi, some coral diseases were initially mistaken for sponge expansion on corals, requiring further analysis.
Compromised coral health results from non-infectious impacts that cause wounds that are potentially damaging the host coral. There are several categories of compromised coral health: pigmentation response, unusual bleaching patterns, competition and aggressive overgrowth by other benthic organisms, sediment damage, and flatworm infestation (Beeden et al., 2008; Raymundo et al., 2008).
When monitoring coral diseases, sponge competition among corals was classified as compromised health, such as Terpios hoshinota, which can either cover or even kill coral in Taiwan, Indonesia, and the Great Barrier Reef (de Voogd et al., 2013; Raymundo et al., 2008; Wang et al., 2012). For instance, T. hoshinota covered several genera of coral, namely Acropora, Favia, Gardineroseris, Montipora, Pocillopora, and Porites, in Belanda Island, Dua Island, and Tikus Island, Seribu Islands, Indonesia (Utami et al., 2018). Competition for space and interaction with fast-growing sponges, such as Desmapsamma anchorata (Fuji et al., 2011; Mclean et al., 2015), can cause mass mortality among corals and other resident organisms (Bryan, 1973; Rützler & Muzik, 1993).
The presence of certain sponges in coral reef ecosystems could potentially be used as indicators of marine habitats (de Voogd & Cleary, 2008).
Indonesia has a very high diversity of sponges, with 100 species across 38 families in the Wakatobi region (Bell & Smith, 2004), 154 species across 75 genera and 34 families from Southwest Sulawesi (de Voogd et al., 1999), 168 species across 62 genera and 37 families in Berau (de Voogd et al., 2009), and a total of 94 species, including 6 new species, in the Marine Park of Bunaken, North Sulawesi (Calcinai et al., 2017). Notably, in the Seribu Islands, non-encrusting sponges (118 species) were found to be more abundant than the thin encrusting, cryptic, and boring sponge species (de Voogd & Cleary, 2008).
Encrusting, cryptic, and excavating sponge species have frequently been overlooked in many biodiversity studies. Therefore, it is crucial to document and monitor potential coral-overgrowing sponge species. This paper reports on a potentially newly discovered epizoic yellow sponge species that is overgrowing corals in the Riau Archipelago, raising concerns about its potential adverse effects on surrounding regions in the area.
2 MATERIALS AND METHODS
2.1 Study sites
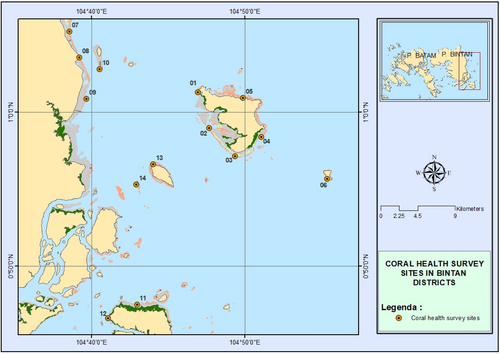
In this study, 14 permanent sites established in 2007 (Figure 1) were utilized. The study sites were surveyed annually for coral reef health assessment as part of the Coral Reefs Rehabilitation and Management Program (COREMAP) in Indonesia. Previous studies (Capenberg & Djuwariah, 2008) indicated the presence of 118 coral species across 13 genera in the area, with coral coverage estimated at approximately 50–90%. In the same area, a new sponge expansion was detected in 2014, identified and referred to as ‘yellow syndrome’ (Johan et al., 2017). The latest survey in 2014 has shown that the area is dominated by dead coral with algae (DCA), along with Acropora and non-Acropora corals, as well as sandy areas (Johan et al., 2017). At site number 11, the coral cover data indicated the presence of 5.5% DCA, 32.1% non-Acropora, 0.3% Acropora, 6.2% sponge, 3.1% fleshy seaweed, 3.4% sand, and others, including DCA at 49.5%. Due to its location near the mainland, this site served as a collection point for coral samples intended for DNA analysis and for monitoring the progress of the sponge expansion. For visual reference, the study sites are depicted in Figure 1.
2.2 Coral reef condition assessment (in sponge expansion areas)
Coral conditions were classified based on the following categories: excellent (>75%), good (50–75%), poor (25–50%), and very poor (<25%) of live-coral cover at the studied location (Gomez & Yap, 1998; Zamani & Maddupa, 2011). The data on live coral cover (LCC) were collected using the underwater phototransect method. The photo was taken every 1 m along three 20-m-long transects, with quadrants of 58 × 44 cm (Giyanto et al., 2010). The total number of photos for each transect was 20 pictures, with 10 pictures taken from each side of the line transect, both left and right. Pictures of the transects were captured using an underwater camera (G16 Canon, USA). Thirty points were analyzed within each picture using the Coral Point Count based on Excel (CPCe) software (Kohler & Gill, 2006). The results of this analysis were used to classify the conditions of the coral reef based on the aforementioned criteria, providing insights into the level of reef degradation.
2.3 Coral disease abundance (in sponge expansion areas)
In this survey, eight criteria were used to describe the coral's health status. These criteria included three types of disease (i.e., white syndrome ‘WS’, bleaching ‘B’, and focal bleaching ‘FB’), along with five categories of compromised health status. These categories involved sponge expansion, sedimentation damage, algae competition, pigmentation due to interactions with competitors (such as worms and algae), predation by the starfish Acanthaster plancii, and gastropod predation by Drupella sp. The primary emphasis of sponge expansion records is on the encrusting yellow sponge, identified as a new coral disease (Johan et al., 2017). The criteria used to classify coral diseases were established in the works of Raymundo et al. (2008) and Pollock et al. (2014).
2.4 Sponge expansion progress
The rate (progress) of the sponge expansion on two coral colonies was followed using the underwater-photo method. Pictures were captured on the same coral colonies at two different points in time over the last 5 months and compared with current photos from this survey. Each photo was captured with a scale ruler in the picture. The area of sponge expansion was calculated by selecting “area of covering by sponge” from the collected pictures using the Image J (v.1.51j8) software.
2.5 Water physical and chemical parameters
Data were collected over 4 days in August 2018, with three replications each day, using a YSI (Yellow Springs, USA) multi-parameter sensor. This device measured salinity (PSU), dissolved oxygen (DO) in mg O2. L−1, pH, and turbidity (NTU) for in situ surface measurements.
2.6 DNA extraction
The DNA extraction followed the Dneasy Blood & Tissue Kit (Qiagen) protocol. Approximately 5 g of sponge tissue were homogenized by blending the sponge crust until achieving a uniform consistency. The quality of DNA was tested by measuring DNA concentration using a TECAN instrument (Infinite 200 PRO, Switzerland), ranging from 148.5 to 662.6 μg ml−1.
2.7 Molecular analysis
2.7.1 16S rDNA gene amplification
The 16S rRNA gene was amplified using the following primers: 27 FFAM (5′-CAGGCCTAACACATG AAGTC-3′), labeled with phosphoramidite fluorochrome 5-carboxyfluorescein (FAM), and 1387R (5′-GGGCGGAGTGTACAAGGC-3′) (Marchesi et al., 1998). A 25-μL master mix was prepared with the following composition: 12.5 μL GoTaq Green Master Mix (2×; Promega); 1.0 μL forward primer; 1.0 μL reverse primer; 9.5 μL H2O; and 1.0 μL template. The PCR was performed with an initial denaturation step at 95°C for 3 min, followed by 30 cycles of denaturation at 95°C for 60 s, annealing at 55°C for 60 s, and extension at 72°C for 90 s. A final extension was performed at 72°C for 20 min. Subsequently, the PCR products were visualized on a 1% agarose gel in 1× TBE buffer.
Sponge-covered coral samples were collected from site 11 and subsequently preserved in 96% ethanol until analysis at ZMT. DNA extraction from these samples was performed using the DNeasy kit. Samples with sufficient quantity and quality of DNA were further amplified using the following pairs of primers:
Cytochrome oxidase I (COI): LCO1490 (5′-GGTCAACAAATCATAAAGATATTGG-3′) and HCO2198 (5′-TAAACTTCAGGGTGACCAAAAAATCA-3′), producing an amplicon of 710 bp (Folmer et al., 1994).
UniMinibar: UniMinibarF1 (5′-TCCACTAATCACAARGATATTGGTAC-3′) and UniMinibarR1 (5′-GAAAATCATAATGAAGGCATGAGC-3′), resulting in a 130-bp amplicon (Eukaryota; Meusnier et al., 2008).
18S rDNA: 18S-univ-F-566 (5′-CAGCAGCCGCGGTAATTCC-3′) and 18S-univ-R-1200 (5′-CCCGTGTTGAGTCAAATTAAGC-3′), resulting in 630–700-bp amplicon (Hadziavdic et al., 2014).
ITS2 ± 4: ITS2 (5′-GCTGCGTTCTTCATCGATGC-3′) and ITS4 (5′-TCCTCCGCTTATTGATATGC-3′) producing an amplicon of 490 bp (White et al., 1990).
This study employed a standard three-step amplification PCR program. It involved an initial DNA denaturation phase lasting 2 min at 95°C, followed by 35–40 cycles (consisting of 30 s at 94°C for denaturation, 30 s at 40°C for primer annealing, and 1 min at 72°C for extension). Subsequently, a final extension step for 5 min at 72°C was conducted. The PCR master mix was prepared using the following components: 10× reaction buffer B (Roboklon) 1×, one Tag GC Enhancer (Roboklon), 10 mM dNPTs (Thermoscientific) 200 μM, 10 μM forward primer (Biomers) 0.2 μM, 10 μM reverse primer (Biomers) 0.2 μM, 1 unit Tag DNA polymerase (5 U/μL) (Roboklon), and template DNA.
The sequence data were analyzed using BioEdit V.7.0.5.3 and Mega V.7.0.26 as statistical tools for DNA and protein sequence analysis. This analysis aimed to construct a phylogenetic tree indicating the similarity between the sample and other sponges in trusted publications and gene banks (Tamura et al., 2011).
Sponge identification was conducted at the Naturalis Biodiversity Center in Leiden, the Netherlands. To create microscopic slides, a small piece of the specimen was dissolved in household bleach to remove organic material. After dissolution, the mixture underwent three water washes and two washes with 96% ethanol. A portion of the solution was pipetted onto a microscopic slide, air-dried, embedded in an ultrabed, and examined using a light microscope. Additionally, a few drops of this solution were placed on an aluminum stub, coated with gold, and examined using the Jeol Scanning Electron Microscope (SEM).
2.8 Statistical analysis
The change in live coral percentage from 2014 to 2017 was analyzed using one-way ANOVA for variance analysis. Prior to conducting the ANOVA analysis, normality and homogeneity tests were applied. Similarly, observations on sponge attachment to corals lasting <1 week were analyzed. The data were processed using IBM SPSS Statistics 21 software.
3 RESULTS
3.1 Coral condition based on live coral coverage
While the live coral cover increased only at site 4, from 21.6% in 2014 to 32.4% in 2017, it remains in poor condition. Across 11 other sites, the live coral coverage exhibited fluctuations. For instance, at sites 7 and 8, the coral condition declined between 2014 and 2017. The average live coral data in 2016 was higher at 38.0%, but by 2017, it had decreased to 32.9%. Statistical analysis revealed significant changes (p < .05) across all sites from 2014 to 2017 (Figure 2).

3.2 Coral disease and compromised health abundance
The coral health status is depicted in Figure 3. Notably, yellow sponge expansion was absent only at site 07, with the highest occurrence observed at site 10 (22.9 colonies. m−2), followed by 12.1 colonies per m−2 at site 11. White Syndrome was identified at four sites, with the highest abundance (2.9%) noted at site 03. Focal bleaching was detected at two sites, while bleaching was evident only at one site, site 06 (0.7 colonies m−2). Gastropod predation was recorded at seven sites, with the highest abundance observed at site 13 (2.4 colonies m−2). Additionally, pigmentation response was observed at two sites (0.7 colonies m−2).

Phorbas sp. was most frequently found on Porites sp. (9 colonies), Montipora aequituberculata (Bernard 1897), and Pavona decussata (Dana 1846) (8 colonies; see Table 1). These corals tend to provide a larger surface area for sponge settlement due to their massive and foliose growth forms. Conversely, the least frequent expansion occurred on Porites cylindrica (Dana 1846), Platygyra sp., Echinopora sp., and Goniopora sp. These species offer less space for sponge coverage due to their branching and small, massive growth forms. While Phorbas sp. was found on Porites sp. at 4 sites, it was observed on Montipora aequituberculata (Bernard 1897) and Duncanopsammia peltata (Esper 1790) at only two sites. Sponge expansion on other coral species was found at only one site.
| Infected species | ∑Colony | ∑ (sites) |
|---|---|---|
| Acropora sp. | 2 | 1 (6) |
| Duncanopsammia peltata (Esper, 1790) | 7 | 2 (10,12) |
| Echinopora sp. | 1 | 1 (13) |
| Goniastrea sp. | 4 | 1 (13) |
| Goniopora sp | 1 | 1 (11) |
| Montipora sp. | 8 | 2 (6,12) |
| Pachyseris rugosa (Lamarck, 1801) | 5 | 1 (11) |
| Pavona decussata (Dana, 1846) | 8 | 1 (11) |
| Platygyra sp. | 1 | 1 (1) |
| Porites sp. | 9 | 4 (4,10,14,12) |
| Porites cylindrica (Dana,1846) | 1 | 1 (2) |
| Porites rus | 2 | 1 (11) |
| Turbinaria mesenterina (Lamarck, 1816) | 5 | 1 (10) |
3.3 Sponge expansion progress
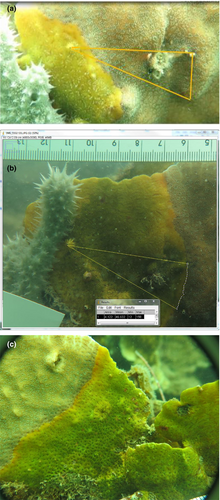
After 5 months (145 days), the growth of Phorbas sp. on Pavona decussata measured 5.1 cm2. Initially, the expansion area during the first sampling was 0.2 cm2, which notably increased to 5.1 cm2 after this duration, indicating an estimated daily progress of 0.04 cm2 per day (refer to Figure 4a,b). This potentially new yellow epizoic sponge species was discovered across nearly all locations during surveys in Bintan waters over several years from 2014 to 2017.
3.4 Water physical and chemical parameters
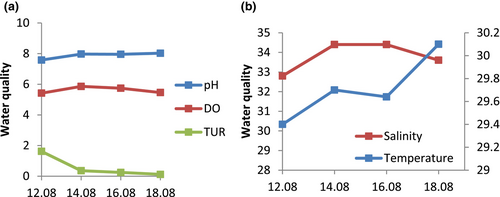
The mean water salinity and temperature were 34.4 PSU and 30.1°C, respectively (refer to Figure 5a). The highest recorded pH, DO, and turbidity were 8.0, 5.9 mg O2 L−1 and 1.62 NTU, respectively (refer to Figure 5b).
3.5 Taxonomic identification and molecular analysis
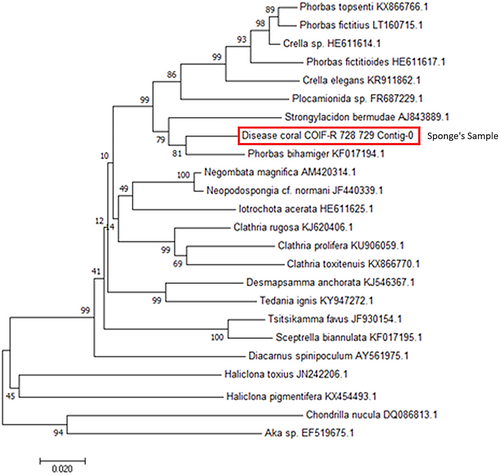
The yellow sponge sample that showed the best sequencing result on the Agarose gel was from the coral Pavona frondifera (Lamarck 1816) (LCO 1490 and HCO2198 with a dilution of 1:10 mL). Phylogenetic tree analysis revealed that the potentially new sponge species is very similar to Phorbas bihamiger (order Poecilosclerida) from the Celtic Seas and has some similarity to both Crella sp., and Plocamionida sp. (Figure 6). The resulting DNA sequence has been submitted to GenBank under the code SUB9697249 Disease_coral_COIF-R_728_729_Contig-0 MZ267792.
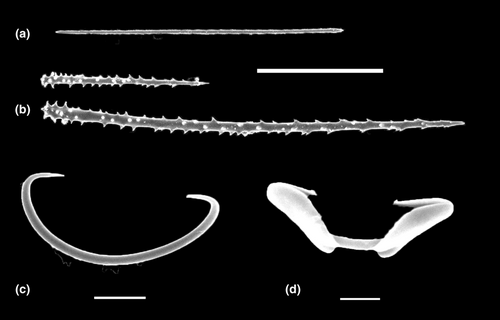
Taxonomic identification of the sponge sample was challenging due to the very small size of the fragment available for examination, which only allowed for spicule examination. The spicules were composed of tornotes (100 × 3 μm), two sizes of acanthostyles (50–60 × 2–3 μm and 150–160 3 × 4 μm), small arcuate isochelae (7–8 μm), and sigmas (30 μm). Based on these characteristics, the sponge was provisionally identified as Phorbas sp. (order Poecilosclerida; family Hymedemiidae; refer to Figure 7).
4 DISCUSSION
This study conducted a coral reef health survey across 14 permanent locations from 2014 to 2017. In 2014, the discovery of a new sponge initially termed ‘yellow syndrome’ (Johan et al., 2017) was reported. Further in-depth analysis identified this potentially new sponge species provisionally belonging to the genus Phorbas (order Poecilosclerida; family Hymedemiidae). So far, this sponge appears to have a restricted distribution, having been only observed in Bintan's waters (Johan et al., 2017) and through personal observations made by one of our team members (NdV) in the Spermonde Archipelago, SW Sulawesi. A report of the Yellow Band Disease (YBD) in the Arabian Gulf might also possibly be attributed to the same present species (Riegl et al., 2012). The species might be misidentified or overlooked in other regions. Sponges belonging to the genus Phorbas are characterized as Hymedesmiidae with plumose tracts of tornotes and/or acanthostyles with normal-shaped chelae and sigmas. Currently, there are 82 accepted species within the genus Phorbas in the Pacific region (Aquilar-Camacho & Carballo, 2012; de Voogd et al., 2021). Our molecular analysis showed a relationship between the current species and the British species Phorbas bihamiger (Waller 1878). While these species share similarities in spicule structure, they differ in size dimensions. Additionally, Phorbas bihamiger exhibits yellow coloration, yet has a massive morphology exclusive to British waters. Only a few species have both sigmas and arcuate isochelae, alongside either oxeas or tornotes and acanthostyles, albeit with varying sizes. In this discussion, we focus on species that share a similar spicule composition.
Phorbas fulvus (Bergquist and Fromont 1988) is a thinly yellow to brown encrusting species from New Zealand. This has two sizes of arcuate chelae (9–16 μm and 23–38 μm), sigmas (12.5–20 μm), oxeas (128–147 μm), and two sizes of acanthostyles (60–102 μm and 120–180 μm). Phorbas gravidus (Dendy 1896) is a brown, massive-shaped sponge from southeastern Australia. It possesses arcuate isochelae (23 μm), sigmas (30 μm), oxeas (140 μm), and acanthostyles (60 μm). Meanwhile, Phorbas roxasi (de Laubenfels 1935) is a pale gray, amorphous sponge from the Philippines with arcuate isochelae (16 and 36 μm), sigmas (12.5–20 μm), tylotes (220 μm), and acanthostyles (155 μm). Lastly, Phorbas ucifer (Dendy, 1896) is a pale yellow, thinly encrusting sponge found in southeastern Australia with arcuate isochelae (4 μm), sigmas (33 μm), oxeas (160 μm), and acanthostyles (180 μm).
Phorbas epizoaria (Levi 1958), from the Red Sea, is noteworthy for its reported overgrowth on gorgonians and an ascidian. This sponge exhibits orange coloration and has two sizes of acanthostyles, though with a given range (50–150 μm). It shares similarities with tornotes, albeit larger than our species (140–165 × 2–3 μm) and small isochelae (11–14 μm), yet lacks sigmas. The sponge species currently observed is very likely to be a new species and is pending formal description.
The life coral cover decreased at 12 of the 14 sites in Bintan's waters between 2014 and 2017. This decline might be attributed to increasing environmental stress factors, such as reduced visibility and sedimentation resulting from sand mining impacts (Ishak et al., 2014). Moreover, anthropogenic pollution from coastal area development, as indicated by elevated levels of total suspended solid (TSS), nitrate (NO3), nitrite (NO2), ammonium (NH4), and orthophosphate (PO4-P) (Azizah, 2017), likely contributes to this decline. Furthermore, illegal fishing practices exacerbate these challenges. The reduction in live coral cover seems to be associated with an increase in sponge tissue covering corals. Similar findings have been reported in the Wakatobi Marine National Park (WMNP) in Indonesia (Powell et al., 2010).
Sponge abundance and diversity are influenced by environmental conditions. For instance, areas experiencing high sedimentation rates often exhibit reduced sponge diversity. However, these high-sedimentation locations might be dominated by a single sponge species, such as Lamellodysidea herbacea, which constitutes 42% of the total sponge population in the WMNP (Powell et al., 2014).
An increase in orthophosphate concentrations was significantly correlated with the invasion of the coral-killing sponge Terpios hoshinota in the Seribu Islands (Utami et al., 2018); likewise, in Bintan waters, high orthophosphate concentrations (Azizah, 2017) were associated with the detection of the potentially new yellow sponge species.
Due to its extremely thin tissue that encrusts corals, distinguishing this new sponge from disease in the field becomes very difficult. It requires very careful and close observation, and sometimes samples need to be taken to the laboratory to identify the yellow, thin, spongy tissue on top of living coral tissue. Our study could show that overgrown corals are still alive, according to Figure 4c, where the corallites of the coral were not different from the rest of the live coral colony. After 5 months, the coral skeleton remained as hard as that of a live coral, particularly Pavona spp., characterized by its foliose growth form colony with two sides, only one of which was covered by sponge during sample collection for DNA analysis. The pattern of the sponge was identified after a time series inspection during a week when the silt remained on the foliose coral colonies due to a very slow current. When any current occurs, the silt will move away from the coral colonies; this condition was assumed to be the yellow syndrome in a previous paper (Johan et al., 2017). This type of sponge is classified as epizoic and has been observed to influence coral health in coral disease surveys. Its impact differs from that of other sponges like Terpios hoshinota, which smothers and kills corals (Tang et al., 2011). Additionally, this differs significantly from Yellow Band Disease (YBD), where the underlying coral tissue is deceased, exposing the bare skeleton, particularly in older sections.
The expansion rate of Phorbas sp. measured 0.04 cm2 per day and reached 5.1 cm2 on Pavona decussata after 5 months. Other data reported the expansion rate of this sponge on branching corals: Acropora sp. at 0.17 (±0.08) cm2 per day, and Stylophora sp. at 0.03 cm2 per day (Rossi et al., 2015). In contrast, Terpios hoshinota exhibited a rate of 0.07 cm2 per day (Nugraha et al., 2020), much lower than Phorbas sp.
Indonesia is home to numerous sponge species, particularly within the Wakatobi Marine National Park (WMNP), where a study documented over 100 species (across 38 families) from two islands, Sampela and Hoga (Bell & Smith, 2004). Among these species are harmful ones that can pose a threat to coral health, such as Terpios hoshinota and Cliona sp. (Halperin et al., 2015). The potentially new species, discovered thus far only in Bintan waters, requires further molecular analysis and a comprehensive taxonomic description.
Encrusting sponges like Terpios hoshinota exhibit a rapid growth rate of approximately 22 mm per month, as reported from the Maldives (Montano et al., 2015), the subtropical northwestern Pacific Ocean (Liao et al., 2007), the Great Barrier Reef (Fuji et al., 2011), and Bengkulu and Seribu Island in Indonesia (de Voogd et al., 2013; Utami et al., 2018; van der Ent et al., 2016). This species also demonstrates the capability to overgrow living coral colonies, including Porites, Acropora, Cyphastrea, Montipora, and Pavona, across 13 different locations at depths ranging from 7 to 24 m (Montano et al., 2015).
Another coral-killing sponge, Chalinula nematifera, an encrusting sponge (Porifera: Haplosclerida), has been identified in Komodo, Indonesia, alongside Chalinula milnei (Rossi et al., 2015). This sponge interacts with 13 coral species, including Coscinaraea exesa, Goniastrea edwardsi, Montipora sp., Acropora sp., Seriatopora cf. guttata, Pachyseris speciosa, Montipora foliosa, Pavona duerdeni, Pectinia lactuca, Ctenactis echinate, and Tubastraea micranthus (Turicchia et al., 2018). Chalinula outbreaks appear to occur sporadically and locally; however, they have the potential to become invasive in some areas (de Voogd et al., 2013).
While sponges are able to adapt to certain extreme water parameters, sponge predators and competition for space with other marine biota most likely limit the distribution of those sponges into other coral reef areas (Przeslawski et al., 2015).
5 CONCLUSIONS
Observations revealed a potentially new species, Phorbas sp., exhibiting overgrowth on 12 distinct species across eight genera of scleractinian corals. The expansion rate of this sponge was 0.04 cm2 per day−. These sponge overgrowths on corals were identified across three types of coral diseases present at the sites. Furthermore, this study re-examined previous detections of the yellow syndrome from the same site in Bintan, suggesting a re-evaluation of findings related to the Yellow Band Disease (YBD) from Abu Dhabi.
AUTHOR CONTRIBUTIONS
The main author who conceived and designed the experiments: OJ. Performed the experiments: OJ, AB. Analyzed the data: OJ, SA. Contributed reagents/materials/analysis tools: OJ, AK, SA NdV. Wrote the paper: OJ, NdV, SA, AK.
ACKNOWLEDGMENTS
We thank the Centre for Science and Technology of the Non-Aligned and Other Developing Countries (NAM S & T) for the fellowship, which funded the stay and analysis of OJ in ZMT. Thanks to CV. Cahaya Baru for funding a survey with samples from Bintan for molecular analysis. Thanks to Dr. Achim Meyer and the ZMT laboratories, which supported the analyses, very helpful lab technicians enabled this work. To UMRAH (Raja Ali Haji Maritime University) in Bintan, Riau Archipelago, for equipment and field support (especially Abdul Muin and Edi as boat captains).
CONFLICT OF INTEREST STATEMENT
The authors declare that the research was conducted in the absence of any commercial or financial relationships that could be construed as a potential conflict of interest.
Open Research
DATA AVAILABILITY STATEMENT
The original contributions presented in the study are included in the article. Further inquiries can be directed to the corresponding author.


