Tidal effects on phytoplankton assemblages in a near-pristine estuary: a trait-based approach for the case of a shallow tropical ecosystem in Brazil
Abstract
The study of near-pristine estuaries can be used as a tool for mitigation projects of harmful effects in anthropogenic eutrophic systems, since one can analyze the effect of temporal and spatial variations generated mainly by natural forces. Phytoplankton taxonomy has been used as a classical indicator to assess changes in transitional water communities, however alternative methods based on morphological, behavioral and physiological traits offer the opportunity to compare sites or moments with different taxonomic compositions. Our goal, in this context, is to evaluate phytoplankton community short-term and seasonal variability in a near-pristine estuary, Barra Grande estuary (Ilha Grande, RJ, Brazil), through species functional traits and thus community functional diversity. Samplings were carried out in a mooring in complete tidal cycles, seasonally during 2012. Our results showed a diverse phytoplankton community with 38 frequent and abundant taxa, marked by density variation (1.2 × 10.4–2 × 10.7 cell L−1) in depth, with abundance inversely related to tidal currents. The functional structure of the phytoplankton community measured by functional diversity (FD), varied seasonally in and across a gradient of tidal energy. A core community, mainly represented by flagellates and dinoflagellates, occurred in all observations and was highly functional (high FD), exploiting a variety of habitats. The chain-forming diatoms were associated with high tidal energy, and occurred in higher densities during summer. Phytoplankton cell size, cell shape, and the ability to form colonies are extremely plastic traits that can be regulated by the environment, however, isolated tychopelagic diatoms were present in the study area across all seasons, with higher contributions in autumn and winter, reflecting the shallow characteristic of this system. During the winter, an exposed sandbar was formed, and the lack of connection with the ocean resulted in an abundance of riverine and brackish water taxa. In this near-pristine estuary the densities and occurrences of HAB phytoplankton are low. Trait-based analyses add information about community structure, which can be impacted by anthropogenic actions in urbanized coastal systems. Thus the information provided by this study regarding phytoplankton functional diversity and its relation to nutrients and hydrography in Barra Grande Estuary can be applied as a baseline model for the development of public policies.
1 INTRODUCTION
Estuarine ecosystems represent a transition between freshwater and marine environments and thus are highly dynamic with constant changes in environmental factors such as temperature, salinity, turbidity, and tidal currents (Miranda, Castro, & Kjerfve, 2002). As a consequence, estuaries possess a wide variety of habitats that support a diverse flora and fauna, including not only freshwater and oceanic species, but also species that have adapted to the specific environmental conditions of estuarine ecosystems (e.g. Sheaves, Baker, Nagelkerken, & Connolly, 2015). Being a protected and resource-rich environment, estuaries frequently serve as nursery areas; several fish species, for example, as well as other animals use estuaries for reproduction. Estuaries provide other important ecosystem services as well, such as primary production and nutrient cycling. Despite comprising a small portion of marine ecosystems, estuaries are responsible for approximately 8% of total marine primary productivity (Longhurst, Sathyendranath, Platt, & Caverhill, 1995). Estuaries also possess social and economic value, and support the subsistence of human communities that live in adjacent areas.
Plankton communities and water quality of estuaries situated in highly urbanized areas are compromised by the impact of anthropogenic activities, such as the input of land-derived nutrients, industrial effluents and the discharge of untreated sewage (Mallin, McIver, Robuck, & Dickens, 2015; Valiela, Owens, Elmstrom, & Lloret, 2016; Wolters, Gillis, Bouma, Katwijk, & Ziegler, 2016; Zingone et al., 2010). Few estuaries, or perhaps even none, remain free of impact by anthropogenic activity; thus, most of the ecological studies conducted in estuarine ecosystems must consider the effects of pollution. However, some estuaries, mainly those located in protected areas, still resemble near-pristine conditions (i.e. Willinga Lake and Sandon River , Northern Rivers region of New South Wales, Australia). Studies of such estuaries are important to the development of public policies that assist environmental agencies responsible for decision-making regarding the establishment of conservation areas and the mediation of environmental conflicts (e.g. Hallett et al., 2016; Murray et al., 2006; Rothlisberg & Burford, 2016).
Phytoplankton has short life cycles and responds quickly to environmental changes, and so species are useful as bioindicators (Round, Crawford, & Mann, 1990). Thus, changes in the community composition and abundance of phytoplankton can reflect environmental variation (e.g. MacIntyre & Cullen, 1996). According to the intensity and frequency of this variation, qualitative and quantitative attributes of a phytoplankton community can be altered by selection for species through competition, resulting in the survival of those favored according to their adaptive strategies (Reynolds, 1988). Trait-based approaches can help explain species distributions along environmental gradients, and can be successful in increasing understanding of phytoplankton diversity and community structure (Litchman, Pinto, Klausmeier, Thomas, & Yoshiyama, 2010). Among the most significant traits that shape phytoplankton distribution are those of morphology (with size being a master trait), physiology, behavior and life history (Litchman & Klausmeier, 2008). When excluding or minimizing direct anthropogenic influences, shifts in phytoplankton composition and functional diversity are mainly derived from variation in the physical environment. Overall, tidal forces are largely responsible for short-term changes in phytoplankton biomass, species composition, growth and primary production (Wetz, Hayes, Lewitus, Wolny, & White, 2006).
The Barra Grande Estuary is situated in Southeast Brazil (Ilha Grande, state of Rio de Janeiro). It is part of a protected environmental area, and can be considered near-pristine, according to specifications in the National Land and Water Resources Audit (NLWRA) (2002) detailed in Murray et al. (2006) for Australian estuaries. Being a minimally impacted ecosystem of small size (in terms of depth, width and length) and with only one riverine input, the Barra Grande Estuary is similar to a real mesocosm, but without the need to manipulate features and make simplifications as is inherent for artificial systems.
Given this scenario, the aims of the present study were to: (i) characterize the phytoplankton community with regard to the morphological, physiological and behavioral traits of the species present; and (ii) investigate how phytoplankton assemblage responds to tidal influence over the short term as well as seasonally.
Our results not only provide new insights into the dynamics of phytoplankton of the Barra Grande Estuary, but also support a more integrated approach to decision-making, as observations in natural systems are rare, yet needed as baseline data for incorporation into predictive models. Such information is particularly important for shallow tidally driven estuarine systems (Cloern, 1991; Wetz et al., 2006), such as the Barra Grande Estuary (Leles et al., 2014).
2 MATERIAL AND METHODS
2.1 Study area
Ilha Grande is an island situated off the southern coast of the state of Rio de Janeiro (23°04′34″–23°13′42″S, 44°05′30″–44°22′40″W), among Ilha Grande Bay, Sepetiba Bay and the Atlantic Ocean (Figure 1c). The island is included in the protected area Área de Proteção Ambiental ( APA)-Tamoios (Decree no. 44.175/13, 25 April 2013) with an area of 190 km2, in a region that is one of the largest remnants of the Atlantic Forest. The mean annual precipitation and air temperature of Ilha Grande are 2,000 mm and 23.2°C, respectively (in Bergallo, Bergallo, Rocha, & Rocha, 2016).

Barra Grande Estuary faces the Atlantic Ocean, and is dominated by semi-diurnal tides with well-defined flood and ebb cycles. Due to its shallow depths (~3 m), light penetration in the estuary extends throughout the water column (Leles et al., 2014). According to the Stratification-Circulation Diagram of Hansen and Rattray (1966), the Barra Grande Estuary is classified as Type 2 (Leles et al., 2014), that is, highly stratified, and the resulting flow reverses with depth and both advective and dispersive processes are considered important to the transport of salt into the estuary. Due to the intrinsic characteristics of the Barra Grande Estuary [i.e. shallow depths (maximum 3 m), and small dimensions (average length and width of 80 and 10 m, respectively)], a single riverine input and relative low anthropogenic pressure, this system resembles a classic estuary as defined by Pritchard (1956), and so its investigation can closely approximate a mesocosm study.
2.2 Sampling
Sampling was conducted at a mooring station (23°11′S, 44°12′W) near the mouth of the Barra Grande Estuary (Figure 1d and e) during field campaigns in 2012: March (austral summer, wet season), June (austral fall, dry season), August (austral winter, dry season) and December (austral spring, wet season). Sampling was always conducted during spring tide and comprised two complete tidal cycles (25 hr), except in March, when sampling was restricted to one tidal cycle (13 hr). Time periods for sampling for the respective campaigns were: 09:15 hr on 9 March (T0) to 22:15 hr on 10 March (T13); 15:00 hr on 4 June (T0) to 16:00 hr on 5 June (T25); 21:30 hr on 30 August (T0) to 22:30 hr on 1 September (T25); and 15:00 hr on 10 December (T0) to 16:00 hr on 11 December (T25). Tidal highs and amplitude were monitored using a tidal gauge positioned near the sampling station and water transparency was estimated by Secchi depth. Vertical profiles of temperature and salinity were obtained in 1-hr intervals using a conductivity, temperature, depth (CTD) profiler (Seabird [SBE], model 19 plus V2 SEACAT; frequency 4 Hz) while current velocities and direction were obtained using a moored acoustic doppler current profiler (ADCP- Aquadopp high resolution Nortek S.A.; frequency 2 MHz) positioned close to the sampling station. Physical data were analysed using MATLAB software (R2008a).
Water samples for chemical (dissolved oxygen, pH, phosphate, nitrate, nitrite and ammonium) and biological (pico-, nano- and microphytoplankton) analyses were collected using a Van Dorn bottle (5 L) at two depths, near the surface (~0.5 m) and close to the bottom (~2.5 m), at 1-h intervals during the first campaign (March 2012) and every 2 hr during the other campaigns. Dissolved oxygen and water pH were determined in situ using a multiparameter sensor (Thermo Scientific ORION STAR WTW OXI 33OI/SET for pH, and WTW OXI 33OI/SET for dissolved oxygen). Nutrient samples were filtered onto GF/F glass fiber filters (0.7 μm nominal porosity) immediately, kept in flasks (500 ml) and frozen (−20°C) until analyses were carried out by spectrophotometric methods (Koroleff, 1983) for determining phosphate, nitrate, nitrite and ammonium concentrations. Water sub-samples for analysis of pico- (1–2 μm) and nano- (2–6 μm) phytoplankton were stored in Eppendorf tubes (1 ml; four replicates in total), preserved with 4% glutaraldehyde and kept in liquid nitrogen until analysis by flow cytometry. Water samples for analysis of larger phytoplanktonic cells (including nano- 6–20 μm and micro- 20–200 μm) were stored in flasks (250 ml), preserved with 2% Lugol (neutral solution) and kept in the dark to preserve algal pigments until analysis.
2.3 Phytoplankton abundance and trait assessment
A standard FACSCalibur™ (Becton Dickinson-BD, USA) flow cytometer was used to measure pico- (1–2 μm) and nano- (2–6 μm) phytoplankton cells. As particles intercept the argon-ion laser (15 mW, 488 nm) in the flow cell, scattered and fluorescent light provide information about particle size, shape, granularity, and fluorescence intensity. Forward scatter (FSC) signal is collected by the FSC diode. Side scatter and fluorescent signals are collected by a fluorescence collection lens and spectrally split by a collection of dichroic mirrors and filters. Before analysis, the equipment was calibrated by counting Synechococcus cells (strain SEP-01; Laboratorio de Ecologia e Cultivo do Fitoplancton Marinho LabCult Universidade do Estado do Rio de Janeiro [UERJ]), which was also done under epifluorescence microscopy. During analysis, 20 μl of microspheres of 2, 4 and 6 μm were added to samples and homogenized with a vortex mixer at 2,000 rpm.
Enumeration of larger phytoplankton cells (6–200 μm) was conducted using an inverted microscope (Nikon Eclipse TS 100) at 400× magnification after settling the sample using 5-ml sedimentation chambers according to Utermohl (1958). In total, 400 cells were counted. Species identification was guided by the works of Cupp (1943), Round et al. (1990), Tomas (1997), Zingone, Percopo, Sims, and Sarno (2005), Sarno, Kooistra, Medlin, Percopo, and Zingone (2005) and Sarno, Kooistra, Hargraves, and Zingone (2007).
As a function of their occurrence in the samples, taxa were classified as sporadic (if present in 10%–50% of samples), frequent (if present in more than 50% and less than 80% of samples) or constant (if present in more than 80% of the samples). As a result of their densities taxa were classified as abundant (if the number of cells of a taxon in a sample exceeded the mean density of this taxon in the data set) and dominant (if the density exceeded 50% of the mean density of a taxon in the data set) (Lobo & Leighton, 1986).
In order to assess how functional trait composition varied among species assemblages over time we selected traits of the frequent and abundant taxa by considering those proposed in Litchman et al. (2010), as well as those determined through microscopic observations or obtained by consulting the literature. The functional traits used to evaluate the functional diversity (FD) index of the community (Petchey & Gaston, 2006, 2007) were: (i) morphological traits, represented by maximum axial linear dimension (GALD), obtained by measuring 10 cells of each frequent and abundant taxon, according to the Litchman et al. (2010) classification of GALD as <35 μm- vulnerable to predators and >35 μm less vulnerable to predadors. In addition to this morphological trait, which was considered a master trait, other morphological traits were determined from microscopic analyses including the presence of large vacuoles and coloniality (filaments and chains); (ii) physiological traits, represented by potential toxicity and harmful algal bloom (HAB) formation capacity, evaluated using the literature (Moestrup et al., 2009); (iii) behavioral traits, represented by motility, determined from the presence of flagella as observed during microscopic analyses and from the literature (Tomas, 1997); and (iv) life cycle traits, represented by resting stages, evaluated using the literature (Imai & Yamaguchi, 2012; Patil & Anil, 2008; Tomas, 1997).
2.4 Statistical analysis
Four matrixes were prepared for statistical analysis: (i) general data matrix – composed of 103 observations and 16 variables (salinity, temperature, dissolved oxygen, silicate, chlorophyll-a, nitrate, nitrite, ammonium, phosphate, silicate, autotrophic picoplankton, autotrophic nanoplankton, diatoms, dinoflagellates, other flagellates and cyanobacteria); (ii) environmental matrix – composed of 103 observations and 10 variables (Table 1) (salinity, temperature, dissolved oxygen, silicate, chlorophyll-a, nitrate, nitrite, ammonium, phosphate and silicate); (iii) biological matrix – composed of 103 observations and 37 species considered frequent and abundant (Table 2); and (iv) trait matrix – where morphological (GALD, large vacuoles and coloniality), physiological (potential toxicity and HAB form), behavioral (motility) and life-history (resting stages) traits were presented as presence/absence data, along with occurrence time, for the 37 species (Table 3).
| Median | Minimum–Maximum | |||
|---|---|---|---|---|
| Surface | Bottom | Surface | Bottom | |
| Dissolved oxygen (mg/L) | ||||
| Summer | 6.77 | 5.80 | 5.85–8.06 | 4.40–7.50 |
| Fall | 7.71 | 6.34 | 5.49–8.40 | 5.10–7.97 |
| Winter | 4.02 | 3.69 | 3.09–5.98 | 3.09–5.93 |
| Spring | 4.58 | 4.71 | 4.16–7.02 | 4.15–7.16 |
| Salinity | ||||
| Summer | 12.14 | 27.01 | 7.17–27.15 | 9.33–32.40 |
| Fall | 7.90 | 27.70 | 3.30–21.60 | 9.00–32.00 |
| Winter | 1.80 | 16.20 | 1.10–22.90 | 1.90–23.80 |
| Spring | 9.00 | 24.20 | 6.00–24.90 | 9.10–31.40 |
| Temperature (°C) | ||||
| Summer | 25.47 | 23.77 | 21.69–26.50 | 21.70–26.18 |
| Fall | 22.63 | 23.19 | 21.35–24.75 | 23.03–25.00 |
| Winter | 20.52 | 22.12 | 18.38–22.25 | 21.98–22.74 |
| Spring | 24.48 | 22.53 | 21.30–27–19 | 21.58–24.60 |
| Ammonia nitrogen (μmol/L) | ||||
| Summer | 3.11 | 1.99 | 1.04–6.54 | 1.00–9.08 |
| Fall | 2.43 | 2.32 | 1.36–4–48 | 1.32–6.31 |
| Winter | 0.50 | <LD | 0.21–0.59 | <LD |
| Spring | 1.41 | 1.33 | 0.53–2.70 | 0.58–3.53 |
| Nitrite (μmol/L) | ||||
| Summer | 0.08 | 0.12 | 0.05–0.23 | 0.06–0.26 |
| Fall | 0.10 | 0.14 | 0.05–0.27 | 0.06–0.27 |
| Winter | 0.10 | 0.17 | 0.05–.031 | 0.05–0.27 |
| Spring | 0.09 | 0.08 | 0.05–0.17 | 0.05–0.29 |
| Nitrate (μmol/L) | ||||
| Summer | 6.47 | 2.01 | 1.90–10.38 | 0.50–29.45 |
| Fall | 6.15 | 2.80 | 1.01–11.76 | 1.02–6.97 |
| Winter | 6.30 | 3.02 | 0.55–9.10 | 0.67–6.61 |
| Spring | 7.02 | 3.90 | 2.49–13.36 | 2.00–14.56 |
| Phosphate (μmol/L) | ||||
| Summer | 0.10 | 0.12 | 0.05–0.44 | 0.05–0.65 |
| Fall | 0.09 | 0.20 | 0.05–0.20 | 0.08–1.05 |
| Winter | 0.09 | 0.14 | 0.05–0.25 | 0.06–0.27 |
| Spring | 0.12 | 0.17 | 0.05–0.56 | 0.05–0.68 |
| Reactive silica (μmol/L) | ||||
| Summer | 90.25 | 49.48 | 35.21–186.25 | 11.06–368.56 |
| Fall | 53.74 | 39.25 | 17.06–157.71 | 10.75–92.29 |
| Winter | 105.14 | 79.51 | 19.13–309.18 | 19.51–309.18 |
| Spring | 131.34 | 69.52 | 14.16–166.45 | 15.18–139.67 |
| Chlorophyll a (μg/L) | ||||
| Summer | 1.62 | 4.15 | 0.00–6.33 | 0.00–30.36 |
| Fall | 0.78 | 1.80 | 0.16–4.94 | 0.31–7.04 |
| Winter | 1.08 | 8.70 | 0.21–12.18 | 0.65–17.84 |
| Spring | 5.56 | 4.90 | 0.03–8.32 | 0.40–14.66 |
| Organisms | ID | Summer | Fall | Winter | Spring |
|---|---|---|---|---|---|
| Diatoms | |||||
| Cocconeis sp. | Coc. | X | X | ||
| Cylindrotheca closterium | Cyl. Clos. | X | X | X | X |
| Cymbella | Cymb. | X | X | ||
| Pleurosigma | Pleur. | X | X | X | |
| Pseudo-nitzscha | Pse.ser. | X | X | X | X |
| Seriata complex | |||||
| Dactyliosolen fragillisimus | Dae. | X | |||
| Diploneis spp. | Dip. | X | X | X | X |
| Fragilariopsis sp. | Frag. | X | X | X | |
| Frustulia sp. | Frus. | X | |||
| Gomphonema spp. | Gomp. | X | |||
| Guinardia cf. flaccida | Gui.flac. | X | |||
| Guinardia delicatula | Gui.de I. | X | |||
| Guinardia sp. | Gui.spl | X | X | X | X |
| Guinardia striata | Gui.str. | X | |||
| Leptocylindrus cf. danicus | Lep.dan. | X | |||
| Leptocylindrus cf. minimus | Lep.min. | X | |||
| Leptocylindrus sp. | Lep. | X | X | X | |
| Licmophora sp. | Lie. | X | X | X | X |
| Manguinea sp. | Mang. | X | X | X | X |
| Navicula sp. | Nav.spl | X | X | X | |
| Nitzschia sp. | Nitz.spl | X | X | X | |
| Pseudo-nitzscha sp. | Pseudo.sp | X | X | ||
| Skeletonema cf. costatum | She. | X | |||
| Thalassionema nitzschioides | Thaln. | X | X | X | |
| Dinoflagellates | |||||
| cf. Alexandrium sp. | Alex. | X | X | X | |
| cf. Heterocapsa spp. | Heter. | X | X | X | X |
| Gymnodinium sp. | Gymn. | X | X | X | |
| Gyrodinium sp. | Gyro. | X | X | X | X |
| Prorocentrum micans | Pror.mic. | X | X | X | X |
| Prorocentrum spp. | Pror. | X | X | X | X |
| Protoperidinium sp. | Prot. | X | X | X | X |
| Protoperidinium steinii | Prot.stei. | X | X | X | X |
| Scrippsiella sp. | Scripp. | X | X | X | |
| Chlorophyta | |||||
| Monoraphidium spp. | Mono. | X | X | X | |
| Raphidophyta | |||||
| Chatonella sp. | Chat. | X | X | X | |
| Cyanobacteria | |||||
| Cyanobacteria filaments | Cian.fil. | X | X | ||
| Euglenophyta | |||||
| Euglena sp. | Eug. | X | X | X | X |
| Organisms | Habitat | Functional traits | |||||||
|---|---|---|---|---|---|---|---|---|---|
| Coloniality | Potential toxicity | GALD | Large vacuoles | Flagella | Mixotrophy | Resting stages | HAB forms | ||
| Diatoms | |||||||||
| Cocconeis sp. | Marine | 0 | 0 | 1 | 0 | 0 | 0 | 0 | 0 |
| Cylindrotheca closterium | Marine | 0 | 0 | 1 | 1 | 0 | 0 | 0 | 1 |
| Cymbella | Brackish water | 0 | 0 | 1 | 1 | 0 | 0 | 0 | 0 |
| Pleurosigma | Marine | 0 | 0 | 1 | 1 | 0 | 0 | 0 | 0 |
| Pseudo-nitzscha seriata complex | Marine | 1 | 1 | 1 | 0 | 0 | 0 | 1 | 1 |
| Dactyliosolen fragillisimus | Marine | 1 | 0 | 1 | 0 | 0 | 0 | 0 | 1 |
| Diploneis spp. | Marine | 0 | 0 | 0 | 1 | 0 | 0 | 0 | 0 |
| Fragilariopsis sp. | Marine | 1 | 0 | 1 | 0 | 0 | 0 | 1 | 0 |
| Frustulia sp. | Freshwater | 0 | 0 | 1 | 1 | 0 | 0 | 0 | 0 |
| Gomphonema spp. | Marine | 0 | 0 | 1 | 0 | 0 | 0 | 0 | 0 |
| Guinardia cf. flaccida | Marine | 1 | 0 | 1 | 0 | 0 | 0 | 1 | 1 |
| Guinardia delicatula | Marine | 1 | 0 | 1 | 0 | 0 | 0 | 1 | 1 |
| Guinardia sp. | Marine | 1 | 0 | 1 | 0 | 0 | 0 | 1 | 1 |
| Guinardia striata | Marine | 1 | 0 | 1 | 0 | 0 | 0 | 1 | 1 |
| Leptocylindrus cf. danicus | Marine | 1 | 0 | 1 | 0 | 0 | 0 | 1 | 1 |
| Leptocylindrus cf. minimus | Marine | 1 | 0 | 1 | 0 | 0 | 0 | 1 | 1 |
| Leptocylindrus sp. | Marine | 1 | 0 | 1 | 0 | 0 | 0 | 1 | 1 |
| Licmophora sp. | Marine | 0 | 0 | 1 | 1 | 0 | 0 | 0 | 0 |
| Manguinea sp. | Marine | 0 | 0 | 1 | 1 | 0 | 0 | 0 | 0 |
| Navicula sp. | Marine | 0 | 0 | 0 | 1 | 0 | 0 | 0 | 0 |
| Nitzschia sp. | Marine | 0 | 0 | 1 | 1 | 0 | 0 | 0 | 0 |
| Pseudo-nitzscha sp. | Marine | 0 | 0 | 1 | 1 | 0 | 0 | 1 | 1 |
| Skeletonema sp. | Marine | 1 | 0 | 1 | 0 | 0 | 0 | 1 | 1 |
| Thalassionema nitzschioides | Marine | 1 | 0 | 1 | 0 | 0 | 0 | 0 | 1 |
| Dinoflagellates | |||||||||
| cf. Alexandrium sp. | Marine | 0 | 1 | 0 | 0 | 1 | 1 | 1 | 1 |
| cf. Heterocapsa spp. | Marine | 0 | 0 | 0 | 0 | 1 | 1 | 1 | 1 |
| Gymnodinium sp. | Marine | 0 | 1 | 0 | 0 | 1 | 1 | 1 | 1 |
| Gyrodinium sp. | Marine | 0 | 0 | 1 | 0 | 1 | 1 | 1 | 0 |
| Prorocentrum micans | Marine | 0 | 0 | 1 | 0 | 1 | 1 | 0 | 1 |
| Prorocentrum spp. | Marine | 0 | 0 | 1 | 0 | 1 | 1 | 0 | 1 |
| Protoperidinium sp. | Marine | 0 | 0 | 0 | 0 | 1 | 0 | 1 | 0 |
| Protoperidinium steinii | Marine | 0 | 0 | 0 | 0 | 1 | 0 | 1 | 0 |
| Scrippsiella sp. | Marine | 0 | 0 | 0 | 0 | 1 | 0 | 1 | 1 |
| Chlorophyta | |||||||||
| Monoraphidium spp. | Freshwater | 0 | 0 | 1 | 0 | 0 | 0 | 0 | 0 |
| Raphidophyta | |||||||||
| Chatonella sp. | Marine | 0 | 1 | 1 | 0 | 1 | 0 | 1 | 1 |
| Cyanobacteria | |||||||||
| Cyanobacteria filaments | Marine | 1 | 0 | 1 | 0 | 0 | 0 | 0 | 1 |
| Euglenophyta | |||||||||
| Euglena sp. | Freshwater | 0 | 0 | 0 | 0 | 1 | 0 | 0 | 0 |
- GALD; HAB = harmful algal bloom.
Correlations among environmental and biological variables were tested by applying Spearman correlation tests to the general data matrix. The non-parametric Kruskal–Wallis test followed by the median test were applied to the environmental matrix variables in order to test significant differences between surface and bottom levels of the water column and between ebb and flood tides.
To analyse the environmental variables that influence the spatial and temporal distribution of abundant and frequent species a canonical correlation analysis was performed. The data set included the environmental and biological matrices and was normalized by logarithmization [log (x + 1)]. All of the above-described statistical tests were performed using PAST software (Windows version).
For the traits matrix, a cluster analysis combining Euclidean distance and the Ward method was applied to the quantitative data. Choice of cluster method is a crucial decision in calculating the FD of species (Mouchet et al., 2008; Petchey & Gaston, 2006). FD is defined as ‘the value and range of those species and organismal traits that influence ecosystem functioning’ (Tilman, 2001). The appropriate cluster analyses can be chosen by applying the co-phenetic correlation function (Podani, 2000; Sneath & Sokal, 1973), which measures how the original dissimilarity structure is preserved by the dendrogram (Blackburn, Petchey, Cassey, & Gaston, 2005). We tested two distinct methods, Gower distance combined with unweighted pair group method with arithmetic mean and Euclidean distance combined with Ward's method; the former had a better co-phenetic correlation (0.78).
The FD of the formed assemblages was calculated as proposed by Petchey and Gaston (2006, 2007), using the total branch length required to connect all species to each other across the dendrogram. A higher FD score indicates a greater variety of habitat uses (Petchey & Gaston, 2006) and a more resilient community. After cluster analyses, the individualized assemblages were compared to results from a canonical correlation analysis (CCA), in order to verify consistency with environmental variables and temporal distribution. CCA was performed using the software PAST. To process the clustering and FD analyses (Petchey & Gaston, 2006, 2007) we used R studio (RStudio Team, 2017), with the packages picante and ade4, and their libraries (Dray & Dufour, 2007; Kembel et al., 2010).
3 RESULTS
3.1 Hydrographic characterization
The tidal highs in the Barra Grande Estuary for the year of 2012 varied from 0 to 1 m (Figure 2), but differences were observed among the four sampling campaigns; the maximum tidal high (1 m) was observed during austral summer (March), with similar values being observed during fall and spring (0.6 and 0.7 m, respectively), and no tidal influence was detected during winter (August) due to the formation of a exposed sandbar near the entrance of the estuary closing its connection with the ocean.
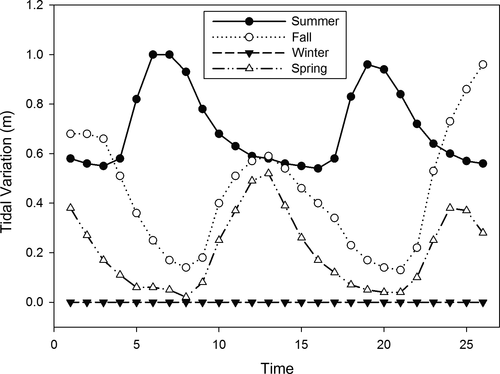
Median values of temperature and salinity varied throughout the year (Table 1). Median temperature varied from 18.4 to 27.7°C and was maximal during summer, decreased during fall, reached minimal values during winter and increased again during spring (Table 1). A similar pattern was observed for depth-integrated salinity (Table 1), for which minimal values were observed during the winter due to the lack of connectivity between the estuary and the ocean. The Secchi depth readings ranged from 1.4 to 3 m (Figure 2); however, most of the time light penetrated to the bottom of the estuary.
3.1.1 Chemical characterization
Median values of dissolved oxygen (DO) of the Barra Grande Estuary varied from 3.7 to 7.7 mg/L during the sampling period, with higher values during summer and fall (Figure 3), when tidal amplitude was greater. Higher DO concentrations were observed in surface waters while the lowest values were observed close to the bottom with the sand bar closing off the estuary from the ocean during winter (Table 1).
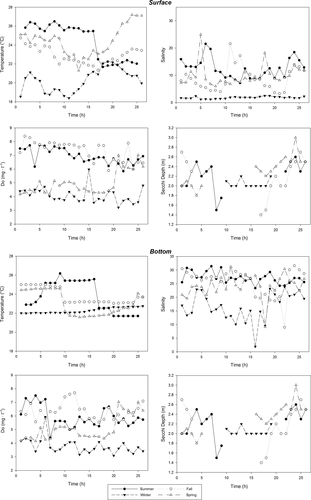
The average concentration of dissolved inorganic nutrients within the water column did not differ between ebb and flood tides for any of the four sampling campaigns, but differences were found between seasons (p < .05; Table 1). The concentration of dissolved inorganic nutrients varied within the water column during summer (except for phosphate), winter and spring, but significant differences during these periods of the year were only observed for nitrate, which was higher at the surface (surface concentrations varied from 6.15 to 7.02 μmol/L, while bottom concentrations varied from 2.01 to 3.02 μmol/L; Table 1). Phosphate concentration was higher near the bottom (0.14–0.20 μmol/L when compared to the surface; 0.09–0.12 μmol/L during fall and spring, p < .05).During the summer campaign nitrate, ammonium and silicates varied significantly (p < .05) between the two depths (Table 1), and similar significant variation was observed for nitrate for the winter and spring campaigns. Distinct significant variation between depths was also observed for phosphate concentration during fall and spring, with it being higher at the bottom.
3.2 Chlorophyll-a
Median values for chlorophyll-a concentration in the Barra Grande Estuary varied from 0.8 to 8.7 μg/L throughout the year. Chlorophyll-a peaks were observed during winter (median value 8.7 μg/L at the bottom; Table 1), with decreased levels in spring (5.6 μg/L near the surface; Table 1), and minimal levels during summer (1.6 μg/L near the surface; Table 1) and fall (0.68 μg/L near the surface; Table 1). Following the pattern observed for dissolved inorganic nutrients, chlorophyll-a concentration did not differ significantly between tidal cycles (Kruskal–Wallis test; p > .05). Chlorophyll-a concentration varied between depths during summer, fall and winter campaigns (median test; p < .05), with higher values at the bottom (Table 1). No vertical differences were found during spring.
3.2.1 Phytoplankton community
Numeric abundance
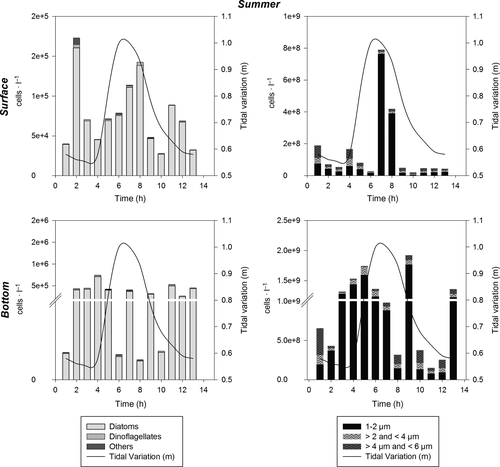
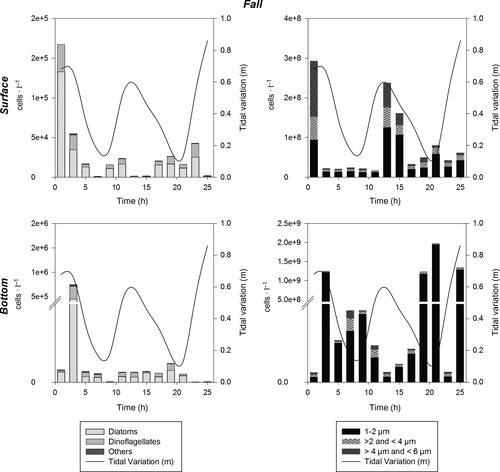
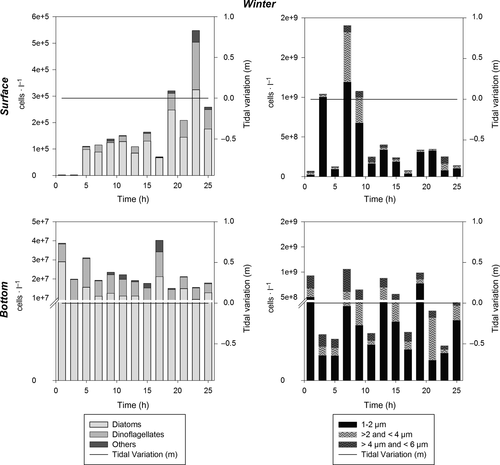
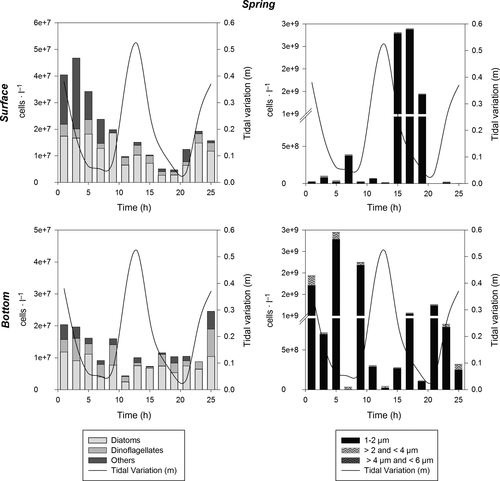
The abundance of phytoplankton throughout the water column varied from 104 to 107 cells/L, considering larger cells (6–200 μm), during the period of the study. Pico- (1–2 μm) and nanoplankton (>2–6 μm) together varied from 108 to 109 cells/L, and thus contributed more to total phytoplankton abundance than microplankton (Figures 4-7). In general, higher phytoplankton abundance was observed at the bottom than near the surface (Figures 4-7). The total numeric abundance of phytoplankton varied throughout the year (Kruskal–Wallis and median test; p < .05); maximum abundance was observed during spring, with 5 × 10⁷ cells/L near the surface (Figure 7), and winter, with 4.7 × 10⁷ cells/L at the bottom (Figure 6). Seasonal variation was more pronounced for picophytoplanktonic cells (1–2 μm) and for diatoms and dinoflagellates in the size range 6–200 μm (Figures 4-7). The abundance of phytoplanktonic cells did not vary between tidal cycles (i.e. ebb versus flood tide) or between diel cycles (i.e. day versus night), Kruskal–Wallis and median test p > .05. However, pico- and nanoplankton abundance increased during tidal maximum variance (Figures 4, 5 and 7), except during winter, when the tidal effects were null because of the closure of the connectivity between the estuary and the ocean.
Phytoplankton composition and functional diversity
A core phytoplankton community, composed mainly of flagellates, individualized as an assemblage, was observed by the functional diversity dendrogram (FD = 44; Group 2; Figure 8), and occurred in all surveys in spite of differences in densities and contributions. This core community was composed of the dinoflagellates Heterocapsa, Gyrodinium, Prorocentrum micans and other Prorocentrum species, Protoperidinium steinii and euglenophyceans (all with GALD < 35 μm – Table 3) as well as by tycopelagic diatoms, including Diploneis, Licmophora and Manguinea.
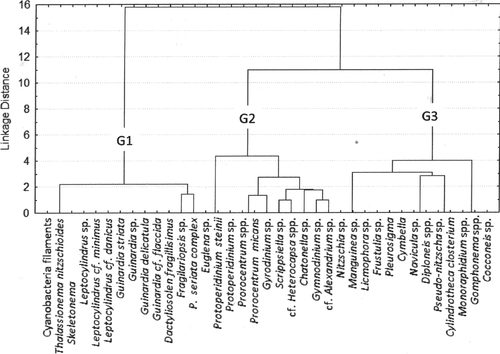
Cyanobacteria filaments occurred only in the summer and spring surveys. Chain-forming diatoms (e.g. Thalassiosira spp., Leptocylindrus spp. and Guinardia spp.) outnumbered filaments of cyanobacteria during the summer period, and were individualized as an assemblage by the functional diversity dendrogram (FD = 25, Group 1; Figure 8), reaching densities higher than 106 cells/L at the bottom.
Pennate diatoms, among a variety of groups of microphytoplankton, dominated the system in terms of cell number during spring (FD = 39, Group 3; Table 3); however, the abundance of dinoflagellates and phytoflagellates (e.g. raphydophyceans, chlorophyceans and silicoflagellates) increased during fall and winter (Table 2). Phytoplankton densities similar to those observed during the spring survey were also observed during the winter campaign at the bottom, reaching values of 107 cells/L (Figure 6).
During winter, a characteristic riverine-estuarine community was present. Higher contribution of dinoflagellates, chlorophyceans (as Monoraphidium) and raphidophyceans (Chattonella) (see Table 2) occurred mainly in surface waters, as well as riverine taxa, such as Frustulia sp.
Factor 1 (36%) of the CCAs applied to the environmental and biological matrixes represented phytoplanktonic groups with regard to the gradient of tidal influence over a seasonal cycle (Figure 9). The negative portion of Factor 1 is represented by the observations made during the summer and spring surveys, when maximum tidal amplitude occurred, associated with the vectors: tidal high, temperature, ammonium, dissolved oxygen and salinity as well as the taxa Leptocylindrus danicus, Guinardia flaccida, Dactyliosolen fragilissimus, Skeletonema sp., all of them centric diatoms forming chains (cluster group 1, FD = 25). The positive portion of Factor 1 is represented by the observations made during the winter survey, with no tidal influence, as well as by the estuarine river zone taxa (Cymbella, Monoraphidium, Frustulia sp.; cluster group 3, FD = 39).
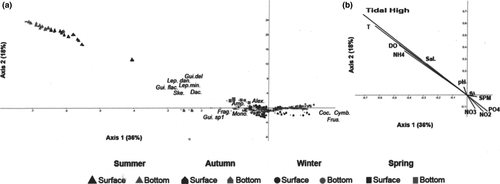
Factor 2 (18%), represented by the salinity vector in its positive portion, grouped observations according to their sampling position in the water column (surface or bottom). Spring and fall observations were plotted in the center of the factorial plane, with low influence on the total environmental explanation.
4 DISCUSSION
As expected for coastal systems, pico- and nanophytoplankton were found to contribute more to the total phytoplankton abundance in the Barra Grande Estuary than microphytoplankton (Murrel, 2004; Tremblay, Legendre, & Therriault, 1997; Vargas et al., 2007). Phytoplankton abundance was inversely related to tidal currents, or, in other words, higher abundance was observed when current speeds were lower during both flood and ebb tides. Such a pattern can be explained by both physical forces, tidal current variation and transport related factors, and by the rapid growth rates of phytoplankton. The surface layer was highly dynamic due to faster tidal currents, resulting in the transport of small phytoplankton cells towards the continental shelf. To the contrary, lower tidal currents were observed near the bottom, which are expected to decrease the transport of cells out of the estuary and increase the concentration of phytoplankton cells near the bottom, where fast phytoplankton growth rates may favor the development of small phytoplankton. In addition, the topography of the Barra Grande Estuary is deeper at the sampling station relative to adjacent areas, thus facilitating even more aggregation of phytoplankton cells near the bottom.
Corroborating the findings of Leles et al. (2014), we found that the Barra Grande Estuary possesses low turbidity, and is highly stratified with the resulting flow reversing with depth. The high silicate concentrations observed in this system contrast with the intermediate concentrations of nitrate and ammonium (mesotrophic system without direct anthropogenic impact according to Leles et al., 2014). In stratified estuaries with favorable light penetration, such as the Barra Grande Estuary, phytoplankton can use most of the available nutrients (Malone et al., 1996; Pennock & Sharp, 1994). High silicate concentrations support the development of diatoms in the system, which co-exist with dinoflagellates. However, cell size (GALD) and the ability to form colonies (coloniality) are limited by the type and concentration of inorganic nitrogen in the water (Glibert et al., 2016; Litchman, Klausmeier, & Yoshiyama, 2009).
Although most of the species of phytoplankton found are classified as ruderals or stress tolerants, according to the literature (Reynolds, 1988), when considering their morphological traits (described by Litchman et al., 2010 as a ‘Master Trade’) diverse ecological functionality leading to distinct habitat use can be observed. The functional structure of the phytoplankton community of the Barra Grande Estuary, measured by FD, varied seasonally in and across a gradient of tidal energy; no significant variation was attributed to short-term tidal current variation but the community changed when considering the tidal influence denoted by maximum tidal highs in summer and spring and no tidal influence during winter. The chain-forming diatoms were associated with high tidal energy, and occurred in higher densities during summer; in fact, turbulence in nutrient-rich environments favors these organisms as pointed by Margalef (Margalef, 1978).
Chain-forming diatoms and cyanobacteria, including both filamentous cyanobacteria and pico-cyanobacteria (Synechococcus), constituted a significant part of the summer assemblage, as observed in others estuarine systems (Bosak et al., 2012; Phillips, Bender, & Thornton, 1999), and Synechococcus was favored by high tidal energy and temperature in the summer. Temperature is a major environmental variable that governs, to some extent, the distribution of all organisms on Earth (Litchman et al., 2010), and cyanobacteria tend to have higher optimum temperatures for growth, with the majority of measured species exhibiting optima between 25 and 35°C (Robarts & Zohary, 1987).
According to Litchman and Klausmeier (2008), phytoplankton cell size, cell shape, and the ability to form colonies are extremely plastic traits that can be regulated by the environment, such as irradiance level, nutrient availability, turbulence, and predation pressure (Geider, Platt, & Raven, 1986; Klais, Norros, Lehtinen, Tamminen, & Olli, 2016; Litchman et al., 2010). It is expected that more plastic genera will be able to exploit a wider range of environments. Thus, species able to form colonies (i.e. diatoms and filamentous cyanobacteria) were expected to be found throughout the year in the Barra Grande Estuary, and in a range of different environmental conditions; however, isolated tychopelagic diatoms were present in the study area across all seasons, with higher contributions in fall and winter, reflecting the shallow characteristic of this system. By contrast, the presence of large vacuoles in larger diatoms (GALD > 35 μm) increased their plasticity relative to nitrogen uptake, allowing them to modify their internal nitrogen quotas according to the external nutrient source (nitrate or ammonium; Thingstad, Øvreas, Egge, Løvdal, & Heldal, 2005; Litchman et al., 2009), as occurred during the fall, winter and spring campaigns. The opposite was found during the summer campaign, when ammonium was present at high concentrations and chain-forming diatoms with small vacuoles were abundant in the system.
Tidal current variation and asymmetry between ebb and flood tides, with a longer ebb period, as well as higher current velocities in surface waters (Leles et al., 2014), indicate that river discharge plays an important role in the dynamics of the Barra Grande Estuary. During the winter, the lack of connection with the ocean resulted in an abundance of riverine and brackish water taxa. Monoraphidium and Cymbella are generally observed in low salinity waters, but they are euryhaline taxa (Hällfors, 2004). Frustulia, also present in the same conditions, is stenohaline (Caljon, 2012). Frustulia and Cymbella are both tycopelagic pennate diatoms occurring in surface waters and in the inner portions of the Barra Grande Estuary (data not presented).
Together with the tycopelagic diatoms that were present in all seasons, but in greater abundance during the fall and winter campaigns, a core community mainly represented by flagellates and dinoflagellates occurred in all observations and was highly functional (high FD), exploiting a variety of habitats (Litchman et al., 2010). Motility is a key trait in this group, preventing sinking and helping these organisms to exploit distinct niches in the water column (Cullen & MacIntyre, 1998). In fact, dinoflagellates can exploit a variety of environments. Their diverse habitat use is discussed in Smayda and Reynolds (2001), and Type I and II dinoflagellates (gymnodinioids, peridinians/prorocentroids) were well represented in the Barra Grande Estuary, with Type II forms prevailing. The intermediate-sized peridinians, such as Heterocapsa spp. and Scrippsiella trochoidea, as well as the prorocentroids, are favored in mesotrophic habitats (Smayda & Reynolds, 2001).
Although dinoflagellates occurred in all our observations throughout the entire year, harmful algae taxa occurred in low densities. Peridinians and prorocentroids prevailed in the system, while the densities of species of Alexandrium were as low as 102 cells/L. Generally, harmful algae are related to eutrophication (Pinckney, Paerl, Tester, & Richardson, 2001), but the Barra Grande Estuary is a near-pristine ecosystem, and the concentrations of dissolved inorganic nutrients found are characteristic of a mesotrophic system. Furthermore the densities and occurrences of HAB phytoplankton are low, but studies concerning these organisms over longer time series are encouraged.
5 CONCLUSIONS
The information provided by this study regarding phytoplankton functional diversity and its relation to nutrients and hydrography in the Barra Grande Estuary can be applied as a baseline model for the development of public policies. This is particularly true because trait-based analyses add information about community structure, which can be impacted by anthropogenic actions, such as effluent discharge and sediment from dredging, common activities in urbanized coastal systems. Analysing phytoplankton data by this trait-based approach, in addition to classic methods, over longer time series could prove to be a powerful prediction instrument.
ACKNOWLEDGEMENTS
The authors would like to thank dr Hélio Heringer Villena and Fundação Carlos Chagas Filho de Amparo à Pesquisa do Estado do Rio de Janeiro, Grant/Award Number: e-26/111.651/2011.


