Oceanographic influences on the distribution and relative abundance of market squid paralarvae (Doryteuthis opalescens) off the Southern and Central California coast
Abstract
Market squid (Doryteuthis opalescens) are ecologically and economically important to the California Current Ecosystem, but populations undergo dramatic fluctuations that greatly affect food web dynamics and fishing communities. These population fluctuations are broadly attributed to 5–7-years trends that can affect the oceanography across 1,000 km areas; however, monthly patterns over kilometer scales remain elusive. To investigate the population dynamics of market squid, we analysed the density and distribution of paralarvae in coastal waters from San Diego to Half Moon Bay, California, from 2011 to 2016. Warming local ocean conditions and a strong El Niño event drove a dramatic decline in relative paralarval abundance during the study period. Paralarval abundance was high during cool and productive La Niña conditions from 2011 to 2013, and extraordinarily low during warm and eutrophic El Niño conditions from 2015 to 2016 over the traditional spawning grounds in Southern and Central California. Market squid spawned earlier in the season and shifted northward during the transition from cool to warm ocean conditions. We used a general additive model to assess the variability in paralarval density and found that sea surface temperature (SST), zooplankton displacement volume, the log of surface chlorophyll-a, and spatial and temporal predictor variables explained >40% of the deviance (adjusted r2 of .29). Greatest paralarval densities were associated with cool SST, moderate zooplankton concentrations and low chlorophyll-a concentrations. In this paper we explore yearly and monthly trends in nearshore spawning for an economically important squid species and identify the major environmental influences that control their population variability.
1 INTRODUCTION
The California market squid (Doryteuthis opalescens) is ecologically and economically vital to the California Current Ecosystem (CCE) and fishing communities. Squid are key components in marine ecosystems across the globe and play an instrumental role in transferring energy from lower to higher trophic levels (Coll, Navarro, Olson, & Christensen, 2013). Market squid in the CCE are major predators on Crustacea and fish (Karpov & Cailliet, 1979) and important prey for marine mammals, seabirds, invertebrates and fish (Morejohn, Harvey, & Krashnow, 1979). The fishery for market squid is routinely one of the largest and most valuable in the state of California (Leos, 2014). Market squid disperse over the continental shelf as juveniles and form dense nearshore spawning aggregations when mature, depositing eggs into clusters over shallow, sandy substrate (Navarro et al., 2016; Zeidberg & Hamner, 2002). The commercial fishery generally targets these spawning aggregations during summer in the Monterey Bay region (MBR), and during fall in the Southern California Bight (SCB, Figure 1; Zeidberg, Hamner, Nezlin, & Henry, 2006), although spawning has been observed year round in some instances (Fields, 1950; Jackson & Domeier, 2003; Navarro, 2014). Market squid die within days after spawning (Macewicz, Hunter, Lo, & LaCasella, 2004) and the life cycle is complete within 1 year (Butler, Fuller, & Yaremko, 1999). Market squid populations fluctuate tremendously (Dorval, Crone, & McDaniel, 2013), and warm (El Niño) and cool (La Niña) phases of the El Niño Southern Oscillation (ENSO) are considered to be a major influence (Koslow & Allen, 2011; Reiss, Maxwell, Hunter, & Henry, 2004).
El Niño Southern Oscillation phases affect local conditions in the CCE. El Niño periods are warmer and cause reduced ocean productivity and zooplankton standing stock; La Niña periods are cooler and more productive (Chavez, Pennington, Castro, Ryan, & Michisaki, 2002; Lynn, Schwing, & Hayward, 1995). Squid show extreme life history plasticity and populations are able to expand rapidly during favorable conditions, but also decline in unfavorable environments (Pecl & Jackson, 2007). Commercial landings reflect this life-history trait (Zeidberg et al., 2006). For example, during the historically strong El Niño of 1997 (McPhaden, 1999), yearly landings declined from 80,000 to 3,000 metric tons (MT), before rebounding to 118,000 MT the next year (CDFW, 2005). Fishery independent surveys find similar trends. Reiss et al. (2004) found a contraction of juvenile and adult distribution due to this El Niño and a rapid expansion as cool ocean conditions returned. Zeidberg and Hamner (2002) found paralarval abundance increased from 1.5 to 78 individuals per 1,000 m3 around the Channel Islands in the SCB during the same El Niño, while pelagic surveys in the CCE find decreased paralarval abundance during prolonged warming events (Leising et al., 2014).
Such large-scale population variability has a substantial economic toll on fishing communities. Likewise, these changes in the distribution and abundance of market squid have cascading effects on predators of squid (Shane, 1995). Bottom-up, oceanographic drivers control the population dynamics of many squid species (Perez, de Aguiar, & Oliveira, 2002), but the specific mechanisms that control this population variability, and the fine-scale distributional and spawning effects, are poorly understood, particularly for market squid in the CCE. To address this gap in knowledge, our study expands on previous research (Koslow & Allen, 2011; Zeidberg & Hamner, 2002) and provides novel data and insights by targeting nearshore spawning locations in shallow water at traditional spawning locations, over a wide geographic range across the SCB and the MBR. We sampled for 6 years across all seasons and the full range of ENSO conditions, and conducted repeated surveys within a single spawning season. Our results are therefore meant to provide a relative index of paralarval abundance at the traditional spawning grounds and not a measure of absolute abundance.
The objectives of this study were to (i) determine the relative abundance of market squid paralarvae in order to establish a baseline of population productivity; and (ii) determine the conditions that most greatly influence the variability in paralarval densities. Understanding the dynamics in spawning output and the environmental patterns that drive variability in paralarval density is important to the overall understanding of ecosystem functioning in the CCE and elsewhere, while insight into the fitness of adult spawners under different oceanographic conditions can provide information in assessing the stock of this commercially important species. To address these objectives, we derived the relative paralarval densities of California market squid from oblique bongo net tows at the traditional shallow-water spawning grounds in the SCB and MBR, and used these data to model density as a function of sea surface temperature (SST), zooplankton displacement volume (ZPDV), the log of surface chlorophyll-a (SCHL), and spatial and temporal variables.
2 MATERIAL AND METHODS
2.1 Survey and data
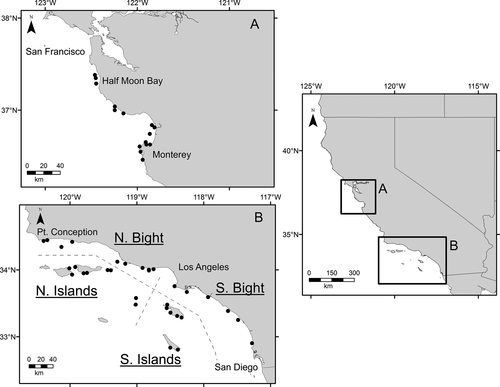
The study area covered a portion of the Southern CCE from San Diego to Half Moon Bay, CA (Figure 1). Twenty-six cruises were conducted during a 6-years period from 2011 to 2016 in five geographic areas. These areas included the north and south bight regions of the SCB, and the North and South Channel Islands (Figure 1b). The North Channel Islands consist of Santa Rosa, Santa Cruz, Anacapa and Santa Barbara Islands. The South Channel Islands consist of Catalina and San Clemente Islands.
Paralarvae were collected during a collaborative research program between the California Wetfish Producers Association, the National Oceanic and Atmospheric Administration's (NOAA) Southwest Fisheries Science Center (SWFSC) and the California Department of Fish and Wildlife (CDFW). Sampling occurred aboard three chartered fishing vessels (each approximately 50 ft in length). The study was conducted in two areas, the SCB and the MBR, and targeted 45 stations. Within each area, stations were sampled at fixed, nearshore, non-random locations, and were systematically assigned to cover the latitudinal gradient along the islands and coastline (Figure 1). These sites were predominately located over sandy substrate in shallow water (~20–130 m), which is a known spawning substrate of market squid. As a result, distance between sites was irregular. San Clemente Island was sampled during the first 2 years of the study, but sampling was suspended because of access restrictions by the United States Navy. Thirty stations were targeted in the SCB and 15 in the MBR. A greater number of stations were selected in the SCB compared to the MBR to reflect the disproportional geographic sizes of these areas. Additionally, ~70% of commercial landings traditionally come from the SCB, while 30% are from the MBR (CDFW, 2005).
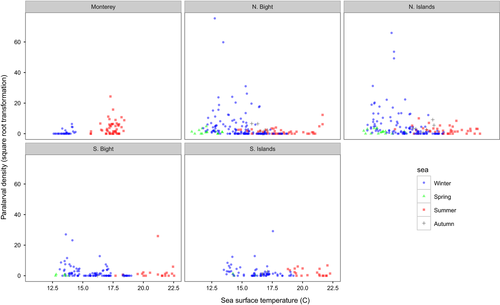
Sampling occurred seasonally during the first 2 years of study (winter, spring, summer, and fall) to mimic sampling patterns conducted in part by the SWFSC's California Cooperative Oceanic Fisheries Investigations (CalCOFI). Based on the findings from the initial 2 years of the study – that the vast majority of paralarvae were encountered during the winter in the SCB, sampling then shifted to target spawning periods when paralarvae were most abundant, while maintaining an “off-season” collection effort to assess the conditions when squid were not prevalent (Figure 2). Beginning in July 2012, one survey (utilizing three chartered vessels) occurred during the summer (July or August) and three surveys occurred during the winter (December, January and February). MBR sampling began in July 2014 and sampling occurred during July or August, and January.
Paralarvae were sampled with a pair of 505-μm nylon mesh bongo nets with mouth diameters of 0.6 m attached to a frame. The net system was towed obliquely at an approximate angle of 45° to a depth of 27 or 55 m during night or day deployments, respectively, unless the station depth was too shallow. Depths were chosen based on previously observed patterns of paralarval nightly vertical migration upward in the water column (Zeidberg & Hamner, 2002). If stations were shallower than 27 m, the net was deployed to approximately three-fourths of the station depth to avoid contact with the sea floor. Average ship speed during deployment was 1.75 knots. Samples were preserved in 50% ethanol aboard vessels. Mechanical or digital flowmeters (Ocean Test Model MF 315 or EF 325, respectively) were attached to each net on the frame and the amount of seawater filtered was calculated using methods established by Ohman and Smith (1995).
Zooplankton displacement volume was measured in the laboratory. This measurement excluded large gelatinous animals, fish, crabs and organisms generally >5 mm in length or >5 ml in volume (Smith & Richardson, 1977). Cephalopod paralarvae were sorted from both port and starboard sides of the net. California market squid paralarvae were identified and enumerated under a dissecting microscope. Densities were estimated as numbers of individuals per 1,000 m3 of seawater sieved by the net tow (Smith & Richardson, 1977).
Paralarval densities were averaged from both sides of the bongo net by summing the volumes and then dividing by the total count of paralarvae. Values were square-root transformed for statistical analyses. Non-parametric, Mann–Whitney U tests were used to compare means of relative abundance. Monthly landings data were obtained from CDFW (https://www.dfg.ca.gov/marine/cpshms/landings.asp) and used to investigate temporal and spatial changes in landings and distribution across major spawning areas. Landings data are reported monthly for Northern and Southern California, corresponding to the MBR and the SCB for paralarval trawl data, respectively.
2.2 Model development
 (1)
(1)where Y is the expected value of the response variable, estimated as the density of market squid paralarvae and g(∙) is the link function defining the non-linear relationship between the density of paralarvae and the selected predictors. Our data displayed a negative binomial distribution; therefore, we used a log link transformation as the link function, g(∙). Finally, fk(∙) is the unique smoothing function assigned to each predictor. We used six predictors to model the abundance of market squid paralarvae: SST (°C), ZPDV (ml/1,000 m3), SCHL (Table 1), month and fishing year interaction effect, and station and region interaction effect. SST was included as a station-specific measurement of the physiological suitability of the habitat. ZPDV and SCHL were used as separate predictors of habitat quality and food availability. Fishing year was included because squid spawning and paralarval abundance vary by year according to oceanographic conditions, ENSO state, adult spawning biomass, and other factors. Month was included to reflect the different spawning seasons between the SCB and MBR. Landings data were not included because the fishery routinely reached or neared the maximum catch limit before the end of most fishing years during the study period (sometimes closing voluntarily, as in 2014), which would have resulted in the negation of substantial paralarval information.
| Fishing season | Ocean state | Average values for fishing season | SCB values for January effort | |||
|---|---|---|---|---|---|---|
| MEI | PDO | SST (°C) | SCHL (mg/m3) | ZPDV (ml/1,000 m3) | ||
| 2010–11 | Cool | −1.17 (±0.97) | −0.69 (±0.73) | 13.4 (±0.58) | 11.6 (±10.8) | 91.9 (±57.1) |
| 2011–12 | Cool | −0.71 (±0.41) | −1.30 (±0.63) | 14.5 (±0.35) | 10.7 (±10.2) | 150 (±92.3) |
| 2012–13 | Cool | 0.30 (±0.42) | −0.93 (±0.66) | 13.3 (±0.81) | 7.03 (±6.63) | 131 (±120) |
| 2013–14 | Neutral | −0.20 (±0.22) | −0.28 (±0.65) | 15.7 (±0.42) | 1.05 (±1.05) | 35.4 (±24.4) |
| 2014–15 | Warm | 0.61 (±0.24) | 1.56 (±0.68) | 16.6 (±0.39) | 2.48 (±2.39) | 44.1 (±32.5) |
| 2015–16 | Warm | 2.03 (±0.42) | 1.55 (±0.42) | 15.1 (±0.47) | 1.59 (±1.12) | 34.5 (±54.5) |
- Fishing season runs from 1 April to 31 March of the subsequent year. Ocean state is a qualitative description and refers to the general ocean condition during the squid fishing season and considers local sea surface temperature (SST), multivariate El Niño Southern Oscillation index (MEI) and Pacific Decadal Oscillation (PDO) values. SCHL refers to the log of surface chlorophyll-a values. SST and SCHL were aggregated from National Oceanic and Atmospheric Administration satellite data (see Material and Methods). ZPDV refers to zooplankton displacement volume.
Sea surface temperature and SCHL values were obtained from NOAA satellite observations (coastwatch.noaa.gov). SST values were obtained using night and day measurements by the Advanced Very High Resolution Radiometer instrument aboard the Polar Operation Environmental Satellite at a resolution of 1.4 km and 8-day composites. SST observations within 5 km of sampling stations the day of sampling were averaged to obtain a SST value for each station. Depending on satellite coverage and location, anywhere from 15 to 40 observations were used to yield a daily SST value.
The Moderate Resolution Imaging Spectroradiometer instrument aboard the Aqua satellite was used to obtain surface chlorophyll-a values at a resolution of 2.5 km and 14-day composites. Data points within 5 km of a given station were averaged for the day of paralarval sampling and the preceding day. Depending on satellite coverage and station location, anywhere from five to 15 chlorophyll-a values were averaged to yield one value for that station.
Spawning peaks, inferred from monthly commercial landings data provided by CDFW, typically occur during fall in the SCB, and spring in the MBR, with paralarvae hatching during the winter in the SCB and summer in the MBR. The fishery for market squid opens on 1 April and closes 31 March 3 of the subsequent year, or when the maximum catch limit of 107,000 MT is reached. A value between 1 and 12 was given to the sampling month and included in the model. Five regions were also included: Monterey, North and South Channel Islands, and North and South SCB (Figure 1). These regions are not independent, but were included to account for geographic patterns in the data. While market squid can freely migrate across broad north and south gradients off the California coast, these regions were selected as they adequately separated stations into north/south areas in the SCB, as well as between islands and the coast along a general northwest to southeast gradient that semelparous, spawning adults were unlikely to migrate between (Macewicz et al., 2004; Perretti, 2014). These regions can provide insight into geographic site utilization by adults. SST, ZPDV and SCHL values were included as main effects in the model, while temporal and geographic factors were allowed as interactions. Station was allowed to interact with region, and month was allowed to interact with fishing year, as the former variables were dependent on the latter.
Several constraints were included in the model to prevent overfitting, while allowing the model to be flexible enough to predict squid response. We limited the number of knots in the smooth splines to four. Secondly, we set the “gamma” value in the gam formula to 1.4 in order to increase the penalty per degree of freedom fit and to minimize overfitting (Wood, 2006). We performed model selection by using the shrinkage feature in the “gam” function instead of a forward/backward stepwise approach using the residual maximum likelihood error criterion. This option allowed co-efficients with little or no predictive ability to be shrunk to zero, effectively dropping these variables from the model.
3 RESULTS
3.1 Relative paralarval abundance
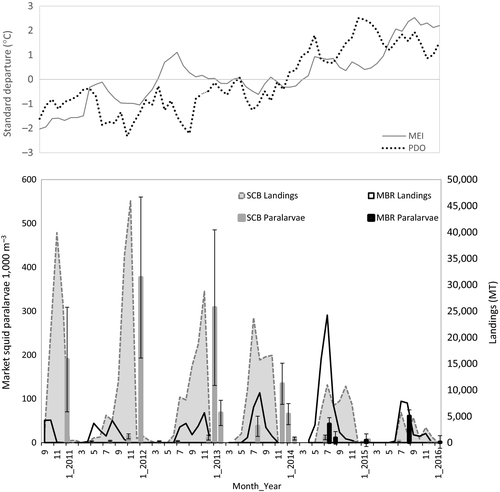
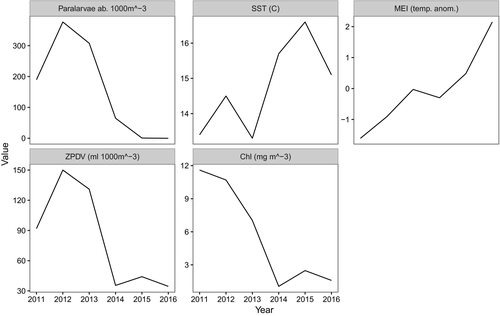
We conducted 649 net tows in the SCB and MBR from January 2011 through January 2016, sampling >62,000 market squid paralarvae. A total of 247 (38%) of these tows yielded no market squid paralarvae, mostly from spring and summer efforts in the SCB (Figure 2) and during strong El Niño years (2014–2015 and 2015–2016). For example, during peak El Niño conditions in January 2016, 84% of net tows conducted in the SCB and the MBR were devoid of paralarvae. During the moderate La Niña of 2012, when paralarval abundance was highest, only 13% of net tows yielded no market squid paralarvae. Densities varied widely both spatially and temporally. The mean abundance across all effort was 60.8 paralarvae per 1,000 m3 (±14.1 SE). Paralarval densities were greatest during winter months in the SCB, particularly in January (Figures 3 and 4). Maximum paralarval density encountered at a single station was 5,691 paralarvae per 1,000 m3, which occurred in January 2013 in the North SCB. The greatest monthly mean relative abundance in the SCB was 377 (±1005 SE) paralarvae per 1,000 m3 and occurred during January 2012. The lowest mean relative abundance was 0.08 (±0.04) paralarvae per 1,000 m3 and occurred during January 2016 (Figure 3).
3.2 Environmental conditions
A transition from cool to warm ocean conditions occurred during the course of our study. The study period began during a moderate La Niña in 2011. Conditions gradually warmed, and an El Niño notification was issued by NOAA during early spring 2015 and peaked as a strong El Niño in December 2015 (cpc.ncep.noaa.gov, Table 1). Pacific Decadal Oscillation values steadily increased throughout the study period, from approximately −2 in September 2010 to >2 in March 2015, indicating that the Eastern North Pacific became anomalously warmer during the investigation (Figure 3). Local SST values were low during the initial 3 years of the study, and were higher during the final 3 years. Surface chlorophyll-a and ZPDV were considerably higher during the initial 3 years compared to the final 3 (Table 1, Figure 4). These variables indicate that local waters were cooler and more productive during the La Niña phase, and warmer and less productive during the El Niño phase.
3.3 Density trends
Spawning shifted spatially and temporally during the transition from cool to warm ENSO conditions. Relative squid paralarval abundance in the SCB was high during the initial 3 years of the study, and steadily declined to very low levels during the final 3 years (Figure 3). Sampling in the MBR began in the summer of 2014. Moderate levels of paralarval abundance were observed in the summers of 2014 and 2015 in the MBR. Greater paralarval abundance was observed in the MBR than the SCB during both the 2014–2015 and 2015–2016 fishing years (commercial fishing year extends from 1 April to 31 March). Paralarval abundance was greatest during the summer in the MBR (Figure 3). The number of net tows with no market squid paralarvae increased during the study period as ocean conditions warmed. Only nine out of the 92 (9.78%) January net tows conducted in the SCB during the first 3 years of cool ocean conditions had no market squid paralarvae. In contrast, 49 out of 86 (57.7%) net tows conducted in the SCB during January from the last 3 years had no market squid paralarvae, indicating a contraction of suitable spawning habitat during warmer periods in the SCB.
Relative paralarval abundance during January in the SCB was high (291.8 paralarvae per 1,000 m3 ±898.9 SE) during the cool La Niña period from 2011 to 2012, moderate during the winter of 2013–2014 (65.0 ± 125.0) and quite low (0.08 ± 0.04) during the strong El Niño of January 2016 (Figure 4). Relative January paralarval abundances in the SCB during both the cool (2011–2013) and neutral phases (2014) of the study were significantly greater (p < .001) than relative January paralarval abundance during the warm El Niño phase (2015–2016) of the study.
3.4 Spatial and temporal trends in density
Squid shifted northward from the SCB to the MBR, and spawning occurred earlier in the season during the ENSO transition, as evidenced by both paralarval densities and landings data from the fishery (Figure 3). Commercial squid landings were very high in Southern California during the La Niña, and gradually declined through the study period beginning in the fall of 2012. As landings declined in the SCB, they increased in the MBR, until the summer of 2015, when statewide landings dropped (Figure 3). Approximately 88% of market squid landings occurred in Southern California (SC) during the 2011–2012 fishing season, while 22% came from Northern California (NC). Conversely, SC landings dropped to 52% (48% from NC) during the 2014–2015 fishing season. Relative paralarval abundances at the traditional spawning grounds showed a similar south to north shift. Paralarval densities in both the SCB and the MBR were lower statewide during the 2014–2015 fishing season and relative paralarval abundance was greater in the MBR than the SCB during July 2014, August 2015 (p < .01) and January 2016 survey efforts.
The portion of the market squid population analysed in this study appeared to spawn earlier in the year during the 2013–2014 commercial fishing year. This temporal shift occurred during the ENSO-driven transition from cool to warm ocean conditions. During this cool to warm ocean transition, peak commercial landings shifted to the summer months in SC. Fall months (particularly October and November) are typically the peak fishing times in SC. Relative paralarval densities exhibited a similar trend. Greater paralarval densities in the SCB occurred during summer surveys (Figure 3) and relative SCB paralarval abundance (37.3 paralarvae per 1,000 m3 ± 124.3) in 2013 was greater than all other summer survey estimates, and significantly greater (p < .05) than paralarval abundance in the summer of 2011.
3.5 Model output
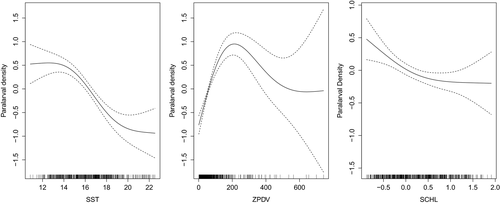
Strong relationships between paralarval density and SST, ZPDV, SCHL, and geographic and temporal variables were evident (Figure 5). Greater densities were associated with cooler temperatures (less than ~16.5°C). Paralarval density increased with increasing ZPDV until approximately 200 ml/1,000 m3. After this zooplankton concentration, the paralarval density decreased, but the associated model error increased considerably, indicating that zooplankton concentration is less important after ~200 ml/1,000 m3, perhaps because food was no longer a limiting factor. Greater paralarval densities were associated with low SCHL values, and declined with increased SCHL values (Figure 5). The model explained 40.6% of the deviance associated with predicting paralarval density, and had an adjusted r2 value of .31. SST, ZPDV, the interaction pairs of temporal and spatial variables (p < .001), and SCHL all contributed significantly to the model (p < .05) and are biologically important in determining market squid paralarval abundance at the traditional spawning locations in the SCB and the MBR.
4 DISCUSSION
High market squid paralarval densities over the traditional spawning grounds in the SCB and MBR were associated with cool and productive La Niña conditions. Densities declined as the ocean moved to a warm and unproductive El Niño state. Gradually warming ocean conditions were related to earlier market squid spawning and a northward shift in distribution toward cooler water. Subsequent years of anomalously warm temperatures then caused dramatic declines in relative paralarval densities and landings to the fishery.
4.1 Ecological and physiological effects of warm water on squid
Ocean temperature, squid metabolism, and prey availability are coupled, and these variables synoptically drive the variability observed in paralarval densities through ecological and physiological mechanisms. Ocean temperature influences the survival and growth of squids in many ecosystems (Bellido et al., 2001; Denis et al., 2002; Staaf, Redfern, Gilly, Watson, & Ballance, 2013). Cool ocean temperatures often indicate upwelled waters, elevated primary productivity, greater nutrient and oxygen availability, and consequently, greater zooplankton standing stock, which benefit the fitness and survival of market squid (Checkley & Barth, 2009; Lynn et al., 1995; Mackas, Peterson, Ohman, & Lavaniegos, 2006).
Warm ocean temperatures pose physiological restraints on market squid at each life-history stage. During the embryonic phase, lab studies demonstrated a hatching preference between 9 and 14°C and a greatly reduced hatching rate at warmer temperatures (Zeidberg, Isaac, Widmer, Neumeister, & Gilly, 2011). We found high paralarval density associated with cooler surface temperatures (less than ~16.5°C), similar to the ambient temperatures found in the Zeidberg et al. (2011) study, and very few paralarvae at higher SST, indicating poor survivorship at the embryonic stage. Waters warmer than that eventually yield malformations in squid (Rosa et al., 2012). Additional variables beyond temperature can affect the process of embryogenesis and market squid development, however. Navarro (2014) found oxygen availability, important for the growth and survival of embryonic squid, increased over the shelf environment during warming episodes.
At the paralarval stage, lab experiments indicate warm waters cause earlier hatching at a smaller size, produce individuals with reduced egg yolk, and cause these individuals to utilize their egg yolk faster (Oosthuizen, Roberts, & Sauer, 2002; Vidal, DiMarco, Wormuth, & Lee, 2002). This would indicate paralarvae would need to feed earlier and with a greater success rate compared to paralarvae hatched during cooler conditions. Conversely, fieldwork by Perretti and Sedarat (2016) found larger length-at-age paralarvae during El Niño compared to La Niña, which they attributed to larger paralarval hatch sizes during El Niño. These contradictory results indicate more research is needed to resolve this issue. Market squid paralarvae consume anywhere from 35% to 80% of their body weight daily (Hurley, 1976; Yang et al., 1986) and can starve after 4 days without food (Vidal, DiMarco, & Lee, 2006), which underlies the importance of egg yolk quality, size, and reliable feeding opportunities. In our study, we found a strong relationship between high paralarval density and moderate zooplankton concentration in the water column. Spawning adults may have evolved to prefer areas of moderate zooplankton density as a way to ensure feeding opportunity for hatchlings and to increase their survivability. Paralarval density was then found to dramatically decrease at the highest zooplankton concentrations encountered. Several ideas could explain this trend. Some of these plankton-dense samples were dominated by a single organism type, which may not reflect an environment with a rich, stable and diverse food source. High paralarval abundance would then not be expected in these examples. A zooplankton-rich environment dominated by a single species could also indicate a spawning event from a competitor species that may either outcompete squid paralarvae, or prey directly on paralarvae. Furthermore, zooplankton-rich waters could reduce oxygen availability to either the embryos or hatchlings and reduce survivability.
Mean surface chlorophyll-a concentrations across the SCB surveys co-varied with paralarval abundance across the time series, indicating that squid abundance is higher during productive oceanographic regimes. From a station to station perspective, however, we found an inverse relationship between paralarval density and surface chlorophyll-a concentration, with fewer paralarvae associated with higher chlorophyll-a levels. This would indicate that, while the overall productivity of the ecosystem is likely important, there is no direct causation between chlorophyll-a levels and paralarval abundance.
During the adult stage, gradually warming ocean conditions cause squid to mature faster (Forsythe, 2004) and recruit to the spawning beds months earlier than anticipated (Sims, Genner, Southward, & Hawkins, 2001). Warm temperatures increase the metabolic rate of squid, which not only results in early maturation, but also exerts additional energetic demands precisely when food is limited (O'Dor, 1982). Accelerated maturation could affect the phenology of squid (the timing of biological events to environmental conditions), and cause a “match-mismatch” scenario that regulates recruitment variation (Cushing, 1969). Market squid spawn in November, hatch in January, and reach the juvenile stage in spring during normal conditions in the SCB (Zeidberg et al., 2012). Spring corresponds to the period of greatest wind-driven upwelling in the CCE, which yields the greatest ocean productivity and highest euphausiid concentrations (Marinovic, Croll, Gong, Benson, & Chavez, 2002). Euphausiids are an integral prey resource for market squid (Karpov & Cailliet, 1979; J. E. Van Noord, unpublished data). If warming oceans cause squid to spawn early, juvenile stages could miss this reliable feeding event at a critical period of growth, affecting the timing of maturation and recruitment to the fishery. Additionally, El Niño events adversely affect the duration and intensity of upwelling in the CCE (Kahru & Mitchell, 2000).
4.2 ENSO effects on the relative abundance, distribution and behavior of squid
Warm oceanic conditions pose ecological and physiological challenges to market squid at multiple life-history stages (Reiss et al., 2004; Zeidberg & Hamner, 2002). These deleterious effects are evidenced by declines and distributional shifts in commercial fishery landings and relative paralarval abundances at the traditional spawning grounds in the SCB and MBR. As a result of the strong El Niño event of 1997, paralarval abundance and suitable habitat contracted in the CCE (Reiss et al., 2004; Zeidberg & Hamner, 2002). Likewise, landings declined from 80,000 to 3,000 MT from 1 year to the next. Conversely, the population recovery during favorable ENSO conditions was equally dramatic. Paralarval abundance around the Channel Islands increased 98% 1 year after El Niño conditions abated (Zeidberg et al., 2006), while landings rebounded to 118,000 MT (CDFW, 2005). Similar trends were observed in this study: relative paralarval abundance declined more than 99% from the moderate La Niña in 2012 to the to the strong El Niño of 2016, considering our January SCB survey effort. The fishery voluntarily closed during the 2014–2015 season, just shy of reaching the maximum catch limit of 107,000 MT. During the 2015–2016 season, the total catch was much lower, at 37,000 MT, with a majority of that catch coming from Northern California as squid populations likely contracted and moved north, seeking cooler ocean conditions.
While well documented, these dramatic boom and bust cycles are enigmatic (Butler et al., 1999; Perretti, 2014; Reiss et al., 2004). Questions remain as to whether the population truly contracts in ways that reflect the paucity and glut of landings and paralarval density. Alternative hypotheses suggest that squid seek non-traditional spawning habitats in deeper, offshore waters or habitats farther north than what is currently sampled or commercially fished (Navarro, 2014). Regardless of where adult squid may be spawning, there is likely a substantial overall reduction of paralarvae in the ecosystem. Surveys targeting the pelagic environment of the CCE (Leising et al., 2014) found a dearth of market squid paralarvae after prolonged El Niño events. If landings reflect the population biomass, then the intrinsic growth rate of the population and the survivorship of paralarvae following strong El Niño events would have to be remarkably high for the fishery to recover as rapidly as it does (CDFW, 2005).
Alternatively, fishermen report changes in squid behavior that reduces catchability during El Niño periods of low abundance and density. Squid observed on the sea floor during strong El Niño conditions are unresponsive to the high-powered lights normally used to attract them to the surface where they are harvested by purse-seine nets, (N. Guglielmo, personal communication); given this avoidance behavior, a commercial fishery is not possible and commercial landings would therefore not reflect the true population. Under this scenario, squid could be spawning at harvestable densities but at deeper depths where the water is colder, and they are not attracted to the surface by traditional lighting methods. Paralarval would then be spread out over a wider surface area, and densities would be reduced, explaining the drop in paralarvae abundances observed in this study and elsewhere (Navarro, 2014; Zeidberg & Hamner, 2002).
Navarro (2014) found evidence that spawning habitat during some El Niño scenarios may expand to include deeper shelf-waters. This deeper shelf expansion would decrease the observable density through net tows and by commercial operations, but would not necessarily indicate a reduction in the abundance if the population is spread out across a greater area (Erisman et al., 2011). Reports have indicated that squid egg capsules have been observed in waters hundreds of meters deep (Butler et al., 1999; Zeidberg et al., 2012), which further suggests squid retreat to colder and deeper waters during warm ocean conditions, although pH and oxygen availability also influence habitat selection by market squid (Navarro et al., 2016).
The response by market squid to changes in temperature has implications for climate change. Warmer waters can shift fisheries north or into deeper offshore waters where they are not harvestable. The inshore environment in the CCE is also expected to suffer from lower pH and oxygen availability, further stressing market squid populations (Navarro et al., 2016). Ecosystem alternations due to climate change can affect the timing of the fishery and industry operations and reduce the standing stock, potentially costing millions in lost revenue. Chronically warm ocean temperatures can have cascading effects on food webs, as squid may disappear from southern locations in the CCE as a reliable food source for top predators, while outcompeting and potentially replacing some fishes in northern ecosystems due to their high food demands, rapid growth and high turnover rate (Pecl & Jackson, 2007). Understanding the resiliency of squid and the effects from warming oceans can help predict climate change impacts to the CCE and the fishery.
5 SUMMARY
This study represents the most comprehensive, on-going effort to directly assess the relative abundance of market squid paralarvae in nearshore waters and the conditions that influence the variability in the stock, density and distribution. Warm temperatures pose ecological and physiological limitations on squid through feeding constraints and metabolic stress that alter the timing and location of spawning. We found that the densities and distribution of market squid paralarvae show a strong relationship to local sea surface temperatures and ocean productivity, where colder temperatures and moderate zooplankton displacement volumes promote greater paralarval densities, while warmer temperatures cause the population to spawn earlier, shift north, and contract. These findings indicate that squid density at the traditional spawning grounds in the SCB and MBR, distribution, and timing of spawning are largely driven by environmental forcing, while the effect from the fishing pressure is likely much less.
ACKNOWLEDGEMENTS
Funding for this project was possible through the California Wetfish Producers Association and a cooperative grant from NOAA's SWFSC. We would like to thank the CDFW for their cooperation, the captains and crews of charter vessels Sea Jay, Stardust and Donna Kathleen, and the many squid fishermen who provided observations and local knowledge. Thanks to L. Zeidberg and scientists at the NOAA SWFSC who assisted in establishing the survey protocol. Thanks to D. Hanan, the fishing vessel Outer Banks, and fishermen who participated in pilot surveys. Thanks to M. Sedarat, R. Taylor, L. Olsen, S. Martinez and P. Carrey for laboratory assistance. Thanks to J. Zwolinski and B. Taylor for edits to improve this manuscript.


