Pharmacokinetics of intravenous, subcutaneous, and topical administration of lidocaine hydrochloride and metabolites 3-hydroxylidocaine, monoethylglycinexylidide, and 4-hydroxylidocaine in horse
Abstact
Intravenous (iv), subcutaneous (sq), and topical (tp) lidocaine was administered to six horses in a cross-over, randomized design study. Samples were collected for up to 72 hr. Compartmental models were used to investigate the pharmacokinetics of (LD) and its metabolites 3-hydroxylidocaine (3-OH), 4-hydroxylidocaine (4-OH), and monoethylglycinexylidide (MEGX). Metabolites 3-OH and 4-OH were present in conjugated forms, whereas LD and metabolite MEXG were present primarily in the un-conjugated form. Plasma concentrations of LD after iv administration (100 mg) were described by three-compartment model with an additional three compartments to describe the elimination of metabolites. Median (range) elimination micro-constants (Ke) for LD, 3-OH, 4-OH, and MEXG were 4.12 (2.62–6.23), 1.25 (1.10–2.15), 1.79 (1.22–2.39), and 1.69 (1.03–1.99)/hr, respectively. Median (range) values of alpha (t½α), beta (t½β), and gamma (t½γ) half-lives were 0.08 (0.07–0.13), 0.57 (0.15–1.25), and 4.11 (0.52–7.36) hr. Plasma concentrations of LD after sq (200 mg) administration were described by absorption and two-compartment elimination model. The median (range) of the LD absorption half-life (t½ab) was 0.47 (0.29–0.61) hr. The Ke for LD, 3-OH, 4-OH, and MEXG was 3.91 (1.48–9.25), 1.00 (0.78–1.08), 1.76 (0.96–2.11), and 1.13 (0.69–1.33)/hr. The median (range) of t½α and t½β was 0.15 (0.06–0.27) and 3.04 (2.53–6.39) hr. Plasma concentrations of LD after tp (400 mg) application were described by one-compartment model with a t½ab of 8.49 (5.16–11.80) hr. The Ke for LD, 3-OH, and MEXG was 0.24 (0.10–0.81), 0.41 (0.08–0.93), and 0.38 (0.26–1.14)/hr.
1 INTRODUCTION
Lidocaine hydrochloride (LD) is extensively used in veterinary practice (Heavner, 1981; Hubbell, Saville, & Bednarski, 2010; Webb & Pablo, 2009). It is commonly used as a local analgesia, as a line block, blocking a specific nerve or group of nerves, intra-articular injection (Derksen, 1980; Dyson & Kidd, 1993; Spoormakers, Donker, & Ensink, 2004), and regionally by epidural or ganglionic blockage (Schelling & Klein, 1985; Skarda, Muir, & Couri, 1987). Topical preparations are by direct application (Argoff, 2002a, 2002b; Rowbotham, Davies, & Fields, 1995) or LD patch (Argoff, 2002a, 2002b; Gammaitoni, Alvarez, & Galer, 2003; Ko, Maxwell, Abbo, & Weil, 2008; Ko, Weil, Maxwell, Kitao, & Haydon, 2007).
Lidocaine has been administered intravenously by continuous infusion for the treatment of cardiac arrhythmias, ileus, and as an adjunct to general anesthesia (Malone et al., 2006; Navas de Solis & McKenzie, 2007; Rezende, Wagner, Mama, Ferreira, & Steffey, 2011; Wagner, Mama, Steffey, Ferreira, & Rezende, 2011).
Lidocaine is considered intermediate in its duration of action (~90 min) with a fast onset and a potency two times that of procaine (Luduena, 1969; Webb & Pablo, 2009) and the duration of analgesia is approximately 100 min (Tucker & Mather, 1979). The use of LD with epinephrine will prolong the analgesia (Spoormakers et al., 2004) by delaying its absorption (Braid & Scott, 1965).
Lidocaine is an amide with a structural formula of 2-(diethy-lamino)-N-(2, 6-dimethylphenyl) acetamide. A number of metabolites have been described in the elimination of LD in horses: 3-hydroxylidocaine (3-OH), 4-hydroxylidocaine (4-OH), 4-hydroxy-2, 6-dimethylanaline (4-OH-DMA), and monoethylglycinexylidide (MEGX), 4-OH-monoethylglycinexylidide (OH-MEGX), 2-6-dimethylanaline (DMA), 4-hydroxylidocaine (4-OH), and glycine xylidide (GX) (Chalmers, Elgar, Blay, Teale, & Moss, 1985; Crone et al., 1987; Dirikolu et al., 2000; Maes et al., 2007; Navas de Solis & McKenzie, 2007; Nelis et al., 2010; Scarth, Teale, & Kuuranne, 2011; Short, Flory, Hsieh, Aranas, & Barker, 1988). Similar metabolites have been identified in the rat, guinea pig, dog, and man, with variation between species in the recovery of various metabolites (Keenaghan & Boyes, 1972).
This paper describes the pharmacokinetics and elimination of LD following iv, sq, and tp administration in horses by determining the plasma and urinary concentration of lidocaine (LD) (234.34 g/mol) and three primary metabolites 3-hydroxylidocaine (3-OH) (250.34 g/mol), 4-hydroxylidocaine (4-OH) (250.34 g/mol), monoethylglycinexylidide (MEGX) (206.28 g/mol) (Harkins et al., 1998).
2 MATERIAL AND METHODS
2.1 Horses
The study was approved by the University of Pennsylvania Institutional Animal Care and Use Committee. Six Thoroughbreds (3 mares and 3 geldings) weighing 572.5 ± SD of 53.5 kg, ranging in age from 3 to 13 years, were selected from the research herd. The horses were no longer actively racing but were otherwise in good health; routine foot, dental care, vaccination, and deworming were performed on a scheduled basis and were housed on pasture with shelters. The horses were brought into climate-controlled stalls 2 days before the experiment and remained for the duration of the study. Hay and water were available ad libitum. Horses were weighed on the morning before the start of each study.
2.2 Drug administration
Lidocaine was administered to horses in a cross-over, randomized design with a minimum of 2 weeks elapsing between administrations. Five milliliters (100 mg) (0.17 ± 0.01 mg/kg) of a 2% solution (Hospira Inc. IL, USA) of LD were administered as iv bolus. The sq injection 10 ml (200 mg) (0.35 ± 0.03 mg/kg) using a 22-gauge needle was centered over the right carpus. For the tp administration, 8 g of a 5% LD (400 mg) ointment was weighted and applied (0.68 ± 0.06 mg/kg) to a clipped carpus region (7.5 × 10 cm) and covered by a Tefla nonadherent dressing pad, (Tyco Healthcare UK); the pad was wrapped with 4″ elastic tape (Elastikon, Johnson and Johnson, NJ, USA) and left on for 24 hr. Lidocaine remaining on the skin surface was not removed from the carpal area and the collection of samples continued for 72 hr. The LD ointment was in a soluble base containing water, ethoxydiglycol, trolamine, carbomer, allantoin, DMDM hydantoin, iodopropynyl butylcarbamate, ethyl aminobenzoate. (Taro Pharmaceuticals Inc. NJ, USA).
All blood samples were collected in Na fluoride/K Oxalate anticoagulant (Johnson and Johnson, NJ, USA) using a 14-gauge catheter (Angiocath, Becton Dickinson, UT, USA) placed into the jugular vein. For the iv administration, two catheters were aseptically placed, one for injection and the second for contralateral collection of blood samples.
Blood samples were collected before drug administration (0 hr) and at 2, 5, 10, 15, 20, 30, and 45 min and at 1, 2, 3, 4, 6, 8, 10, 12, 16, 20, 24, 48, and 72 hr post-drug administration. Heparinized saline and waste blood were withdrawn from the catheter into a 20-ml syringe too insure that undiluted blood was being collected; following the collection of the blood sample, the waste blood was reinjected, and the catheter flushed with heparinized saline. Blood samples were centrifuged (2,500 g for 15 min) to harvest plasma. Three aliquots of 2 ml of plasma were immediately frozen and stored at −70°C until analyzed. The cross-over study took four to five months, and samples were stored at −70°C for no longer than the duration of the study.
2.3 Urine samples
In female horses, for 24 hr of continuous collection of urine, a sterile indwelling 24-F self-retaining catheter (Foley Catheters, CR Bard Inc., GA, USA) was aseptically placed in the bladder and attached to a drainage bag (Bard Center Entry Urinary Drainage Bag, CR Bard Inc., GA, USA). Urine samples were collected at 1, 2, 4, 6, 8, 10, 12, 16, 20, 24, 48, and 72 hr after drug administration. In male horse a urine catcher was used. Urine samples (12 ml) were also stored at −70°C until analyzed. The volume was recorded for all urine samples collected during the first 24 hr. Urine volume multiplied times analyte concentration was used to determine the total amount (μg) of LD and metabolites eliminated. Due to the differences in molecular weights, micrograms were converted to moles for these calculations. Percent urinary elimination of each analyte was based on molar units of LD and metabolites relative to the total molar units eliminated.
2.4 Quantification of lidocaine and its metabolites
Lidocaine hydrochloride was purchased from Sigma-Aldrich, MO, USA and 3-OH and 4-OH from Frontier BioPharm. KY, USA, and MEXG from Alltech Associate-Applied Science, PA, USA. A sensitive analysis using ultrahigh-pressure liquid chromatography-tandem electrospray mass spectrometry (UHPLC-MS/MS) was developed and validated for quantification of lidocaine and its three primary metabolites in equine plasma and urine.
2.4.1 Samples preparation
The effect of enzymatic hydrolysis on the quantification of lidocaine and its major metabolites was studied in the plasma samples from two horses collected after 1-hr and 2-hr lidocaine iv administration. The results showed that metabolites 3-OH and 4-OH lidocaine could not be detected in those plasma samples without enzymatic hydrolysis, suggesting that 3-OH and 4-OH lidocaine predominantly existed in conjugated form in plasma; LD and MEGX were not significantly affected by enzyme hydrolysis and presented primarily as free form in plasma (see Supporting Information Table S1). Therefore, in this study, enzymatic hydrolysis was employed in sample preparation and the analytes quantified in this method included both conjugated and un-conjugated forms.
Plasma/urine samples were incubated with freshly prepared beta-glucuronidase at 65°C for 1.0 hr to hydrolyze the sample and de-conjugated analytes presented as glucuronide conjugates. The hydrolyzed samples were adjusted to alkaline pH (10–11) and 5 ml of methyl tert-butyl ether was added to extract the analytes. The mixture was centrifuged (1,300 g for 10 min) and the top organic layer was evaporated to dryness at 60°C (TechniDri-Block DB-3, Duxford, Cambridge, UK) under a steady stream of air. The dried extract was reconstituted in 0.5-ml mobile phase. Twenty—microliters of reconstituted sample were analyzed by UHPLC-MS/MS.
2.4.2 Liquid chromatography and mass spectrometry
For UHPLC-MS/MS analysis, analytes were separated on a Phenomenex Kinetex 1.7-μm PFP column (50 × 2.1 mm) (Phnomenex, CA, USA) and analyzed by TSQ Quantum Ultra mass spectrometer (Thermo Fisher Scientific, CA, USA). Positive electrospray ionization mode was used with selected reaction monitoring (SRM). Mass spectrometer parameters common to all analytes were: spray voltage, 3,500 v; vaporizer temperature, 205°C; sheath gas, 60 arbitrary units; ion sweep gas, 0 arbitrary units; auxiliary gas, 10 arbitrary units; ion transfer capillary temperature, 300°C; peak width relating to resolution (FWHM), 0.7 u for Q1 and Q3; collision gas pressure, 1.5 mTorr (1 Torr = 133 pa); scan width (m/z), 0.5; and scan time, 100 ms for each SRM scan. Data acquisition and analysis were accomplished by Xcalibur software v 2.0.7 (Thermo Fisher Scientific, CA, USA).
2.4.3 Quantification of lidocaine and its metabolites
The SRM transitions for quantification of lidocaine, 3-hydroxylidocaine, 4-hydroxylidocaine, and MEGX were: m/z 235 → m/z 86, m/z 251 → m/z 86, m/z 251 → m/z 86, and m/z 207 → m/z 58, respectively. Deuterium-labeled lidocaine-d10 and 4-hydroxylidocaine-d10 were used as internal standards. The dynamic range was 0.1–100 ng/ml, with correlation coefficients (r) for the quadratic regression >0.99. Limits of quantification for LD, 3-OH, and 4-OH were 0.1 and 0.5 ng/ml for MEXG. The accuracy and precision at concentrations of 0.1, 0.5, 10, 50, and 100 ng/l determined (Supporting Information Table S2). Standard operating procedures used by this laboratory meet the requirements established by International Organization for Standardization. ISO/IEC 17025:2005: General requirements for the competence of testing and calibration laboratories www.iso.org/standard/39883.html. The laboratory is accredited by the American Association for Laboratory Accreditation (www.a2la.org) validation. https://www.fda.gov/downloads/drugs/guidancecomplianceregulatoryinformation/guidances/ucm368107.
2.5 Pharmacokinetic analysis
Compartmental analysis was used to describe the disposition and elimination of LD and its three primary metabolites 3-OH, 4-OH, and MEXG, following iv, sq, and tp administrations. Plasma concentration versus time curves from each horse were analyzed using conventional nonlinear least-squares regression analysis (Simulation, Analysis and Modeling Software, WinSaam.com.) Three and two-compartment models were fitted to plasma concentrations of LD following iv and sq administrations and one-compartment model to tp application. The number of compartments required to best describe the LD and metabolite plasma concentrations was based on the reduction in the sums of squares, minimization of fractional standard deviation of each compartmental parameter, and the converging of the observed and predicted plasma concentrations curves.
A three-compartment mammillary model with injection into and elimination from the central compartment (C1), with inter-compartmental distribution rate constants to C2 (k12, k21) and C6. The method was validated based on FDA Guidance for Bioanalytical Industry (1) US Food and Drug Administration.1 Guidance for industry–Bioanalytical method (k16, k61), was used to describe iv LD administration (Figure 1a). Additional compartments were added to incorporate the LD metabolites, where C1 represented LD central compartment and C3, C4, and C5 represented those of the three metabolites. The fractional rate constants (k13, k14, k15) represent the transfer/metabolism from C1 to respective compartments and (K10, K30, K40, K50) represent the elimination rate constants (Ke) from the central and respective compartments.
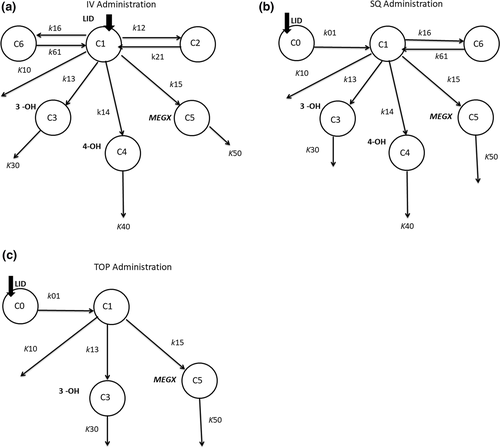
An absorption and two-compartment elimination model was used to describe sq LD administration. Lidocaine was absorbed from the subcutaneous compartment (C0) to the central compartment C1 (k01), with elimination (K10) from C1, with inter-compartmental distribution rate constants to C6 (k16, k61). Compartments C3, C4, and C5 were added to represent 3-OH, 4-OH, and MEGX, respectively (Figure 1b).
A one-compartment absorption and elimination model was used to describe tp LD application. Lidocaine was absorbed from the cutaneous compartment (C0) to central compartment C1 (k01) and elimination (K10) from C1. Compartments C3 and C5 were added to represent 3-OH and MEGX, respectively (Figure 1c). Concentrations of the 4-OH were inconsistent and all below the LLOQ and could not be incorporated into the tp model.
The inter-compartmental micro-rate constants for the iv and sq administration were converted to macro-constants exponents, alpha (α), beta (β), and gamma (γ), as described (Boston, Greif, & Berman, 1981; Stefanovski, Moate, & Boston, 2003; Wastney, Patterson, Linares, Greif, & Boston, 1999). The apparent volume of central compartment (Vc) was calculated by the amount of drug in the body at time t, divided by the plasma concentration at time t (Toutain & Bousquet-Melou, 2004).
Various schemes were used for weighting the data (W(K)) in the fitting process. The fractional standard deviation (FSD) was in the form of W(K) = 1/(C*QO(K)**2 where QO(K) was the kth observed datum and C was the FSD. The standard deviation (SD) weighting scheme was of the form W(K) = 1/C**2. The FSD weighting process favors the terminal lower concentrations of the decay curve, where the SD favors the larger and intermediate data points. Data from each horse were iterate multiple times, reducing the estimated SD or FSD at each iteration until the sums of squares and the FSD of each compartmental parameter were no longer minimized and the observed and predicted lines converged. The fitting process (iterations) ceased when the improvement in the sums of squares of the last iteration was <1% (Wastney et al., 1999).
2.5.1 Calculation of secondary parameters
 ) was calculated by the linear trapezoid method. Maximum plasma concentration (Cmax), time to reach the maximum plasma concentration (Tmax), and the AUC were derived directly from the plasma concentration time curves not the fitted curves. Estimated volumes of compartments C2 and C6 following iv administration were calculated by the ratios of the inter-departmental rate constants k12/k21 and k16/k61 times volume Vc. The volume at steady state (Vss) was calculated as:


Pharmacokinetic parameter estimates of LD and metabolites were expressed as median and range. Plasma concentrations were expressed as mean and standard deviation.
3 RESULTS
3.1 Intravenous (iv) administration
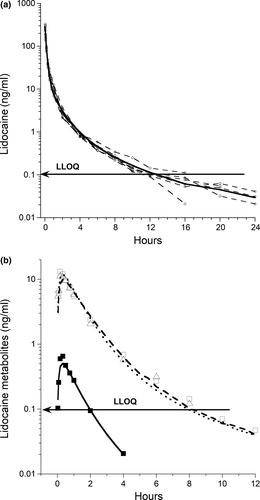
The Vc was 0.59 (0.37–0.88) L/kg. Micro-constant estimates and calculated parameters of LD and metabolites are shown in Table 1. The plasma concentration time curve of the parent drug LD and metabolites is shown in Figure 2 and macro-constant parameters and secondary calculations of LD are shown in Table 2.
| Parameter | LD | 3-OH | 4-OH | MEGX |
|---|---|---|---|---|
| Intravenous Lidocaine (100 mg) | ||||
| Ke (/hr) | 4.12 (2.62–6.23) | 1.25 (1.10–2.15 | 1.79 (1.22–2.39) | 1.69 (1.03–1.99 |
| t½e (hr) | 0.17 (0.11–0.26) | 0.55 (0.32–0.63) | 0.39 (0.29–0.57) | 0.41 (0.35–0.67) |
| ClC (L hr−1 kg−1) | 2.30 (2.11–2.81) | 0.82 (0.45–1.44) | 1.06 (0.61–2.11) | 1.10 (0.38–1.57) |
 (ng*hr/ml)a (ng*hr/ml)a |
56.9 (51.3–67.6) | 20.9 (9.7–24.7) | 0.83 (0.29–0.10) | 14.7 (12.4–24.5) |
| Tmax (min) | 2 | 10 (10–20) | 20 (10–20) | 10 (10–20) |
| Cmax (ng/ml) | 277.4 (231.1–330.5 | 17.6 (6.4–20.5) | 0.78 (0.34–1.04) | 9.4 (8.5–18.7) |
| Subcutaneous lidocaine (200 mg) | ||||
| Ke (/hr) | 3.91 (1.48–9.25) | 1.00 (0.78–1.08) | 1.76 (0.96–2.11) | 1.13 (0.69–1.33) |
| t½e (hr) | 0.18 (0.07–0.45) | 0.69 (0.64–0.88) | 0.39 (0.33–0.72) | 0.61 (0.52–0.99) |
| ClC*F (L hr−1 kg−1) | 2.48 (2.23–3.82) | 0.71 (0.32–1.78) | 1.02 (0.40–1.67) | 0.73 (0.42–1.35) |
 (ng*hr/ml)a (ng*hr/ml)a |
104.5 (72.4–163.5) | 28.9 (20.2–52.4) | 1.3 (0.86–2.1) | 27.3 (20.3–38.4) |
| Tmax (min) | 20 (10–20) | 45 (30–60) | 50 (45–60) | 45 (30–60) |
| Cmax (ng/ml) | 94.6 (66.7–117.2) | 12.2 (8.7–19.9) | 0.54 (0.36–0.88) | 10.4 (8.3–15.1) |
| Topical Lidocaine (400 mg) | ||||
| Ke (/hr) | 0.24 (0.10–0.81) | 0.41 (0.08–0.93) | 0.38 (0.26–1.14) | |
| t½e (hr) | 2.91 (0.84–6.68) | 1.67 (0.75–8.46) | 1.80 (0.61–2.70) | |
| ClC*F (L hr−1 kg−1) | 1.25 (0.30–2.06) | 2.39 (0.36–3.86) | 3.44 (1.35–8.09) | |
 (ng*hr/ml)a (ng*hr/ml)a |
23.3 (10.9–41.8) | 12.5 (4.4–22.4) | 12.2 (6.1–19.7) | |
| Tmax (hr) | 4.0 (2.0–12.0) | 4.0 (3.0–8.0) | 5.0 (3.0–8.0) | |
| Cmax (ng/ml) | 2.17 (1.19–2.84) | 0.89 (0.10–1.70) | 0.93 (0.48–1.27) | |
Notes
-
Ke: elimination rate constants; t½e: elimination half-life; ClC: compartmental clearance;
 : area under the concentration time curve, 0 to last hour*; Tmax: time to maximum concentration; Cmax: maximum concentration; ClC*F: fractional clearance.
- a Last hour represents 4–24 hr, depending on the route of administration, LD or metabolite.
| Parameter | LD IV |
|---|---|
| A(ng/ml) | 373.1 (212.6–472.3) |
| α (hr) | 8.64 (5.28–10.38) |
| t½a (hr) | 0.08 (0.07–0.13) |
| B (ng/ml) | 44.2 (15.1–6.14) |
| β (hr) | 1.28 (0.55–4.60) |
| t½β (hr) | 0.57 (0.15–1.25) |
| C (ng/ml) | 2.90 (1.83–3.83) |
| γ (hr) | 0.17 (0.09–1.32) |
| t½γ (hr) | 4.11 (0.52–7.36) |
| Vc (L/kg) | 0.59 (0.37–0.88) |
| V2 (L/kg) | 1.31 (0.87–2.41) |
| V3 (L/kg) | 0.93 (0.37–1.73) |
| Vss (L/kg) | 3.24 (1.61–4.95) |
Note
- A, B, C: coefficients; α, β, γ: exponents; t½α, t½β, t½γ: half-lives; Vc: volume of central compartment; V2, V3: volume of compartments 2, 3; Vss: volume of distribution at steady state.
All three metabolites were quantified in all six horses within 2 min. There were no significant differences in peak concentrations of 3-OH and MEXG, both occurring between 10 and 20 min. At 16 hr, all LD plasma concentrations were at or below the LLOQ. Lidocaine was detected in plasma in only two horses at 24 hr. Lidocaine metabolite 4-OH was the least abundant of the three and not detected beyond 4 hr, and 3-OH and MEXG not beyond 10 and 12 hr.
3.2 Subcutaneous (sq) administration
Micro-constant estimates and calculated parameters of LD and metabolites are show in Table 1. The plasma concentration time curve of LD and metabolites is shown in Figure 3. Lidocaine Kab and t½ab were 1.46 (1.13–2.37)/hr and 0.47 (0.29–0.61) hr, respectively. The two-compartment elimination macro-constants α and β were 4.66 (2.61–10.67) and 0.23 (0.13–0.27)/hr and half-lives t½α and t½β 0.15 (0.06–0.27) and 3.04 (2.53–6.39) hr, respectively.
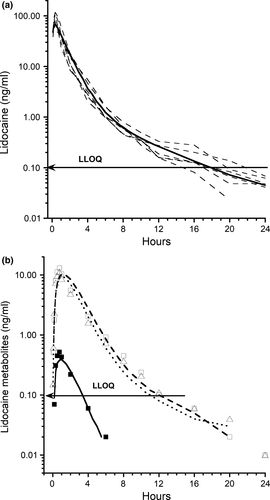
Plasma concentrations of LD and MEXG were seen in all horses at 2 min, and 3-OH and 4-OH at 5 and 10 min; lidocaine and MEXG were still detected at 24 hr. The bioavailability of the sq LD, 3-HO, 4-HO, and MEXG was 87.7 ± 16.7%, 94.4 ± 26.8%, 73.4 ± 24.9%, and 89.5 ± 22.5%, respectively.
3.3 Topical (tp) administration
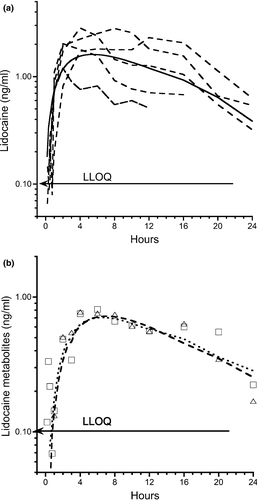
Micro-constant estimates and calculated parameters of LD and metabolites are show in Table 1. The plasma concentration time curve of LD and metabolites is shown in Figure 4. The Kab following tp administration was 0.08 (0.06–0.13)/hr and t½ab 8.49 (5.16–11.08) hr. The bioavailability of the LD and metabolites 3-OH and MEXG was 10.2 ± 4.8%, 14.4 ± 8.4%, and 19.7 ± 10.9%, respectively.
3.4 Urine parameters and concentrations
The urinary AUC, 24, 48, and 72 hr urinary concentrations and other parameters following the iv, sq, and tp administrations are show in Table 3. In the first 24-hr following the administration of iv LD, the percentage elimination of LD, 3-OH, 4-OH, and MEXG was 22.6 ± 18.0%, 51.5 ± 13.9%, 2.8 ± 1.0%, and 23.1 ± 17.9%, respectively. The concentration of LD in urine following iv LD was initially high, followed by a rapid decline in the % of total LD excreted, with a concurrent rapid increase in the metabolites 3-OH and MEXG (Figure 5a).
| Parameter | LD | 3-OH | 4-OH | MEXG |
|---|---|---|---|---|
| Intravenous Lidocaine (100 mg) | ||||
 (μg*hr/ml) (μg*hr/ml) |
3.1 (0.54–9.7) | 12.0 (6.5–29.3) | 0.61 (0.50–1.4) | 5.7 (3.6–11.7) |
| Tmax (hr) | 2 (0.5–4) | 2 (1–4) | 2 (1–4) | 2.0 (1–4) |
| Cmax (ng/ml) | 1702.0 (52.4–8053.1) | 2898.9 (1694.2–6261.7) | 203.1 (155.5–865.5) | 1336.0 (731.9–6373.1) |
| C24 (ng/ml) | 6.2 (1.0–31.3) | 16.6 (1.1–52.4) | 0.73 (0.03–3.2) | 3.3 (0.6–21.3) |
| C48 (ng/ml) | 1.6 (0.77–9.8) | 5.0 (1.5–7.9) | 0.20 (0.05–0.34) | 0.47 (0.03–3.5) |
| Subcutaneous Lidocaine (200 mg) | ||||
 (μg*hr/ml) (μg*hr/ml) |
2.8 (2.7–18.8) | 25.4 (12.4–33.7) | 1.3 (0.46–1.4) | 6.4 (3.1–19.2) |
| Tmax (hr) | 2 (2–6) | 2 (1–2) | 2 (1–2) | 2 (1–2) |
| Cmax (ng/ml) | 955.2 (423.4–3069.7) | 6856.1 (5064.2–9089.5) | 253.8 (167.2–407.9)b | 1511.1 (699.1–4509.1)b |
| C24 (ng/ml) | 5.4 (3.4–29.9) | 51.4 (23.6–67.4) | 1.9 (0.68–2.4)a | 11.0 (5.5–20.9)a |
| C48 (ng/ml) | 1.2 (0.07–4.1) | 5.4 (2.8–10.3) | 0.09 (0.08–0.48) | 1.2 (0.29–1.9) |
| Topical Lidocaine (400 mg) | ||||
 (μg*hr/ml) (μg*hr/ml) |
2.3 (0.69–6.3) | 11.6 (4.1–13.5) | 0.38 (0.23–0.45) | 3.9 (2.0–5.7) |
| Tmax (hr) | 10.0 (8–16) | 9 (8–16) | 8 (8–16) | 8 (6–16) |
| Cmax (ng/ml) | 197.2 (79.3–649.6) | 552.3 (234.7–1059.5) | 27.3 (15.2–37.7) | 169.1 (105.5–328.2) |
| C24 (ng/ml) | 55.5 (9.5–100.3) | 265.7 (122.9–420.5) | 12.2 (2.6–17.2) | 58.1 (46.9–165.7) |
| C48 (ng/ml) | 2.8 (0.08–37.4) | 10.2 (4.8–18.1) | 0.31 (0.18–0.91) | 2.2 (1.4–3.6) |
| C72 (ng/ml) | 2.2 (0.62–4.4) | 4.0 (1.4–10.7) | Not detected | 1.2 (0.15–1.6) |
Note
-
 : area under the curve 0–24 hr; Tmax: time to maximum concentration; Cmax: maximum concentration; C24, C48, C72: urinary concentrations at 24, 48, 72 hr
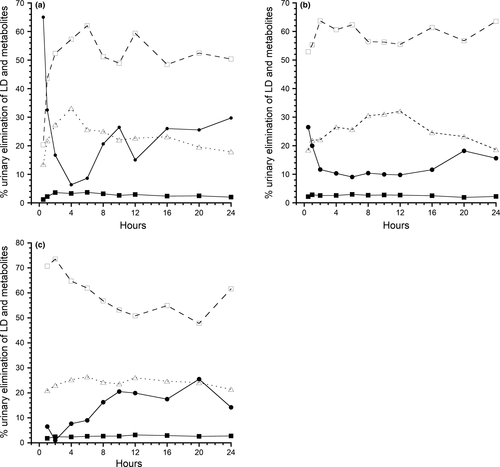
A similar, but less pronounced pattern was seen following the sq administration (Figure 5b). Following the administration of sq LD, the percentage elimination of LD, 3-OH, 4-OH, and MEXG was 13.6 ± 14.7%, 59.1 ± 15.5%, 2.5 ± 1.1%, and 24.6 ± 8.7%, respectively.
The tp urinary excretion pattern reflects slow absorption and elimination and percentage elimination of LD, 3-OH, 4-OH, and MEXG was 12.7 ± 11.3%, 61.2 ± 11.5%, 2.6 ± 0.90%, and 23.4 ± 5.4%, respectively (Figure 5c).
4 DISCUSSION
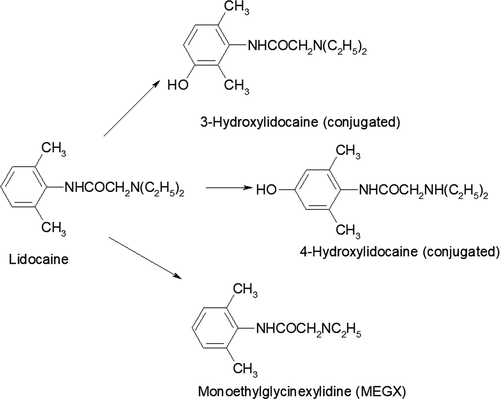
The analysis of LD and the three metabolites in this study was not a complete analysis of the metabolism of LD as a number of secondary and tertiary metabolites have been described, but not analyzed in this study (Harkins et al., 1998). A more complete model has been suggested which requires analysis of primary, secondary, and tertiary metabolites (Pang, 1985). Three hydroxylidocaine, 4-OH, and MEXG were selected as they are the primary metabolites of the parent compound, as no intermediates have been described (Figure 6). Lidocaine and MEXG were detected primarily in the free-form state, whereas 3-OH and 4-OH were only present in the conjugated state, detected and quantified only following enzyme hydrolysis. In humans, 4-OH was only present as a glucuronide and MEXG as a free and conjugated form. Glycyl-2,6-xylidide (GX) commonly detected in LD studies is a metabolite of MEXG, which was found in free form(Tam, Ke, Coutts, Wyse, & Gray, 1990). Glycyl-2,6-xylidide (GX) has been quantified in LD administrative studies in horses; it was not used in this study as it is a secondary metabolite of MEXG.
4.1 Intravenous administration
Median Vc for LD was 0.59 L/kg, a volume of distribution which was cross-checked using the model-free method and nonlinear regression methods. The ClC of all three metabolites were based on the volume of the central compartment as the metabolites were considered as part of the central pool.
In our study, a three-compartment model best described the elimination of LD following iv administration. Three-compartment models have been described in earlier studies in humans and more recent studies in cats (De Jong, Heavner, & De Oliveira, 1972; Nation, Triggs, & Selig, 1977; Thomasy, Pypendop, Ilkiw, & Stanley, 2005; Tucker & Mather, 1975). A prior study in three horses using a two-compartmental analysis, Cl was 52 ± 11.7 and 43.7 ± 8.5 ml min−1 kg−1 in control and fasted horses, with t½β of 0.61 hr; a two-compartmental analysis was used based on the limited time (60 min) for which LD was quantified (Engelking, Blyden, Lofstedt, & Greenblatt, 1987). Our study reported a ClC of ~38 ml min−1 kg−1 following iv administration of LD. Figures 2 and 3 show concentrations below the LLOQ. Concentrations below the LLOQ for the iv administration were at 16, 20, and 24 hr time points and at these time points 6 were below the LLOQ. Exclusion of data points below LLOQ biases the best fit curve slightly upward and the elimination rate will be slightly under the one estimated (Beal, 2001; Clausen, Tabanera, & Dalgaard, 2005; Krishnamoorthy, Mallick, & Mathew, 2009). The LLOQ was added to demonstrate the relationship of the samples below the LLOQ to the predicted line.
Lidocaine in the equine has been used as a constant infusion. In a 96-hr LD infusion study, LD, MEXG, and glycinexylidide (GX) were quantified and at the terminis of the infusion period, the GX plasma concentration was higher than that of LD and MEXG (De Solis & McKenzie, 2007; Dickey, McKenzie, Brown, & de Solis, 2008). This was not unexpected as MEXG is further metabolized to both GX and 3-hydroxymonoethylglycinexylidine (Harkins et al., 1998). This observation was consistant with our study in that MEXG concentrations were higher than LD in both plasma and urine, but lower than 3-OH.
In horse studies cited, the elimination of LD was not influenced by prolonged infusion and following cessation there was a rapid decline in the plasma concentration. This is contrary to studies in man and dogs. In dogs, daily iv administration did not alter the kinetics of LD elimination (Ngo, Tam, Tawfik, Coutts, & Gray, 1997), but 24 hr continuous infusion as compared to 90 min infusion did reduce clearance due to an impairment of hepatic extraction (LeLorier, Moisan, Gagne, & Caille, 1977). Long-term intravenous infusion of LD (24–36 hr) in human subjects and clearance of LD declined during continuous infusion (Bauer et al., 1982; Nation et al., 1977; Prescott, Adjepon-Yamoah, & Talbot, 1976; Thomson, Elliott, Kelman, Meredith, Whiting, 1987; Thomson, Kelman, de Vane, Hillis, & Whiting, 1987).
Hepatic flow in the horse at rest was reported at 23.8 ml min−1 kg−1 (Dyke, Hubbell, Sams, & Hinchcliff, 1998), which was lower than our reported Cl value of ~38.3 ml min−1 kg−1. In a comparative iv study, the Cl of lidocaine in horses was two times greater (~52.0 vs. ~20.6 ml min−1 kg−1) than in humans. The higher clearance of LD in horses suggests extrahepatic metabolism (Engelking, Lofstedt, et al., 1987). Extrahepatic drug metabolism has been described for LD and major metabolites MEXG and 3-OH when comparing an-hepatic and controls rabbits (Nyberg et al., 1996); studies have also suggested that LD is metabolized by the rat lung (Tanaka, Oda, Asada, Fujimori, & Funae, 1994), and extrahepatic production of MEGX from LD was measured in a an-hepatic female while awaiting liver transplantation (Sallie, Tredger, & Williams, 1992).
4.2 Subcutaneous administration
Following its sq administration, the t½ab of LD was 0.47 hr (28 min) and LD and the three metabolites were quantified in plasma within 2 to 10 min, with Tmax between 20 and 60 min (Table 1). This can also be noted in Figure 3 where the LD metabolites appear very quickly following sq administration. Rapid absorption following sq infiltration of LD was described in earlier studies (Courtot, 1979; Kristinsson, Thordarson, & Johannesson, 1996).
This study describes the absorption of LD from a site over the carpal bone, an area of moderate subcutaneous tissue and vascularity. Following the administration of equal amounts of drug in various locations, it has been shown that the vascularity of the site of injection causes a major difference in the plasma concentration; an obvious comparison was an intercostal vs. an epidural block (Scott, Jebson, Braid, Ortengren, & Frisch, 1972). The specific drug used will also influence the concentrations reached; LD was absorbed more rapidly than prilocaine (Braid & Scott, 1965). Fractional absorption (bioavailability) of sq LD in our study was 87.7 ± 16.7%. It must be pointed out that the data presented were for sq administration in the carpal area; plasma or urine consentrations could be different if injected into areas of lesser or higher blood flow, such as epidural space, and the metatarsal area with a more direct venous flow to the portal circulation.
4.3 Topical administration
The median t½ab and t½e into and from the central compartment for tp LD administration were 8.64 and 3.85 hr, respectively. This was a flip-flop model where the elimination from the central compartment was determined by slow absorption from the site of tp application. In rat study measurements during a 16-hr period, LD concentrations in the dermis, subcutaneous, fascia, and muscle tissues remained high compared to plasma indicating retention in the sq tissues and slow removal. There was also a 25-min lag period before LD penetrated the epidermis and appeared in the receptor compartment (Singh & Roberts, 1994). Compared to the rapid absorption of LD and appearance of metabolites following sq administration, following tp administration, plasma concentrations of LD and 3-OH were quantified at 10 and 45 min for MEXG. Throughout the 72-hr collection period, plasma concentrations remained below 2 ng/ml. Fractional absorption for tp application was 10.2 ± 4.8% compared to 87.7 ± 16.7 for sq LD.
It is difficult to compare various topical administration studies due to the variability in the site, duration, composition, and concentration of the medication. A study in humans tested the absorption of four over-the-counter and compounded topical preparations. Thirty grams of the test preparations were applied over a larger surface area (face and neck) for 60 min. Variability in plasma concentrations was based on the formulation, LD concentrations (2.5%, 4%, and 6%), and subject variation. The peak serum concentrations ranged from ~25 to ~425 ng/ml (Oni, Brown, & Kenkel, 2012). Topical administration studies in other species showed much higher concentration than in our study suggesting slower penetration through equine skin. This may be a function of species variability, where marked differences have been reported in skin layers, follicle density, and other physiological characteristics which account for the differences in transdermal penetration (Mills & Cross, 2006a, 2006b, 2006c). Regional differences have also been reported in the same species, including horse where significantly higher maximum flux was measured when hydrocortisone was applied to skin from the leg, compared to thorax and groin (Mills & Cross, 2006a, 2006b, 2006c; Mills, Magnusson, & Cross, 2004, 2005).
Lidocaine was not detected in the horse following the placement of two patches of 5% lidocaine above the medial aspect of the carpus on both fore limbs. The quantification was by ELISA (Neogen Corporation USA) with a reported sensitivity of 1 ng/ml (Bidwell, Wilson, & Caron, 2007).
In comparison, a lidocaine patch in cats produced steady-state LD and MEGX plasma concentrations of ~0.083 and ~0.012 μg/ml. Overall bioavailability of transdermal lidocaine was ~6.3% and skin concentrations were much higher than plasma at (211 μg/g) (Ko et al., 2008). Lidocaine patches have been used safely in humans and dogs (Gammaitoni et al., 2003; Ko et al., 2007). These differences seen in this equine study may simply be related to the clinical technique used to prepare skin and the formulation used which can significantly affect the rate and extent of penetration of a topically applied drug (Mills & Cross, 2006a, 2006b, 2006c).
Our study was in the intact skin, but creams containing lidocaine/antibiotics are commonly used in the horse for skin lacerations and abrasions, therefore the more common applications are in traumatized surfaces. Chronic leg ulcers were covered for 24 hr with a lidocaine-prilcaine topical cream (EMLA) (25 mg/g). Plasma concentrations in these human patients ranged from 185 to 705 ng/ml between 2 and 4 hr (Stymne & Lillieborg, 2001). In a comparative study, application onto damaged anorectal mucosa (45 mg), median Cmax and Tmax were 73.6 ng/ml and 40 min, compared to normal mucosa where none was detected (Perrotti, Grumetto, Barbato, & Antropoli, 2006; Perrotti et al., 2009). Two groups of mice were compared, one with intact vs lacerated skin. The Tmax was similar, but Cmax ranged from 165.7 to 909.2 ng/ml in the intact vs the lacerated skin (Al-Musawi, Matar, Kombian, & Andersson, 2012).
4.4 Urinary concentrations
The most abundant metabolite in urine in this study was 3-OH and in all three administrations represented ~57% of the total eliminated in urine. Lidocaine represented ~16% of the LD administered, where 4-OH and MEXG represented ~3% and ~24% of the total. It should be noted that the plasma concentrations of 3-OH and MEXG were superimposed, but the urinary concentration of 3-OH was higher than MEXG. MEXG is metabolized to GX and 4-hydroxymonoethylglycinexylidine which were not measured, which would account for lower urinary concentration.
In summary, this study confirms previous studies in the horse that the clearance of LD was higher than the reported hepatic blood flow in horses, which also suggested metabolism at extrahepatic sites. Following sq administration, LD was quantified in plasma within 2 min with comparable clearances from the central compartment for the iv and sq administrations. Following tp application, plasma concentrations of LD and metabolites were all below 2 ng/ml and the fractional absorption was low compared to studies in other species. Despite the low plasma concentration, LD and metabolites were quantified in urine at 72 hr. In this study, only one commercial preparation was used and applied in only one location but compared to studies in other species the absorption was slow and plasma concentrations low.
ACKNOWLEDGMENTS
Supported by the Pennsylvania Department of Agriculture Horse Racing Commission. Authors acknowledge to the technical support of Hillary Randall Goff and Cheryl Kowba.
CONFLICTS OF INTEREST
The authors have no conflicts of interest.
AUTHOR CONTRIBUTION
All authors have read and approved the final manuscript. LRS senior and corresponding author; YY responsible for analytical analysis of data; MAR planning and study coordination; RCB model review.


