Comparison of the effects of cefazolin and ceftriaxone on canine chondrocyte culture
Abstract
Cephalosporins (CEFs) are antibiotics frequently used to treat bone infections and septic arthritis. The effects of CEFs on chondrocytes have not been studied until now. Cefazolin (cef1) and ceftriaxone (cef3), first-and third-generation CEFs, were selected to investigate their direct effects on normal and osteoarthritic (OA) primary canine chondrocytes, which were either nonstimulated or stimulated with the pro-inflammatory cytokine IL-1β. In our results, treatment with CEFs increased the negative effects on both conditioned normal and OA chondrocytes, especially when applied to IL-1β-stimulated cells (inflammatory stimulus). CEFs significantly decreased cell viability and induced apoptotic cell death in both normal and OA chondrocytes; moreover, treatment with cef1 caused necrotic cell death in OA chondrocytes. Cef3 treatment could increase s-GAG synthesis in normal cells preincubated with IL-1β, while cef1 had no significant effect. The expression of TNF was clearly downregulated after cef3 treatments, whereas it was upregulated after cef1 treatments. However, cef3 induced stronger downregulation of TIMP1 and the extracellular matrix component genes COL2A1 and ACAN. In conclusion, these results suggest both the cytotoxic effects of CEFs and their adverse effects on chondrogenic marker genes at the transcriptional level, which provide additional insight into the clinical application of cef1 and cef3.
1 Introduction
Septic arthritis is an infection in a joint caused by microorganisms that have spread to a joint or the synovial fluid. A previous study demonstrated that bacterial lipopolysaccharides (LPS) induced cartilage matrix degradation by degrading collagen and proteoglycan (Jasin, 1983). Moreover, neutrophil proteinases can break down both proteoglycan and collagen in articular cartilage (Starkey, Barrett, & Burleigh, 1977). The infection causes rapid and extensive damage to articular cartilage and bone, depending on host inflammatory cytokines and their immune response (release of lysosomal enzymes) and the invading pathogen (release of bacterial toxins). High cytokine concentrations increase the release of host matrix metalloproteinases including stromelysin (matrix metalloproteinase), as well as gelatinase A/B (proteolytic enzymes) and other collagen-degrading enzymes, which leads to rapid joint destruction and may cause degenerative joint disease, including rheumatoid arthritis or osteoarthritis (OA) (Shirtliff & Mader, 2002).
Treatment of septic arthritis must be prompt and aggressive to prevent damage to the joint, so simultaneous joint lavage procedures and antibiotic medications are needed (Daniel, Akeson, Amiel, Ryder, & Boyer, 1976; Hewes & Macintire, 2011; Mathews et al., 2007). In addition, Hewes and Macintire (2011) considered septic arthritis in dogs to be an emergency situation requiring treatment with intra-articular medication. Broad-spectrum antibiotics such as penicillin, chloramphenicol and cephalosporins (CEFs) are the first choice for bacterial infection; among those drugs, CEFs are the most frequently used in practice (Giguère, Prescott, & Dowling, 2013; Maddison & Watson, 2002). In dogs with septic arthritis, CEFs have been reported as among the drugs of choice because they are broad-spectrum antibiotics, and most bacterial infections are gram-positive cocci (Marchevsky & Read, 1999; Scharf, Lewis, Wellehan, Wamsley, & Richardson, 2015).
CEFs are a class of β-lactam antibiotics, the largest and most diverse family of antibiotics in use today for both humans and animals. Their molecular structure features a β-lactam ring fused with a six-member dihydrothiazine ring (Hornish & Kotarski, 2002; Perez-Inestrosa et al., 2005). Similar to the mechanism of action of other β-lactam antibiotics, CEFs inhibit the synthesis of the peptidoglycan layer forming the rigid cell wall, which ultimately results in bacterial cell lysis and death (Fisher, Meroueh, & Mobashery, 2005; Singh & Arrieta, 1999). Because of their broad antimicrobial activity, favorable pharmacokinetics and low toxicity, CEFs are typically employed for human and veterinary use, including bone and joint infections (Somekh et al., 1996; Ueng et al., 2012), with a lower chance of an allergic reaction when compared to the other β-lactam antibiotics, e.g., penicillin (Campagna, Bond, Schabelman, & Hayes, 2012).
CEFs can be categorized into five generations based on their antibacterial properties (Guglielmo, 2014). Modifications by side chains at the R1 position (C7) of the β-lactam ring generally determine the antibacterial spectrum, while substitutions at R2 (C3) of the dihydrothiazine ring alter the pharmacokinetics and metabolic parameters of the drug (Perez-Inestrosa et al., 2005; Thompson & Jacobs, 1993). CEFs generally cause few side effects, and reports of adverse reactions or toxicity have been limited (Norrby, 1987; Thompson & Jacobs, 1993). However, subtle differences in chemical structure and pharmacokinetics also can influence the potential for adverse effects (Thompson & Jacobs, 1993), including drug interactions when used in combination with other medications (Gupta, Sturrock, & Field, 2001; Norrby, 1986).
The disease itself and the medical conditions of the infection are important factors that affect joint damage and increase the risk of developing OA. Therefore, the necessary information concerning the direct effects of CEFs on chondrocytes is required. The first-generation and third-generation cephalosporins, cefazolin (cef1) and ceftriaxone (cef3) were used as representatives of first- and third-generation CEFs in this study at their IC50 concentration. We conducted an analysis of extracellular matrix (ECM) macromolecule release, cell viability, apoptosis and necrosis, and gene expression changes to determine and compare the effects of the two different generations of CEFs in normal and OA primary canine chondrocytes under various treatment conditions.
2 Materials and Methods
2.1 Sample collection, chondrocyte isolation and culture
Both normal (no OA lesions) and OA-lesion canine articular cartilage samples were prepared from stifle and carpal joints of 3-to 5-year-old dogs weighing ~10–20 kg (8 joints of two individual dogs, and from each joint one cell culture was grown). Samples were purchased from the Veterinary Cadaveric Unit, Faculty of Veterinary Medicine, Chiang Mai University, Chiang Mai, Thailand. All patients had suffered an accident or other disease that did not involve the musculoskeletal system. Samples were placed on ice and taken to the laboratory as soon as possible. Normal and OA cartilage were categorized according to OARSI guidelines (Cook et al., 2010). In brief, the detailed nature of the surface of articular cartilage was observed after the joint was opened. Normal cartilage should have a completely smooth surface. If some abnormality was found, such as fibrillation/roughening of the articular surface, cartilage erosion or osteophyte formation, it was categorized as OA cartilage. Then, pieces of cartilage were sliced and an enzymatic treatment was used to isolate cells for culture (Siengdee et al., 2010). Briefly, cartilage disks were washed three times with phosphate-buffered saline (PBS) containing 10× of a routine antibiotic dose of 2000 U ml−1 of penicillin, 2000 μg ml−1 of streptomycin and 200 μg ml−1 of gentamicin. Cartilage disks were then chopped into pieces of approximately 1–2 mm2. After that, samples were digested in low-glucose Dulbecco's modified Eagle's medium (DMEM) (Invitrogen™; Thermo Fisher Scientific, Waltham, MA, USA) supplemented with 10% collagenase type II (Sigma-Aldrich, St. Louis, MO, USA) for 21 hr. The pieces of cartilage were transferred from 60-mm culture dishes to 75-cm2 cell culture flasks, further washed once in PBS and then re-suspended in growth medium containing 10% fetal calf serum (FCS; PAA Laboratories, Pasching, Austria) together with 200 U ml−1 of penicillin, 200 μg ml−1 of streptomycin and 20 μg mL−1 of gentamicin. The media were changed twice a week. Migrated cells from the cartilage were trypsinized with a 0.25% trypsin–EDTA solution (Thermo Scientific/HyClone, Logan, UT, USA) and used for experiments at the second passage. All cultures were maintained under normal culture conditions at 37°C, 5% CO2 and 95% relative humidity.
2.2 MTT assay for cell cytotoxicity
Chondrocytes were grown at a density of 10,000 cells/well in 96-well plates and cultured in growth medium for 24 hr. A first-generation cephalosporin, cefazolin sodium (cef1), a derivative of cefazolin (Kasumluk Chemical, Chon Buri, Thailand), and a third-generation cephalosporin, ceftriaxone sodium (cef3), a derivative of ceftriaxone (Utopian Co., Samut Prakan, Thailand), were dissolved in sterile deionized water to a concentration of 100 μg μl−1. After that, serial dilutions from stock solutions of drugs were used to treat both normal and OA cells in triplicate. The final concentrations are listed in Table 1. After incubation for 48 hr, treated cells were washed with PBS and then added to a working MTT solution, DMEM containing 5 mg ml−1 MTT (3-[4,5-dimethylthiazol-2-yl]-2,5-diphenyltetrazolium bromide), followed by incubation at 37°C and 5% CO2 for 4 hr. Wells of normal medium (without MTT) served as blank controls. Lastly, 100 μl dimethyl sulfoxide (DMSO) was added to each well, followed by shaking for 5 min before measuring absorbance at OD540 using a Gemini fluorescence microplate reader (Biocompare, San Francisco, CA, USA). The absorbance of the blank was subtracted from each sample value, and the reduction in the viability of cells was expressed as a percentage compared with negative control cells (cultured in growth media without drugs). From histograms, the 50% inhibitory concentration (IC50) value for each drug on primary chondrocytes was determined by generating an equation, Y = mx + C, in which Y stands for % inhibition, x = concentration, C = constant and m = coefficient.
| CEFs | Dilution | |||||||||||
|---|---|---|---|---|---|---|---|---|---|---|---|---|
| 1:2 | 1:4 | 1:6 | 1:8 | 1:10 | 1:12 | 1:14 | 1:16 | 1:18 | 1:20 | 1:22 | 1:24 | |
| Cefazolin (cef1) (100 μg μl−1) | 50000.0 | 25000.0 | 16666.7 | 12500.0 | 10000.0 | 8333.3 | 7142.9 | 6250.0 | 5555.6 | 5000.0 | 4545.5 | 4166.7 |
| Ceftriaxone (cef3) (100 μg μl−1) | 50000.0 | 25000.0 | 16666.7 | 12500.0 | 10000.0 | 8333.3 | 7142.9 | 6250.0 | 5555.6 | 5000.0 | 4545.5 | 4166.7 |
2.3 Experimental design and cell treatment
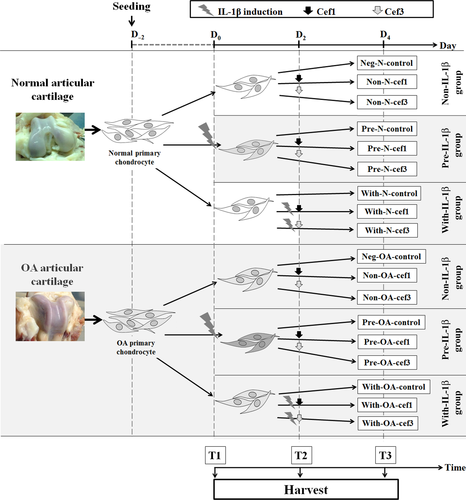
When chondrocytes reached sub-confluence in a 6-well plate, normal and OA chondrocytes were divided into three major categories: (i) Non-IL-1β—normal or OA cells exposed to CEFs at IC50; (ii) Pre-IL-1β—normal or OA cells preincubated with recombinant human IL-1β, an inflammatory cytokine used to induce inflammation, followed by exposure to CEFs at IC50; and (iii) With-IL-1β—simultaneous co-treatment of normal or OA cells with IL-1β and CEFs at IC50. In total, including negative control groups for each cell condition, there were 18 groups of cell treatments. All cell treatment groups and negative control groups were cultured in DMEM supplemented with 5% FBS (fetal bovine serum) and incubated under normal culture conditions. Recombinant human IL-1β was purchased from Bio-Techne/R&D Systems (Minneapolis, MN, USA) and used at a final concentration of 10 μg ml−1;. The cell groups and the conditioned medium were collected at T3 (96 hr after the start of treatment). Cells were investigated for viability, apoptosis and gene expression, and conditioned medium was stored at −20°C for later monitoring of the release of sulfated glycosaminoglycans (s-GAG). The experimental design is shown in Figure 1. Experimental codes for the treatment conditions are presented in Table 2.
| Normal chondrocytes | OA chondrocytes | ||||
|---|---|---|---|---|---|
| No. | Name | No. | Name | Cell conditions | Treatment conditions |
| 1 | Neg-N-control | 10 | Neg-OA-control | Without IL-1β (control) | DMEM with 5% FBS |
| 2 | Non-N-cef1 | 11 | Non-OA-cef1 | Without IL-1β | First-generation CEF at IC50 |
| 3 | Non-N-cef3 | 12 | Non-OA-cef3 | Without IL-1β | Third-generation CEF at IC50 |
| 4 | Pre-N-control | 13 | Pre-OA-control | Pre-IL-1β-induced | DMEM with 5% FBS |
| 5 | Pre-N-cef1 | 14 | Pre-OA-cef1 | Pre-IL-1β-induced | First-generation CEF at IC50 |
| 6 | Pre-N-cef3 | 15 | Pre-OA-cef3 | Pre-IL-1β-induced | Third-generation CEF at IC50 |
| 7 | With-N-control | 16 | With-OA-control | Simultaneous treatment with IL-1β and DMEM | DMEM with 5% FBS |
| 8 | With-N-cef1 | 17 | With-OA-cef1 | Simultaneous treatment with IL-1β and cephalosporin | First-generation CEF at IC50 |
| 9 | With-N-cef3 | 18 | With-OA-cef3 | Simultaneous treatment with IL-1β and cephalosporin | Third-generation CEF at IC50 |
2.4 DMMB assays for s-GAG content determination
The s-GAG content (released by chondrocytes into the conditioned medium) was determined by DMMB (1,9-dimethylmethylene blue) dye-binding assay, modified from a previously described method (Siengdee et al., 2010). Briefly, 50 μl of conditioned medium or standard (chondroitin 6-sulfate, 0–20 μg ml−1) was assayed in 96-well plates following the addition of DMMB dye solution (200 μl). Serum-free medium was used as a blank. Total s-GAG content was determined from a spectrophotometric reading of the conditioned medium at 540 nm. The change in the value of s-GAG was calculated as a percentage of s-GAG content relative to the negative control group of each cell type.
2.5 Cell viability and apoptosis assays
Chondrocyte apoptosis and necrosis were assessed using a Muse® Caspase-3/7 Assay Kit and Muse® Cell Analyzer (Merck Millipore, Darmstadt, Germany) following the manufacturer's instructions for flow cytometry, as previously described (Siengdee, Euppayo, Buddhachat, Chomdej, & Nganvongpanit, 2016). Briefly, the cells were trypsinized to produce a single-cell suspension using 0.25% trypsin/EDTA. After centrifugation and washing, the cells were then re-suspended in 1× assay buffer at a concentration of ~3 × 10⁵ cells ml−1. The kit permits simultaneous evaluation of apoptotic status and cell death by caspase-3 and caspase-7 activation and a dead cell marker, 7-aminoactinomycin D (7-AAD). The stained samples were then run on the Muse Cell Analyzer; 20,000 events were analyzed on each run. Lidocaine, which is known to induce apoptosis via the mitochondrial pathway, was tested (5% and 10%) as positive controls (Grishko, Xu, Wilson, & Pearsall, 2010), while cells without IL-1β and CEF treatment served as a negative control. The experiment was repeated, with three bio-replicates and five separate trials. Four populations of cells were distinguished in this assay. Cells that stained positive for caspase-3/7 and negative for 7-AAD were considered to be undergoing early-stage apoptosis. Cells that stained positive for both caspase-3/7 and 7-AAD were considered to be either undergoing late-stage apoptosis or dead cells. Cells that stained negative for caspase-3/7 and positive for 7-AAD were considered to be undergoing necrosis. Lastly, those that stained negative for both caspase-3/7 and 7-AAD were considered to be living cells. The relative percentages of living cells, early- and late-stage apoptotic cells, and necrotic (dead) cells were calculated using the provided software.
2.6 RNA extraction and quantitative real-time PCR (qPCR)
Total RNA was isolated from conditioned cells harvested at T3, using an innuPREP DNA/RNA Mini Kit (Analytik Jena, Jena, Germany) according to the supplementary protocol. Total RNA was eluted using 30 μl of RNase-free water. The quality and quantity of the RNA samples were checked and measured using a NanoDrop® ND-1000 Spectrophotometer (Thermo Fisher Scientific, Waltham MA, USA). Total (DNase-treated) RNA was reverse-transcribed into cDNA using 200 U of Tetro reverse transcriptase enzyme (Bioline, Taunton MA, USA) and 10 mm of oligo(dT) primer in a total reaction volume of 20 μl. The qPCR was performed according to the manufacturer's recommendations in 10 μl reactions using 2× SensiFAST SYBR® No-ROX Mix (Bioline) and 25 ng cDNA/reaction well on an Eco™ Real-Time PCR system (Illumina, San Diego CA, USA). Ten genes were selected (IL1B, PTGS1, PTGS2, TNF, NFKB1, MMP3, MMP9, TIMP1, SOX9, COL2A1 and ACAN); the primer sequences are listed in Table 3. The thermal cycler program was 10 min at 95°C, followed by 45 cycles of 20 sec at 95°C and 30 sec at 60°C. All reactions were run in duplicate using RNA isolated from three bio-replicates of the samples. Dissociation curve analysis was performed immediately after the last PCR amplification cycle. The expression value was normalized to two reference control genes, HPRT1 and GAPDH. Relative quantification was carried out using the 2−ΔΔCT threshold cycle (Ct) method (Livaka & Schmittgen, 2001).
| Gene symbol | Gene name | Ref. seq. (mRNA) | Primer seq. (5′→ 3′) | |
|---|---|---|---|---|
| IL1B | Interleukin-1 beta | NM_001037971.1 | Fp | GGATGGAAAGCCCACCCTAC |
| Rp | TCCTGGCCACCTCTGGTATT | |||
| PTGS1 | Prostaglandin endoperoxide synthase 1 | NM_001003023 | Fp | GGATGGAGAGATGTAC |
| Rp | CCCAATGAGGATGAGTCGGG | |||
| PTGS2 | Prostaglandin endoperoxide synthase 2 | NM_001003354.1 | Fp | GGAGCATAACAGAGTGTGTGATGTG |
| Rp | AAGTATTAGCCTGCTCGTCTGGAA | |||
| NFKB1 | Nuclear factor of kappa light polypeptide gene enhancer in B-cells 1 | NM_001003344.1 | Fp | AAACTGGGCTACTCTGGCAC |
| Rp | GGCCTCCACCAGCTCTTTTA | |||
| TNF | Tumor necrosis factor | NM_001003244.4 | Fp | TAGCAAACCCCGAAGCTGAG |
| Rp | TACAACCCATCTGACGGCAC | |||
| COL2A1 | Collagen, type II, alpha 1 | NM_001006951.1 | Fp | CAGCGAGCGTTCCCAAGA |
| Rp | CAGGCGGAGGAAGGTCAT | |||
| ACAN | Aggrecan | NM_001113455.1 | Fp | GACCATGTCGTGCAGGTGAC |
| Rp | ACTGCTCCAGGCGTGTGATG | |||
| MMP3 | Matrix metallopeptidase 3 (stromelysin 1, progelatinase) | NM_001002967.1 | Fp | GGTTGGAGGTGACAGGGAAG |
| Rp | CCAGGGAAGGTGGTGAAGTC | |||
| MMP9 | Matrix metallopeptidase 9 | NM_001003219.2 | Fp | TTTCGCTATGGCTACACTCAA |
| Rp | TGCTCCCTAACACCAAACTGA | |||
| TIMP1 | TIMP metallopeptidase inhibitor 1 | NM_001003182.1 | Fp | GGACGGACACTTGCAGATCA |
| Rp | TGCAGGGGATGGATGAACAG | |||
| SOX9 | SRY-box 9 | NM_000346.3 | Fp | ACACACAGCTCACTCGACCTTG |
| Rp | GGAATTCTGGTTGGTCCTCTCTT | |||
| HPRT1 | Hypoxanthine phosphoribosyltransferase 1 | NM_001003357.1 | Fp | CCTTGGCGTCGTGATTAGTG |
| Rp | CCGCTCAGTCCTGTCCATAA | |||
| GAPDH | Glyceraldehyde-3-phosphate dehydrogenase | NM_001003142.1 | Fp | AGTATGATTCTACCCACGGC |
| Rp | CGAAGTGGTCATGGATGACT | |||
2.7 Statistical analysis
Differences between groups were statistically analyzed using one-way analysis of variance (ANOVA) with Tukey's post hoc test. Statistical significance was set at p < .05. The software package SPSS 14.0 for Windows (SPSS, USA) was used for computations. Data were expressed as the mean ± standard deviation (SD) of three independent experiments.
3 Results
3.1 Cytotoxicity of CEFs on primary chondrocytes
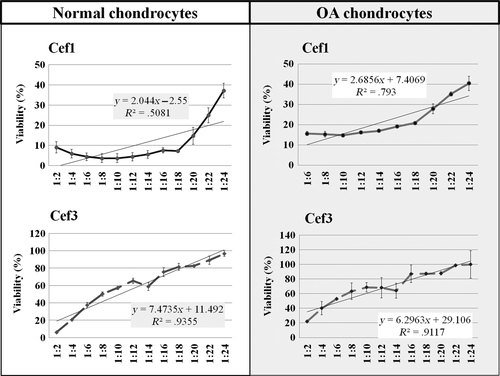
The survival rates of normal and OA canine primary chondrocytes were determined by MTT assay at 48 hr posttreatment with first- and third-generation CEFs. The percentages of cell viability in the control groups of normal and OA chondrocytes cultured in growth media were 98.17 ± 8.73% and 91.43 ± 13.02%, respectively. As shown in Figure 2, the IC50 of cef1 for normal and OA chondrocytes was approximately 2.0 mg ml−1 and 3.33 mg ml−1, respectively, while the IC50 of cef3 for normal and OA chondrocytes was approximately 10.0 mg ml−1 and 12.5 mg ml−1, respectively. The results showed that when comparing between cells, normal chondrocytes were more sensitive to CEFs than OA cells, and when comparing between CEFs, cef1 had a stronger inhibitory effect than cef3, in a dose-dependent manner.
3.2 Cell viability and apoptosis assays
In this study, stimulation of both normal and OA chondrocytes with IL-1β for 48 hr had no effect on cell viability, apoptotic rate and total dead cells when compared with negative control cells. Figure 3a illustrates the effects of CEF treatment for 48 hr on canine chondrocyte cell viability. The number of viable cells significantly decreased (p < .05) in both normal and OA chondrocytes after exposure to CEFs, and there was a marked decrease in IL-1β-induced (Pre and With) OA chondrocytes exposed to cef1: 61.41 ± 6.27% and 62.24 ± 6.30% in Pre-OA-cef1 and With-OA-cef1 groups, respectively. When comparing between cef1 and cef3, cef1 more strongly decreased the percentage of chondrocyte viability; lower percentages of chondrocyte viability were found, especially in OA chondrocyte groups. Nevertheless, only the With-N-cef1 group showed a significant decrease in viability (64.44 ± 2.67%) compared with cef3 treatments of both normal and OA chondrocytes. There was no significant difference between the negative controls of normal and OA cells, and all cell treatment groups had higher percentages (p < .05) of cell viability than the positive control (10% lidocaine).
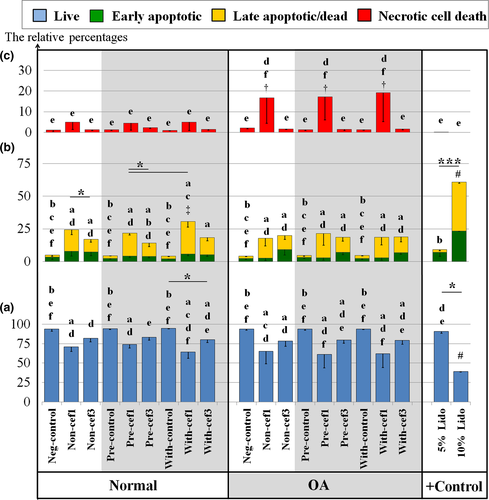
The percentage of apoptotic cells is shown in Figure 3b; the green bars denote early apoptosis, and the yellow bars denote late apoptosis. No significant difference was found between the negative controls of normal and OA cells. The highest percentage of total apoptotic cells was 30.62 ± 1.48% in the With-N-cef1 group, as compared with the negative control of normal cells (5.02 ± 0.82%) (p < .05). Similar to the percent viability results, treatment with CEFs induced more total apoptotic cells in all cell treatment groups (Non-, Pre- and With-IL-1β-stimulation of both normal and OA chondrocytes), primarily late apoptosis.
The percentage of dead cells is shown in Figure 3c. Treatment with cef1 induced a higher percentage of necrotic cell death in OA chondrocytes (p < .05) for all treatments (Non, Pre and With); the highest was about 19.2 ± 4.94% in the With-OA-cef1 group (p < .05).
3.3 Release of s-GAG molecules
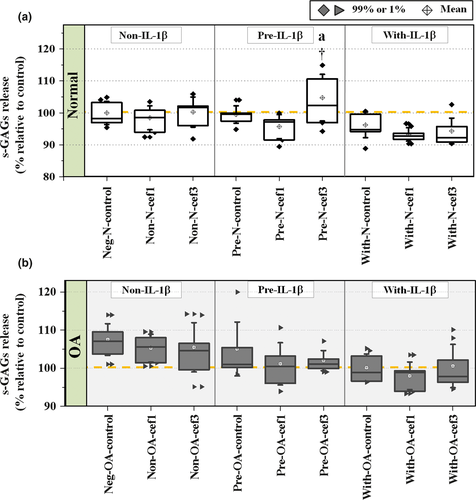
To evaluate the effect of CEFs on s-GAG produced from chondrocytes during the experimental culture period, concentrations of s-GAG in the culture media were calculated as a percentage of s-GAG relative to the negative control groups (Figure 4). Exposure of Pre-IL-1β-induced normal cells to cef3 (Pre-N-cef3) significantly increased s-GAG levels compared with the negative control of normal cells (p = .047) and all other treatments of normal cells. Although the percentage of s-GAG levels generally tended to decrease in IL-1β-induced cells (Pre and With groups) of both normal and OA chondrocytes, there were no significant differences found between treatments and between normal and OA chondrocytes except for the Pre-N-cef3 group. Also, there was no statistically significant difference between the negative controls of normal and OA chondrocytes (96.12 ± 1.40% and 103.31 ± 1.02%, respectively).
3.4 Effects of CEFs on articular cartilage genes
The effects of CEFs on the expression levels in conditioned chondrocytes of some genes that code for cytokines and enzymes involved in inflammatory pathways are shown in Figure 5.
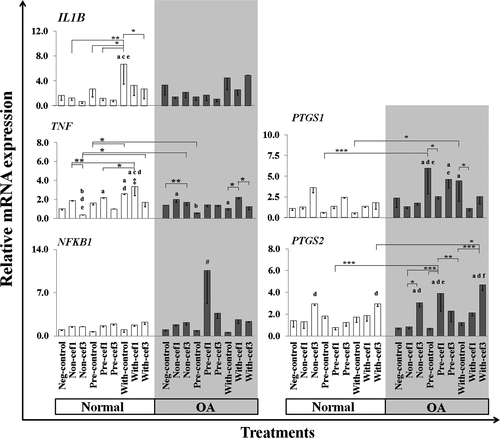
Effects of CEFs on IL1B and TNF—Treatment of normal chondrocytes with IL-1β for a shorter time (With-control group) significantly induced upregulation of IL1B gene expression compared with the other normal chondrocyte treatments. CEF treatments significantly induced IL1B downregulation in all conditioned normal chondrocytes, especially in the With-cef3 group (p = .02) compared with the With-control group. The expression of TNF was significantly upregulated mostly in the cef1 treatment group compared with the control groups, but was downregulated in cef3 treatment groups in comparison with cef1, especially in normal chondrocytes, and also in comparison with the normal control groups. The highest expression level of TNF was in the With-cef1 treatment group of normal cells, a significant increase compared with the negative control and all cef3 treatments of normal cells, and all OA treatment groups (p < .05).
Effects of CEFs on NFKB1, PTGS1 and PTGS2—Treatment with CEFs tended to induce upregulation of NFKB1 transcription factor expression and was extremely upregulated only in Pre-cef1-treated groups of OA cells compared with all other treatment groups of both normal and OA chondrocytes. CEFs tended to have selective effects on the expression levels of PTGS1 and PTGS2 genes in OA chondrocytes; however, no statistically significant differences were found between normal chondrocyte groups. For PTGS1, treatment of OA chondrocytes with IL-1β only (Pre and With) significantly induced upregulation of PTGS1 expression compared with IL-1β-treated normal chondrocytes and the OA negative control. CEFs treatments reduced the expression levels of PTGS1 in IL-1β-stimulated OA cells (Pre and With), but a significant difference was found only in Pre-OA-cef1 and With-OA-cef1 compared with their control groups and the corresponding negative controls of normal cells. PTGS2 expression was upregulated in OA cells. Simultaneous treatment of OA chondrocytes with IL-1β and cef3 (With) significantly induced PTGS2 upregulation compared with Pre-OA-control and Pre-OA-cef3, while PTGS2 was significantly upregulated in cef3 treatments compared with the negative controls and Non-cef1 and With-cef1 normal and OA chondrocyte groups.
Effects of CEFs on ECM component genes——Some important coding genes, SOX9 (transcription factor) and ECM component genes COL2A1 and ACAN, which regulate anabolic pathways in articular cartilage, were examined (Figure 6). The expression level of SOX9 was downregulated in every treatment group compared with the negative control of normal cells. In normal cells, the expression level of SOX9 in the Non-cef1 group of was close to that of the Neg-control, and the lowest expression was found in Pre-cef3. COL2A1 was upregulated in Pre-IL-1β-stimulated normal chondrocytes compared with the negative control of normal cells, whereas the expression levels of COL2A1 decreased in every treatment group of OA cells. The expression was significantly different when comparing the negative control of normal and OA chondrocytes p = 9.188E-14. Treatment with CEFs resulted in highly decreased expression of COL2A1 in Non and Pre groups of normal chondrocytes and in Pre-IL-1β-stimulated OA chondrocytes when compared with their conditioned controls. However, COL2A1 levels in Non- and Pre-IL-1β-stimulated normal chondrocytes treated with cef1 still were higher than the negative control of OA cells (Non-N-cef1 compared with Neg-OA-control, p = .011; and Pre-N-cef1 compared with Neg-OA-control, p = .049), whereas cef3 treatment induced downregulation of COL2A1 expression in OA chondrocytes compared with the Neg-OA-control group and in Non and Pre treatments of normal chondrocytes. The expression of ACAN was downregulated in IL-1β-stimulated cells in both normal and OA chondrocytes, and there was no significant difference found between the negative control groups of normal and OA cells. Similar to the COL2A1 gene, CEF treatments induced downregulation of ACAN expression when compared with their conditioned controls, especially those treated with cef3 compared with cef1 and the negative controls. The one notable exception was the With-OA-cef1 group, which exhibited higher expression levels compared with all cef3-treated groups.
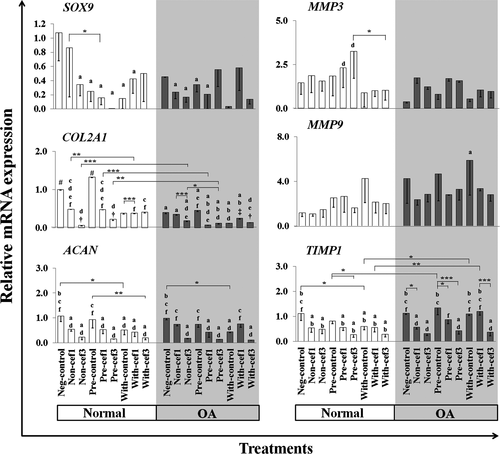
Effects of CEFs on the differential expression of MMP3, MMP9 and TIMP1——There was a different trend of MMP3, MMP9 and TIMP1 expression between cef1 and cef3 treatments in all conditioned cells. CEF treatments tended to increase the expression of MMP3, which was significantly upregulated in Pre-cef3 treatment of normal cells compared with With-cef3 (p = .024) and the Neg-OA-control (p = .004). Contrary results were found for MMP9 genes; MMP9 was highly expressed in IL-1β-stimulated groups, especially in OA chondrocytes. Most of the CEF treatment groups exhibited lower expression levels of MMP9 compared with their control groups, but no statistically significant difference was found. Consistent with the results for COL2A1 and ACAN, CEF treatments significantly downregulated TIMP1 expression for every cell condition (Non, Pre and With) in both normal and OA chondrocytes, especially cef3 treatments. The one exception was the With-OA-cef1 group, which exhibited higher expression levels compared with the With-OA-cef3 control and Neg-OA control groups.
4 Discussion
Primary canine chondrocytes were used as a model to examine and compare the direct effects of cef1 and cef3 on chondrocytes in vitro. IL-1β was used to study the effects of CEFs on preconditioned chondrocytes, mimicking the initial inflammatory environment from pro-inflammatory bacterial compounds in joint infections (Roland & Helmut, 2002). Our previous study described the characteristics of primary canine chondrocytes after stimulation with IL-1β, which induced changes in the expression of catabolic mediators, i.e., inflammation, cytokines/chemokines, and matrix degradation (Siengdee et al., 2016). Overall, we investigated the effects of two CEFs, with different molecular structures, on Non-and IL-1β-stimulated normal and OA canine chondrocytes, which resulted in differences in toxicity induction, s-GAG synthesis and gene expression level.
Several findings and suggestions can be collected from the present study. (i) Comparison of normal and OA chondrocytes. Only the level of COL2A1 expression was found to be statistically significantly different between normal and OA cells, while no significant differences were found between the two cell types for s-GAG level, cell viability, apoptotic rate and necrotic rate of cells. Inflammatory stimulation (Pre or With) of normal and/or OA chondrocytes altered the expression of genes encoding pro-inflammatory cytokines and mediators, IL1B, TNF and PTGS1, as well as cartilage markers, COL2A1, MMP9, ACAN, SOX9 and TIMP1. (ii) Cytotoxicity of CEFs. Cytotoxicity was induced by CEFs; normal chondrocytes were more sensitive to CEFs than OA cells. The apoptotic effects of cef1 were more apparent in normal canine chondrocytes, but induced more total cell death (necrotic cell death) in OA chondrocytes, especially when IL-1β was added to the cells together with cef1. Cef3 had similar apoptotic actions on both normal and OA chondrocytes but did not stimulate necrotic cell death. (iii) Effects of CEFs on s-GAG and gene expression levels. Comparing between the two generations of CEFs in this study, treatment of IL-1β-stimulated normal chondrocytes with cef3 caused an increase in production of s-GAG. The expression of some pro-inflammatory cytokines was reduced when IL-1β was added to the cells along with cef3: IL1B (in the With-normal group) and TNF (in With-normal/With-OA groups). Conversely, cef1 clearly induced TNF upregulation. These findings suggest that cef3 may be more appropriate for use as an antibiotic in septic arthritis, and occasionally when treating presumed OA and preexisting inflammatory arthritis. However, a serious concern about the effects of cef3 is that it suppressed activation of anabolic and anti-catabolic mediators and promoted the expression of catabolic mediators.
The first-generation and some second-generation CEFs maintain excellent activity against streptococci and staphylococci, while the third-generation agents have greater gram-negative antimicrobial effectiveness and coverage, and expanded activity against anaerobes (Guglielmo, 2014; Klein & Cunha, 1995; Thompson & Jacobs, 1993). In humans, first-generation CEFs are commonly used before an operation as a preventative measure against infection after surgery, and third-generation CEFs are recommended for serious infections caused by susceptible organisms that are resistant to the first and second generation (Brophy, Scarlett-Ferguson, Webber, Abrams, & Lammon, 2010). They are similarly used in dogs and cats, particularly in orthopedic surgery (Sykes, 2013). However, cross-sensitivity between penicillin and first- and second-generation CEFs has been reported in penicillin-allergic patients, due to similarities in the R1 side chain structure (affecting approximately 10% of human patients) (Campagna et al., 2012; Moreno et al., 2008), but there is very low (less than 5%) cross-sensitivity between penicillin and third-generation CEFs (Ouellette & Joyce, 2010). Hypersensitivity reactions can also occur in dogs and cats, so CEFs should be used with caution in animals (Sykes, 2013).
In general, CEFs cause few side effects, and there have been few scientific reports of adverse reactions or their toxicity. The safe use of cef1 and cef3 in human peritoneal mesothelial cells (HPMC) compared with the same generation CEFs, cephalothin (first) and cefotaxime (third), has been reported (Fang et al., 2003). A comparison of the effectiveness of cef1 and cef3 also has been studied in porcine kidney endothelial cells (Bruinsma et al., 2013), and the safety and efficacy of cef3 have been well established in many species and many types of cells (Baggot, 1998; Hornish & Kotarski, 2002), e.g., primary neuronal cultures of neonatal rats (Tikka, Usenius, Tenhunen, Keinänen, & Koistinaho, 2001), Wistar rats (Amin, Hajhashemi, Abnous, & Hosseinzadeh, 2014) and dogs (Rebuelto et al., 2002).
In contrast to some of the aforementioned studies, the results of our experiments (i.e., MTT assay) exposed the potential cytotoxicity of CEFs and suggested that normal chondrocytes were more sensitive to CEFs than OA cells. Cef1 had a more potent negative effect on chondrocyte viability than cef3, in a dose-dependent manner. Further confirming the cytotoxicity of CEFs, we detected the caspase-3/7 markers by flow cytometry. Treatment with both cef1 and cef3 decreased cell viability and induced more total apoptosis of both normal and OA canine chondrocytes in all conditioned cells. Of these, cef1 exhibited potential pro-apoptoticity with high selectivity in normal cells, especially when the cells were exposed to cef1 and the cytokine IL-1β at the same time. Moreover, cef1 also induced more necrotic cell death in all conditioned OA chondrocytes, especially when treated at the same time with IL-1β.
However, subtle differences in the chemical structure and pharmacokinetics of CEFs can influence their potential for cell toxicity and adverse effects (Perez-Inestrosa et al., 2005; Thompson & Jacobs, 1993). Some CEFs contain N-methyl-thiotetrazole (N-MTT) or N-methyl-thiadiazole (N-MTD) in their structures (cef1 contains both MTT and MTD) (Figure 7), with similar moiety and which release a heterocyclic living group as a metabolic by-product that increases the potential for bleeding or hematologic toxicity and can cause hypoprothrombinemia (Kerremans, Lipsky, Van Loon, Gallego, & Weinshilboum, 1985; Thompson & Jacobs, 1993; Wood, Johnson, Naylor, & Weinshilboum, 2002). Moreover, clinical manifestations of neurotoxicity and encephalopathy induced by CEFs have been well documented (Grill & Maganti, 2011) and are attributed to decreased gamma aminobutyric acid (GABA) release and increased excitatory amino acid release, as well as inducing endotoxin release which generates cytokine (e.g., TNF-α) release. Of the CEFs, cefazolin is among those most often reported to be a high-risk agent associated with neurotoxicity (Grill & Maganti, 2008, 2011), whereas a rare case of ceftriaxone (low-risk agent)-induced encephalopathy was also observed (Roncon-Albuquerque et al., 2009). Previous studies have suggested a possible explanation for the cytotoxicity of CEFs. Stone et al. (2004) reported that due to the chemical structure at the R2 position (Figure 7), some CEFs release the toxophore triclosan, or analogs of triclosan, through hydrolysis of the β-lactam ring, with adverse effects on the cell membrane which are associated with mammalian cytotoxicity. These findings suggest the possibility that both cef1 and cef3 may induce toxicity in primary canine chondrocytes. Furthermore, this is the first report, showing that cef1 and cef3 induced chondrocyte cell death; in particular, treatment with cef1 in cultured OA chondrocytes caused necrotic cell death. However, the mechanisms of CEF-induced cell apoptosis remain unknown.
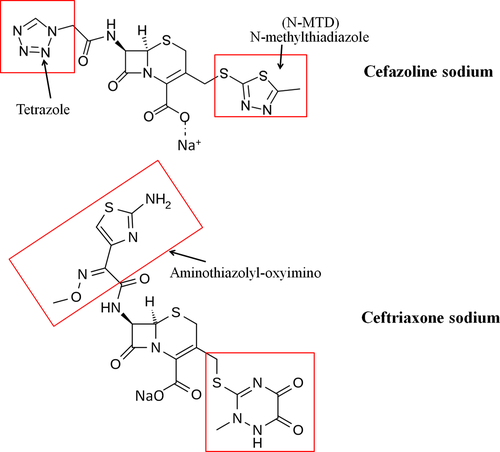
Recently, cefodizime and ceftiofur (third-generation CEFs), which contain oxyimino-aminothiazolyl at the R2 position, similar to cef3 (Figure 7), have been discovered to modulate the release of inflammatory cytokines (Ci et al., 2008; Van Vlem, Vanholder, De Paepe, Vogelaers, & Ringoir, 1996) by inhibiting the phosphorylation of mitogen-activated protein kinase (MAPK) pathways, including extracellular signal-regulated kinases (ERKs), p38 (stress-activated protein kinases) and c-Jun NH2-terminal kinases (JNKs), which in turn may inhibit production of inflammatory cytokines by blocking NF-κB in RAW264.7 cells (Ci et al., 2008). Inhibition of MAPK signaling, which regulates key activities such as cell division, differentiation, migration and apoptosis, as well as alterations in gene expression and intracellular metabolism in chondrocytes (Katz, Amit, & Yarden, 2007), results in the loss of cell function and may lead to pronounced ECM degradation in articular cartilage (Lei, Xiao-juan, Zhengke, & Qian, 2006). Moreover, cef3 has been reported to directly bind to and inhibit Aurora B kinase and suppress the activity of lung cancer cell lines, resulting in cell cycle arrest or even cell death (Li et al., 2012).
Our data are consistent with other studies showing the in vivo and in vitro nephrotoxicity of cef1 (Tune & Fravert, 1980). Cef1 has a necrotic effect on proximal kidney tubules, based on histopathological examinations and (UDP)-glucose:glycoprotein glucosyltransferase (uGGT) analysis (Yilmaz, Cabalar, & Ozbilgin, 1999); elevated creatinine and renal tubular necrosis were also reported in rabbits (Wold, Joost, & Owen, 1977). However, the mechanisms of cef1-induced cell necrosis remain incompletely understood. Some previous reports have suggested that CEF-induced chondrocyte apoptosis and necrosis may depend on the activity of p38 (MAPK) within cells, and downregulation of ECM genes induced by cef3, as found in the present study, which may lead to the later development of OA.
This is the first report, showing that CEFs regulate s-GAG production. Comparing between cef1 and cef3 treatments, we found that treatment of Pre-IL-1β-stimulated normal cells with cef3 increased s-GAG production, which may reflect new matrix synthesis, while treatment with cef1 had no substantial effect on s-GAG production. There is no existing literature supporting this result. Primary cellular responses in OA cartilage start with upregulation of inflammatory cytokines, such as IL-1 and TNF, which act to increase synthesis of the matrix metalloproteinase family (MMPs), decrease MMP enzyme inhibitors, and decrease extracellular matrix synthesis (Sandell & Aigner, 2001). However, no single cytokine can stimulate all the metabolic reactions observed in OA, as well as the different expression patterns of chondrogenic marker genes (Attur, Krasnokutsky-Samuels, Samuels, & Abramson, 2013).
In this study, we observed the effects of CEFs on gene expression levels in chondrocytes. Treatment with either cef1 or cef3 significantly induced IL1B downregulation in all conditioned normal chondrocytes. The expression of TNF was clearly downregulated after cef3 treatments but upregulated after cef1 treatments, similar to NFKB1 which was extremely upregulated in cef1-treated Pre-IL-1β-stimulated OA cells. Cef1 and cef3 treatment tended to increase the expression of the critical matrix-degrading gene MMP3 but decrease the expression of MMP9 compared with their control groups. Cef1 and cef3 treatments, especially cef3 treatments, decreased the expression of COL2A1, ACAN and TIMP1 in nearly every treatment group of both normal and OA chondrocytes. Our results suggest that cef1 may activate chondrocyte apoptosis and necrosis by inducing TNF upregulation, modulating the expression of catabolic factor MMPs, decreasing the expression of key matrix molecules of cartilage encoded by ACAN and COL2A1 and downregulating TIMP1, an inhibitor of matrix-destructive enzymes. On the other hand, cef3 reduced the expression of IL1B and TNF in specific cell treatment conditions. Treatment with cef3 also caused downregulation of gene expression of cartilage matrix proteins and tissue inhibitors of metalloproteinases in both normal and OA chondrocytes, which may increase chondrocyte apoptosis and induce the development and progression of OA (Sandell & Aigner, 2001).
As discussed above, chemical composition determines differences in antimicrobial and cytotoxic activities between different members of each drug generation. The results of the present study provided basic information on the use of cef1 and cef3 in different conditioned chondrocytes. However, further in vivo and clinical studies are needed before concluding that cef3 is more appropriate for use as an antibiotic in septic arthritis treatment. Although cef3 effectively reduced the expression levels of IL1B and TNF, both of which are potential therapeutic targets for suppressing inflammation, a serious concern about the effects of CEFs is that they suppressed activation of anabolic and anti-catabolic mediators and promoted catabolic mediators together with chondrocyte death. Nevertheless, these findings do not definitely indicate disadvantages of using CEFs in patients with signs of OA and joint inflammation.
Acknowledgments
The authors are also grateful for research funding from CMU Research Group Grant (2015) Chiang Mai University, Thailand. And additional support from the Chiang Mai University (CMU) through the research administration office provides budget to our Excellence Center in Osteology Research and Training Center (ORTC).
Conflict of interest
The authors declare that there is no conflict of interests regarding the publication of this paper.


