Changes in human sweat metabolome conditioned by severity of obstructive sleep apnea and intermittent hypoxemia
Summary
Obstructive sleep apnea (OSA) is a sleep disorder that has been associated with the incidence of other pathologies. Diagnosis is mainly based on the apnea–hypopnea index (AHI) obviating other repercussions such as intermittent hypoxemia, which has been found to be associated to cardiovascular complications. Blood-based samples and urine have been the most utilised biofluids in metabolomics studies related to OSA, while sweat could be an alternative due to its non-invasive and accessible sampling, its reduced complexity, and comparability with other biofluids. Therefore, this research aimed to evaluate metabolic overnight changes in sweat collected from patients with OSA classified according to the AHI and oxygen desaturation index (ODI), looking for potential cardiovascular repercussions. Pre- and post-sleeping sweat samples from all individuals (n = 61) were analysed by gas chromatography coupled to high-resolution mass spectrometry after appropriate sample preparation to detect as many metabolites as possible. Permanent significant alterations in the sweat were reported for pyruvate, serine, lactose, and hydroxybutyrate. The most relevant overnight metabolic alterations in sweat were reported for lactose, succinate, urea, and oxoproline, which presented significantly different effects on factors such as the AHI and ODI for OSA severity classification. Overall metabolic alterations mainly affected energy production-related processes, nitrogen metabolism, and oxidative stress. In conclusion, this research demonstrated the applicability of sweat for evaluation of OSA diagnosis and severity supported by the detected metabolic changes during sleep.
1 INTRODUCTION
Obstructive sleep apnea (OSA) is a condition of disordered breathing characterised by repeated episodes of partial (hypopnea) or total collapse (apnea) of the upper airway during sleep, causing intermittent hypoxemia and sleep fragmentation (Blekic et al., 2022; Pinilla et al., 2022). The ‘gold standard’ test for OSA diagnosis is based on the measurement of the apnea–hypopnea index (AHI) by polysomnography (PSG). Other parameters associated with oxygen saturation (SpO2), such as baseline and averaged SpO2, the oxygen desaturation index (ODI), and the percentage of total sleep time with a SpO2 of <90% (T90), are also frequently evaluated (Mediano et al., 2022; Randerath et al., 2021). However, OSA diagnosis is typically defined by AHI levels. According to the last International Consensus Document about OSA, individuals are considered not to have OSA when their AHI is <15 events/h; to have non-severe OSA when their AHI is between 15 and <30 events/h; and severe OSA when their AHI is ≥30 events/h (Kapur et al., 2017; Mediano et al., 2022; Pinilla et al., 2022; Randerath et al., 2021). Additionally, it is generally accepted that mild OSA (AHI between 5 and <15 events/h) might not have significant cardiovascular consequences (Mediano et al., 2022).
Apnea and hypopnea episodes provoke SpO2 decreases, which have an impact on the human metabolism. Previous studies have proposed that OSA diagnosis based solely on the AHI ignores the heterogeneity of this disease, suggesting the ODI as a complement to adequately define OSA conditions (Blekic et al., 2022; Dewan et al., 2015; Mediano et al., 2022; Temirbekoy et al., 2018). OSA severity should be under especial consideration due to its relevant association with workplace risk and traffic accidents, cardiovascular disorders incidence, oxidative stress, neurodegenerative diseases, and cancer (Baril et al., 2018; Cowie et al., 2021; Javaheri et al., 2017; Jurado-Gámez et al., 2011; Mediano et al., 2022).
Untargeted metabolomics strategies have been previously used to study metabolic alterations in patients with OSA (Ferrarini et al., 2013; Kiens et al., 2021; Pinilla et al., 2022; Xu et al., 2016). Metabolomics profiling of patients with OSA has been carried out in several biofluids such as plasma, serum, urine, and saliva (Kiens et al., 2021; Pinilla et al., 2022; Xu et al., 2016; Ząbek et al., 2015). The most common samples used have been either plasma or serum, where fatty acids and related biomolecules, glycolytic intermediates and amino acids were found to be discriminant features of patients with OSA (Zhang et al., 2021). Kiens et al. (2021) analysed dynamic changes occurring in the blood from patients with OSA during the sleep period. Higher levels of alanine, proline and kynurenine were found in patients with OSA as compared to control individuals, although they remained constant overnight, while a decrease was observed in the control group (Kiens et al., 2021). Concerning the urine metabolome, comparison between patients with OSA and individuals without OSA reported significant differences in acylcarnitines and biogenic amines (Zhang et al., 2021). Changes in concentration of cortisol and α-amylase were detected in patients with OSA using saliva samples (Bencharit et al., 2021).
Sweat has not been evaluated as a biofluid for metabolomic analysis in the study of OSA. Its non-invasiveness and easy pre-processing are some key aspects of this biofluid. Sweat sample preparation is generally not required due to its simple composition (Mena-Bravo & De Castro, 2014). Additionally, its composition may be influenced by different pathologies and even by diurnal rhythm, which suggests alterations due to endogenous metabolic reactions (Brunmair et al., 2021). Brunmair et al. (2021) reported that sweat analysis could provide complementary information of reactive oxygen species (ROS), which could reflect the consequences of oxidative stress caused by OSA. With these premises, this research was targeted at analysing metabolomic changes occurring in sweat from patients with OSA with the following aims: (i) to associate changes in concentrations of metabolites with an OSA diagnosis; (ii) to monitor dynamic changes occurring during sleep; and (iii) to study the correlation between OSA severity and sweat metabolic changes.
2 METHODS
2.1 Selected population and study design
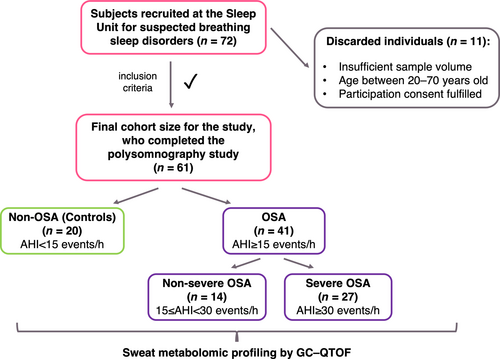
An observational and prospective study was selected for this research. Figure 1 shows that 72 individuals with suspected breathing sleep disorders were recruited at the Sleep Unit of Reina Sofía University Hospital (Córdoba, Spain) between October 2018 and June 2019. Participants underwent PSG studies due to snoring, unrefreshing sleep, and excessive daytime sleepiness (Epworth Sleepiness Scale score >10). The PSG test was performed under standard conditions for all participants such as, avoidance of alcohol and exciting drinks intake 6.5 h before test (12:00 a.m.), and light dinner based on Mediterranean diet intake 2.5 h before test (12:00 a.m.). Only four participants required drug intake; this was not considered as this number was not representative of the entire population (n = 72). The Hospital Ethics Committee approved this study, and all participants completed the informed consent. In all, 11 participants were excluded according to the exclusion criteria: sample volume <10 μL, age <20 and >70 years, cases with a SpO2 of <94%, congestive cardiac failure, hepatic cirrhosis, chronic renal failure, or neuromuscular disease. The age interval was set to avoid the inclusion of subjects with several comorbidities. Consequently, 61 middle-aged (circa 50 years of age) individuals comprised the cohort (Table 1). According to a recent International Consensus Document about OSA (Mediano et al., 2022), this cohort was comprised of 20 non-OSA subjects (AHI <15 events/h), considered as the control group, and 41 patients with OSA (AHI ≥15 events/h). Furthermore, patients with OSA were subdivided according to OSA severity: non-severe OSA (AHI 15 to <30 events/h) and severe OSA (AHI ≥30 events/h). These higher levels, AHI ≥30 events/h, are particularly related to OSA-associated cardiovascular diseases such as ischaemic heart disease, cerebral vascular disease, arrhythmia, and congestive heart failure (Mediano et al., 2022).
| Controls (n = 20) | OSA severity | pa | |||
|---|---|---|---|---|---|
| Baseline conditions (n = 61) | Non-severe (n = 14) | Severe (n = 27) | |||
| Age, years, mean (SD) | 58.4 (8.0) | 54.9 (5.0) | 55.0 (9.7) | NS | |
| Sex, n (%) | Female | 14 (70) | 3 (21.4) | 5 (18.5) | 0.0006*** |
| Male | 6 (30) | 11 (78.6) | 22 (81.5) | ||
| Smoking, n (%) | 7 (35) | 4 (28.6) | 8 (29.6) | NS | |
| BMI, kg/m2, mean (SD) | 32.4 (6.1) | 29.8 (4.1) | 34.1 (5.5) | NS | |
| SBP, mmHg, mean (SD) | 129.3 (10.2) | 124.2 (10.2) | 133.8 (10.2) | 0.020* | |
| DBP, mmHg, mean (SD) | 80.5 (8.2) | 73.4 (9.6) | 83.7 (7.0) | 0.001** | |
| PSG measures, mean (SD) | Baseline SpO2, % | 95.9 (1.5) | 95.9 (1.2) | 95.5 (1.8) | NS |
| Average SpO2, % | 94.7 (1.6) | 93.9 (1.0) | 91.9 (3.5) | <0.0001**** | |
| AHI, events/h | 9.3 (2.8) | 18.7 (3.6) | 55.1 (18.8) | <0.0001**** | |
| ODI, events/h | 10.0 (6.0) | 17.8 (6.8) | 53.9 (18.5) | <0.0001**** | |
| T90, % | 2.3 (3.7) | 2.7 (3.5) | 20.5 (19.5) | <0.0001**** | |
| DM, n (%) | 4 (20) | 3 (21.4) | 5 (18.5) | NS | |
| HD, n (%) | 2 (10) | 0 (0) | 4 (14.8) | NS | |
| RAS, n (%) | 1 (5) | 1 (7.1) | 2 (7.4) | NS | |
| GER, n (%) | 6 (30) | 2 (14.3) | 8 (29.6) | NS | |
| COPD, n (%) | 3 (15) | 1 (7.1) | 1 (3.7) | NS | |
- Abbreviations: AHI, apnea–hypopnea index; BMI, body mass index; COPD, chronic obstructive pulmonary disease; DBP, diastolic blood pressure; DM, diabetes mellitus; GER, gastro-oesophageal reflux; HD, heart disease; NS, not statistically significant; ODI, oxygen desaturation index; OSA, obstructive sleep apnea; RAS, risk of acute stroke; SBP, systolic blood pressure; SpO2, arterial oxygen saturation measured by pulse oximetry; T90, percentage of total sleep time with SpO2 <90%.
- a Chi-square of independence test was performed to evaluate the independence of the categorical outcome distribution among the severity groups, whereas for numeric variables a Kruskal–Wallis test was applied to evaluate the significant differences between severity groups. *p < 0.05; **p < 0.01; ***p < 0.001; ****p < 0.0001.
2.2 Clinical procedures and measurements: PSG study
Individuals were consecutively enrolled when newly diagnosed with OSA according to the overnight PSG results. Standard PSG from 12:00 a.m. to 7:00 a.m. was used (Grael PSG TM; Compumedics©, Sydney, Australia) to register three electroencephalogram channels, electro-oculogram, submental and tibial electromyogram, and airflow by thermistor and pressure signal. Snoring, thoracic, and abdominal effort, electrocardiographic derivation, and SpO2 were also monitored. Apnea was defined as a significant decrease (>90%) in oronasal flow for >10 s, and hypopnea as an evident decrease in airflow of >30%, but <90%, and associated with either oxygen desaturation ≥3% and/or arousal. Monitored respiratory variables were the AHI, defined as the sum of apnea and hypopnea events occurring per hour, minimum SpO2, ODI, described as the number of decreases in SpO2 ≥3% per sleep hour, and finally, T90, which represents the hypoxemia severity (Dutta et al., 2021). PSGs were considered valid for diagnosis when >180 min sleep was recorded (Kapur et al., 2017).
2.3 Sweat samples collection and storage
Sweat was sampled for each patient in the late evening (pre, before sleep) and in the following morning (post, after sleep). Sweat was collected with the Macroduct® Sweat Analysis System (Wescor Inc., Logan, UT, USA) according to manufacturer's recommendations. Iontophoretic stimulation of sweat excretion was performed with Pilogel® discs (US Patent 4,383,529; Wescor Inc.), a gel reservoir of pilocarpine ions. The lower portion of the anterior forearm was cleaned with ethanol and distilled water. A sweat volume average of 30 μL per individual was collected by the Macroduct device collector over 15 min and then transferred to plastic Eppendorf microtubes and stored at −80°C until analysis. Sweat extraction was performed according to World Medical Association Declaration of Helsinki guidelines (2004).
2.4 Metabolomic sweat profiling
For metabolomic sweat profiling, 5 μL of each sample under study was mixed to get a sample pool destinated to the preparation of Quality Control samples (QCs) for assessment of the method performance and variability check. Sample treatment derived from an experimental strategy based on deproteinisation with a methanol (MeOH)–acetonitrile (ACN) mixture before methoxymation plus silylation derivatisation by following the protocol optimised by Delgado-Povedano et al. (2016). Thus, 50 μL of 70:30 (v/v) MeOH/ACN (TraceSELECT® grade from Sigma–Aldrich, St. Louis, MO, USA) solution were added to 10 μL aliquots of sweat samples and homogenised in a vortex shaker from IKA® (Wilmington, NC, USA) for 5 min at room temperature. The resulting mixture was centrifuged in a microcentrifuge Sorvall Legend Micro 21R from Thermo Fisher Scientific (Waltham, MA, USA) for 5 min at room temperature and 10,000 × g. Then, the liquid phase was isolated and transferred to a 250-μL glass insert and, afterwards, evaporated to dryness in a Concentrator plus™ from Eppendorf (Hamburg, Germany). Subsequently, the dry residue was reconstituted in 10 μL of 40 mg/mL methoxyamine hydrochloride (Sigma–Aldrich,) in pyridine (Merck, Darmstadt, Germany), vortexed for 30 s and incubated at 30°C, 500 rpm for 90 min in a ThermoMixer® C block heater (Eppendorf, Hamburg, Germany). After methoxymation step, silylation was performed by adding 40 μL 100:1 BSTFA–TMCS solution (Sigma–Aldrich) and shaking it for 30 s before incubation at 37°C, 500 rpm for 30 min. Finally, all the prepared analytical samples were kept at room temperature for 3 min to ensure they were suitable for analysis.
Analyses were carried out by the same equipment and parameters for gas chromatographic separation and mass spectrometric detection purposes as those of the method developed by Delgado-Povedano et al. (2016).
2.5 Annotation of metabolites
Data acquired by gas chromatography mass spectrometry (MS)–Quadrupole Time-of-Flight (GC-QTOF) in full scan mode were processed with Unknown Analysis software (version B.07.00, Agilent Technologies, Palo Alto, CA, USA) and treatment of these data was performed with MassHunter Workstation software Quantitative Analysis (version B.07.00, Agilent Technologies). Annotation of metabolites was performed by following the Delgado-Povedano et al. (2016) workflow.
Annotated features were exported to Personal Compound Database Library Manager (PCDL Manager) B.07.00 from Agilent Technologies and allowed to create a personalised MS library (named ‘sweat.metabolomics.cdb’) of annotated metabolites containing the following information: MS spectra, empirical formula, molecular mass, precursor ion m/z (with the corresponding collision energy), and retention time. Finally, peak areas for annotated metabolites were extracted from all files (samples, blanks, and QCs) by Quantitative Analysis software B.07.00 (Agilent Technologies).
2.6 Statistical analyses
Descriptive statistics was used for characterisation of the study cohort. Normal distributions were evaluated by Shapiro–Wilk test. Clinical parameters were compared between controls, non-severe and severe OSA groups by Kruskal–Wallis test and chi-square test for continuous numerical and categorical variables, respectively.
Peak areas for annotated metabolites were normalised by the MS total useful signal (MSTUS) and transformed by log2 and, finally, weighted scaling by sex was applied to minimise sex variability. This scaling was necessary after observing that sex was the primary variability source, by a principal component analysis of metabolites normalised and transformed concentrations.
Supervised analyses were performed with the fold-change (FC) results of all metabolites, FC ([post-sleeping concentrations – pre-sleeping concentrations]/pre-sleeping concentrations), considering controls, non-severe and severe OSA as classification groups (by AHI and ODI levels). Additionally, correlation between the AHI and ODI levels was evaluated by Spearman correlation.
Permanent changes were evaluated by statistical comparison through a t test (95% confidence interval [CI]) between the concentration of each metabolite in pre-sleeping samples from control subjects and patients with OSA. On the other hand, dynamic changes were studied by statistical comparison through repeated measures analysis of variance (ANOVA) and Tukey's post hoc analyses (95% CI) in pre- and post-sleeping samples considering controls, non-severe and severe OSA as between-subjects factor (AHI and ODI, respectively).
3 RESULTS
3.1 Cohort characterisation
A description of the studied cohort is shown in Table 1, which includes participants metadata and parameters measured in the PSG test. The Kruskal–Wallis test was used to evaluate continuous variables between the three groups defined by AHI levels (controls/non-OSA: AHI <15 events/h, non-severe OSA: AHI 15 to ≤AHI < 30 events/h, severe OSA: AHI ≥30 events/h), as these variables did not follow a normal distribution. Age, body mass index (BMI; circa obese cohort, average BMI ≥30 kg/m2) and baseline or awake SpO2 were not significantly different between controls and OSA severity groups (Table 1). On the other hand, the other continuous variables reported significant differences, but these variables can be associated with OSA disease. Systolic and diastolic blood pressure (SBP and DBP, respectively) were significantly different when comparing the control and OSA severity groups (Table 1). Consequently, these parameters could be also considered to characterise OSA severity. Interestingly, overnight average SpO2 (%) was significantly different among the three groups, following a decreasing trend as OSA worsened.
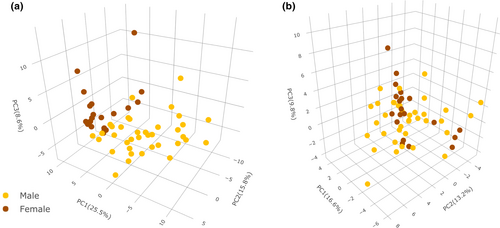
As a complement, a chi-square test of independence revealed significant differences in sex distribution between groups, while no incidence was found for smoking (Table 1). This distribution agrees with the literature as males generally present a higher prevalence of OSA as compared to females (Bonsignore et al., 2019). Application of a weighted scaling strategy to normalised (MSTUS) and transformed (log2) data allowed minimising of sex variability (Figure 2), and this strategy was adopted for further studies.
3.2 Association of OSA diagnostic and sweat metabolome profiles
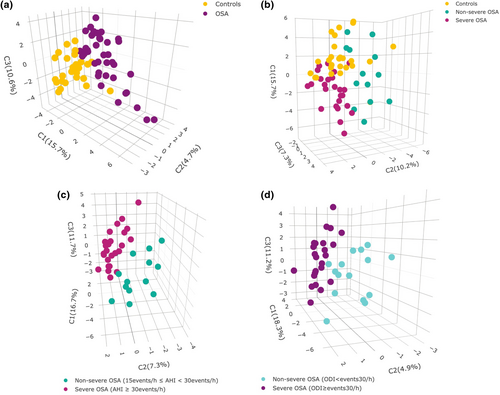
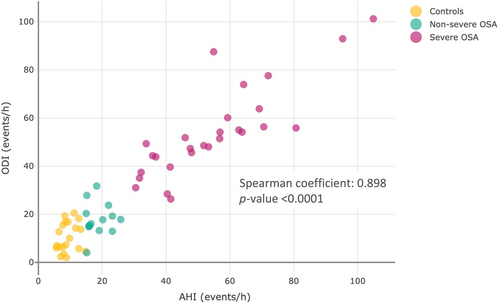
Sweat samples analysis allowed the annotation of 78 tentative metabolites. Relative concentrations obtained in pre- and post-sleeping samples were used to obtain a data set containing FC ratios, representing metabolic alterations overnight. A partial least-squares discriminant analysis (PLS-DA) was performed to find discrimination patterns in overnight changes between controls and patients with OSA (Figure 3a). This demonstrated that the sweat metabolome is differently affected by OSA during sleep. From this point, this study was focused on further evaluation of sweat metabolome in patients with OSA according to severity. Figure 3b shows potential discrimination of sweat metabolome alterations during sleep depending on the condition of the individuals (controls, non-severe and severe OSA). Furthermore, PLS-DAs were performed only considering patients with OSA to evaluate discrimination patterns according to OSA severity by using the AHI and ODI as classification parameters (Figure 3c,d), which can be associated with OSA severity (Blekic et al., 2022; Dewan et al., 2015). These results confirm the potential of the ODI to evaluate the OSA severity situation of patients in terms of intermittent hypoxemia as it is one of the most representative pathological patterns of OSA. Variable importance plots based on scores plots from previous PLS-DA are shown in Figure S1 to report the importance of biomolecules on the observed discrimination. Figure 4 shows a strong correlation between the AHI and ODI (Spearman coefficient = 0.898, p < 0.0001). Thus, the ODI is proposed as a classification parameter to discern between non-OSA and OSA cases. Analogously, the strong correlation between the AHI and ODI supports the capability of the latter to measure OSA severity. For this purpose, a 30 events/h ODI cut-off was set to classify patients with non-severe and severe OSA.
3.3 Alterations in human sweat metabolome induced by OSA: permanent and dynamic changes
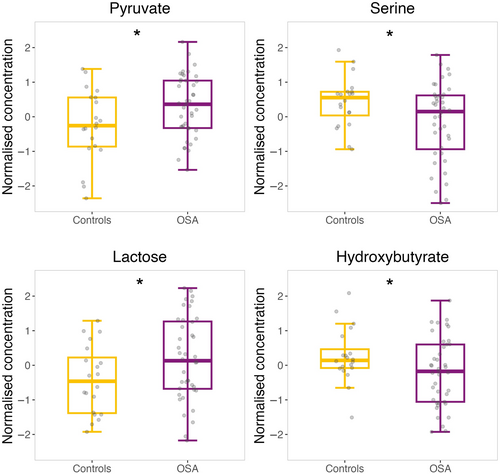
Concentrations of metabolites in pre-sleeping samples were evaluated to detect significant differences between control subjects and patients with OSA by a t test (95% CI). Four biomolecules reported significant differences in sweat samples (Figure 5), which could be attributed to long-term OSA repercussions (permanent changes). Pyruvate (p = 0.046) and lactose (p = 0.028) showed a significant increase in the sweat from patients with OSA as compared to control individuals, while serine (p = 0.016) and hydroxybutyrate (p = 0.049) presented the opposite tendency.
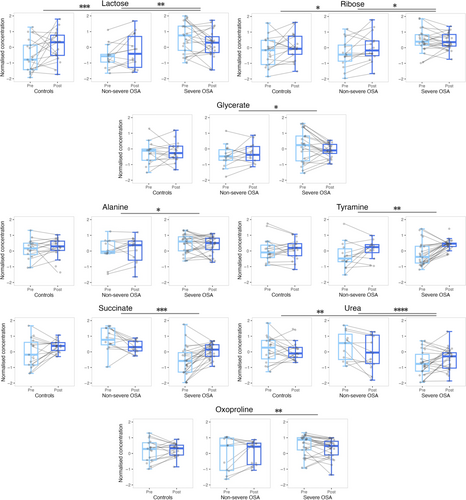
Differences in the sweat metabolome of patients with OSA during sleep were evaluated by repeated measures ANOVA by considering pre- and post-sleeping sweat samples. The AHI and ODI were the variables used for OSA severity characterisation. ANOVA showed that hypoxic events caused metabolic changes in sweat composition; particularly, eight and four metabolites reported significant differences during sleep by considering the AHI and ODI as between-subject factors, respectively (Table 2). Most significant dynamic changes were observed in metabolites involved in carbohydrates, amino acids, urea, and glutathione metabolism, besides the tricarboxylic acid (TCA) cycle. Considering the AHI as the OSA severity classification factor, three metabolites involved in carbohydrates metabolism presented significant differences between groups overnight, lactose and ribose between patients with severe OSA with respect to controls and patients with non-severe OSA, while glycerate showed a significant decrease overnight for patients with severe OSA compared to a slight increase observed for non-severe cases (Figure 6). Significant dynamic changes for alanine and tyramine, metabolites related to amino acids metabolism, were found between patients with non-severe and severe OSA (Figure 6). Succinate, a contributor to energy metabolism (TCA cycle), had an opposite tendency overnight for patients with non-severe and severe OSA, presenting a remarkable increase for the latter group. Urea presented significant dynamic changes among patients with severe OSA showing an increase overnight in sweat concentration compared with a decrease in the other two groups (Figure 6). In the case of oxoproline, a significant contrary effect was found overnight for patients with non-severe and severe OSA (Figure 6).
| Dynamic changes | |||
|---|---|---|---|
| Metabolite | Repeated measures ANOVAa | ||
| OSA severity groups | Changes during sleeping | Interaction effectb | |
| AHI levels | |||
| Alanine | 0.036 | NS | 0.011 |
| Urea | 0.0002 | <0.0001 | |
| Succinate | 0.0003 | 0.021 | 0.0003 |
| Glycerate | NS | NS | 0.047 |
| Oxoproline | 0.019 | 0.0027 | |
| Ribose | 0.033 | 0.020 | |
| Tyramine | NS | 0.0065 | |
| Lactose | 0.0025 | 0.00096 | |
| ODI levels | |||
| Urea | 0.0002 | NS | 0.0001 |
| Succinate | 0.0013 | 0.021 | <0.0001 |
| Oxoproline | 0.012 | NS | 0.0044 |
| Lactose | 0.0045 | 0.0006 | |
- Abbreviations: AHI, apnea–hypopnea index (sum of apnea and hypopnea events occurring per hour); ANOVA, analysis of variance; NS, non-significant p values are not shown (p > 0.05); ODI, oxygen desaturation index (number of decreases in oxygen saturation [SpO2] ≥3% per sleep hour); OSA, obstructive sleep apnea.
- a Repeated measures ANOVA was performed considering pre- and post-sleeping sweat samples whose results represent dynamic changes during sleep in human sweat metabolome.
- b Interaction effect p value adjusted by Bonferroni method.
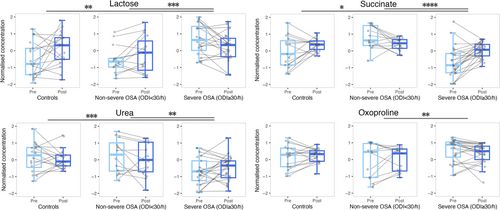
As expected, some metabolites such as lactose, succinate, urea, and oxoproline commonly presented significant differences when considering the AHI and ODI classifications of OSA severity, which suggest that these variables could explain the progress of the disease in a similar way (Temirbekoy et al., 2018). In fact, overnight alterations in these metabolites per group followed a behaviour very similar to that of those groups obtained by the AHI classification. As the ODI can be measured by pulse oximetry, which is more cost-effective, faster, and easier to use when compared to PSG, and this parameter provides additional information about cardiovascular risk, ODI measurement can be always considered for evaluation of suspected OSA cases.
4 DISCUSSION
The cohort under study was characterised by increased SBP levels in patients with severe OSA as compared to the controls and patients with non-severe OSA, which has been previously reported in several studies (Crinion et al., 2019; Pio-Abreu et al., 2021). Moreover, DBP also followed the same trend in patients with severe OSA versus the other two groups as also described in the literature (Javaheri et al., 2017; Johnson et al., 2019). Even though the AHI is the most used quantitative parameter to define apnea clinical relevance, previous studies have reported the potential contribution of the ODI and T90 values (Blekic et al., 2022; Mediano et al., 2022). In fact, the three factors were significantly different among the groups, following an ascendent trend from controls up to patients with severe OSA (Table 1). In addition, overnight average SpO2 (%) was significantly different in the three groups, with a decreasing trend as OSA worsened, which is explained by the apnea, hypopnea, and oxygen desaturation episode increase with OSA severity. Therefore, OSA severity can affect the circulating oxygen content during sleep, with a direct impact on the metabolism. Furthermore, the strong correlation between the AHI and ODI suggests that both parameters would describe efficiently and complementarily OSA cases. Even though the AHI is the preferred parameter for general OSA classification, several studies have reported its lower predictive value for OSA-related consequences as compared to intermittent hypoxemia, with a direct association to the ODI (Malhotra et al., 2015). In fact, Rashid et al. (2021) evaluated possible appropriate cut-off values for the ODI, recommending 15 events/h to consider an attended sleep study.
Analysis of sweat metabolic changes before sleep and overnight revealed significant effects in the metabolism on carbohydrates and amino acids, energy metabolism, the urea cycle, and metabolic pathways related to oxidative stress due to OSA and severity stages (Figure 8, Table 2). Overall, the results indicate that OSA is a disease that mainly alters energy production processes in cells, as reported in previous studies (André et al., 2020; Mediano et al., 2022; Yetkin-Arik et al., 2019). These effects could lead to a low sleep quality and fatigue during the day, which are normal symptoms in patients with severe OSA (Chervin, 2000; Mediano et al., 2022). Furthermore, these metabolic alterations could be intermediate physiopathological mechanisms of OSA that could influence other comorbid situations.
4.1 Carbohydrates metabolism
Carbohydrates metabolism provides the glycolysis process with fructose-6-phosphate through conversions of lactose to fructose. According to our results, lactose and fructose presented higher baseline levels in patients with severe OSA with respect to controls (Figure 5), which has been previously observed by Xu et al. (2016). Nevertheless, dynamic changes by group seemed to show metabolism regulation through sweat excretion overnight, as groups with lower lactose baseline concentrations raised during sleep while patients with severe OSA who presented higher lactose baseline levels experienced a decrease overnight (Figures 5 and 6). Another metabolic pathway to glycolysis is the pentose phosphate pathway (PPP) that is activated when cells demand for nicotinamide adenine dinucleotide phosphate (NADPH) to reduce oxidative stress by elimination of ROS (Cho et al., 2018). PPP activation increases the production of ribose-5-phosphate and generates glycerate, which may contribute to glycolysis flux. Figure 6 shows that patients with severe OSA presented higher baseline concentration levels of ribose and glycerate in sweat versus patients with non-severe OSA and controls. These results could indicate that reduced excretion of these metabolites is connected to glycolysis flux reduction (Cho et al., 2018; Xu et al., 2016; Zhang et al., 2021), suggesting an oxidative stress minimisation as a priority. Supporting our results, Xu et al. (2018) found higher levels of pentoses in the urine of paediatric patients with OSA as compared to controls, although ribose reported the opposite behaviour (Xu et al., 2016). In general, we observed significant dynamic changes in carbohydrates metabolism according to OSA severity (Figures 6 and 7), alluding to short-term repercussions in human metabolism possibly accumulated through time aggravating individuals’ OSA condition. In fact, disorders in carbohydrates metabolism have been observed in patients with coronary heart disease (Sun et al., 2019). All carbohydrates-related metabolites significantly different between the compared groups followed a contrary tendency overnight for patients with severe OSA, which could suggest an attempt of the organism to regulate carbohydrates metabolism during sleep.
4.2 Amino acids metabolism
Obstructive sleep apnea has been observed to induce alterations in amino acids metabolism in previous studies (Barceló et al., 2017; Kiens et al., 2021; Schmidt et al., 2022; Zhang et al., 2021). Amino acids may contribute to several metabolic pathways, such as alanine, which is highly associated to energy metabolism due to its easy generation from pyruvate through the Cahill cycle (KEGG, https://www.kegg.jp/), which also implies production of urea (Kiens et al., 2021) (Figure 8). According to our results, alanine concentrations in sweat significantly increased overnight for patients with non-severe OSA whereas a decrease was observed for patients with severe OSA (Figure 6). Simultaneously, sweat levels of urea followed the opposite trend to alanine for each group, which could indicate that accumulation of alanine in tissues occurs during the first stages of OSA, thus being directly excreted through sweat. However, it is worth noting that the decreased levels of alanine and increased levels of urea excreted overnight for patients with severe OSA could explain metabolic shift of pyruvate metabolism towards the Cahill cycle instead of the TCA cycle for further energy production. Additionally, evaluation of permanent changes revealed raised pyruvate levels in the sweat of patients with OSA as compared with control subjects (Figure 5), which could represent a long-term consequence associated to the previously mentioned accumulation of alanine in the organism. It is worth noting that increased levels of alanine have been observed in patients with coronary heart disease (Sun et al., 2019), which could be a fatidic consequence of OSA (Peker et al., 2006).
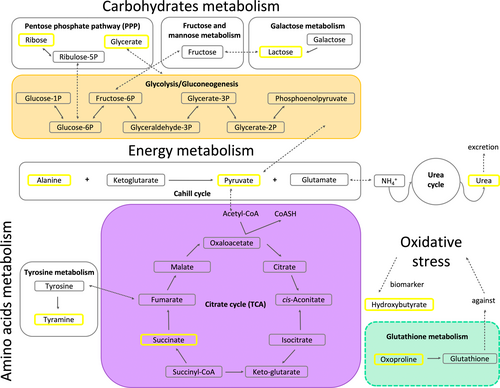
Amino acids metabolism may progress through conversion of TCA intermediates or biogenic amines (KEGG, https://www.kegg.jp/). Indeed, tyrosine is one of the sources of fumarate, but this amino acid may also be converted into its corresponding biogenic amine, tyramine, to follow a different metabolic pathway. According to our results, tyramine presented slightly lower baseline levels for patients with severe OSA, even though after sleeping this biomolecule concentrations significantly increased in patients with severe OSA as compared to non-severe cases (Figure 6). Contrarily, previous studies have found increments of biogenic amines concentrations in urine and plasma from patients with OSA compared with controls (Cho et al., 2017; Davies et al., 2014; Kiens et al., 2021). However, according to the literature, a general link has been found between several metabolic pathways involving amino acids and future cardiovascular diseases (Lind et al., 2023), which could be explained by all the previously mentioned alterations in amino acids metabolism owing to OSA.
4.3 Energy metabolism
Under low oxygen conditions the TCA cycle might be less favoured (Ma et al., 2019; Schmidt et al., 2022; Zhang et al., 2021). As Figure 8 shows, direct contributors to this biological process such as pyruvate and succinate presented significant differences between controls, and patients with non-severe and severe OSA. Particularly, succinate showed a significant decrease and increase overnight for patients with non-severe and severe OSA, respectively. These results suggest a metabolism regulation through patients sleep because baseline levels were higher for patients with non-severe OSA when compared to those with severe OSA. Additionally, Margolis et al. (2021) found higher levels of succinate during exercise at sea level than at high altitude, where participants had a reduction of oxygen consumption comparable to the oxygen deprivation of patients with OSA. These results could reflect the displacement of the normal flux from pyruvate to the TCA cycle probably caused by oxygen deprivation conditions, with the consequent conversion of pyruvate into lactate or pyruvate excretion through sweat. In fact, pyruvate presented significantly higher levels in the sweat of patients with OSA compared with controls (Figure 5). In addition, low succinate levels in patients with severe OSA (Figure 6) might indicate the exploitation of metabolites involved in the TCA cycle to compensate as much as possible for the low energy production (Figure 8).
4.4 Urea cycle
Urea is exclusively produced in the human liver through the urea cycle (Matsumoto et al., 2019). Ammonia is transported as glutamine to the liver, which has been previously found to be increased in the serum of patients with OSA, which suggested that OSA might provoke an increase in the activity of nitrogen metabolism (Kiens et al., 2021). The urea cycle would be activated as a primary body response to nitrogen excess and, thus, high urea levels could be found in excretory biofluids. This interpretation would support our results of urea dynamic changes in the sweat of control subjects, and patients with non-severe and severe OSA (Figures 6 and 7). In fact, concentrations of metabolites involved in the urea cycle have been found to be decreased in the blood when individuals were exposed to oxygen deprivation (Margolis et al., 2021). In addition, urea dynamic changes showed different tendencies among groups, which suggested that this could be an adequate indicator of OSA severity in sweat. Interestingly, an altered urea cycle has been reported for subjects without coronary artery disease but a large number of risk factors (Rubis, 2021).
4.5 Oxidative stress
Obstructive sleep apnea induces oxidative stress in organisms owing to the enhancement of ROS production (Cho et al., 2018; Schmidt et al., 2022; Zhang et al., 2021). Figures 4 and 5 show that oxoproline, a biological intermediate of glutathione, presented a significantly different effect overnight when comparing patients with non-severe versus severe OSA. As glutathione inactivates free radicals and favours toxins excretion, these results manifested that oxidative stress conditions vary depending on OSA severity (Frankfurter et al., 2019). Overall, oxoproline dynamic changes followed a descending trend overnight, which could indicate that the organism attempts to recover from oxidative stress while sleeping.
Additionally, hydroxybutyrate is considered a blood marker of oxidative stress and, according to our results, this metabolite was at lower levels in the sweat of patients with OSA compared with control subjects (Figure 5). Supposing that those lower levels in sweat mean accumulation of hydroxybutyrate in blood, oxidative stress conditions for patients with OSA would be worse than those of control subjects. This corroborates the results from previous studies such as higher hydroxybutyrate blood levels from individuals exercising at high altitude when compared to those exercising at sea level (Margolis et al., 2021), as that situation could be comparable to oxygen deprivation induced by OSA in patients. Additionally, Xu et al. (2018) found almost double the amount of hydroxybutyrate in the urine of patients with OSA than that in control subjects, which could reflect that most of this metabolite is excreted preferably through urine than by sweat. Additionally, oxidative stress has been described as highly implicated in cardiovascular complications (Dubois-Deruy et al., 2020).
5 CONCLUSIONS
An untargeted metabolomic strategy was applied to evaluate metabolic changes occurring in sweat collected from patients with OSA. Sweat is proposed in this study as it is collected in a non-invasive manner and its composition simplifies both sample preparation and detection. According to our results, the concentration changes in some metabolites could provide information about OSA diagnosis and its severity. Metabolic overnight alterations particularly affected the energy production pathways, nitrogen metabolism, and oxidative stress, whereas metabolic permanent variations due to OSA represented energy production pathways and oxidative stress. These results can aid to interpret the aggravation of consequences derived in patients with OSA with intermittent hypoxemia (ODI). Additionally, this study reveals that metabolic changes induced by OSA overnight could be a mirror of the long-term further metabolic repercussions (permanent changes) caused by this disease, which could represent intermediate physiopathological mechanisms that may influence cardiovascular complications risk. Therefore, this research shows the power of the ODI for OSA description representing intermittent hypoxemia through sweat untargeted metabolomics analysis. In turn, this biofluid shows great potential to reflect metabolic alterations due to OSA even when comparing OSA severity grades.
AUTHOR CONTRIBUTIONS
Laura S. Castillo-Peinado: Conceptualization; methodology; validation; formal analysis; investigation; writing – original draft; writing – review and editing; data curation; visualization. Mónica Calderón-Santiago: Methodology; validation; formal analysis; investigation; writing – original draft; writing – review and editing; data curation. Bernabé Jurado-Gámez: Conceptualization; validation; formal analysis; writing – original draft; writing – review and editing. Feliciano Priego-Capote: Conceptualization; methodology; validation; formal analysis; investigation; visualization; writing – original draft; writing – review and editing; funding acquisition; supervision.
ACKNOWLEDGEMENTS
This research was funded jointly by the Spanish Ministerio de Ciencia e Innovación (PID2019-111373RB-I00 project) and European Regional Development Fund/European Social Fund (‘Investing in your future’). Consortium for Biomedical Research in Frailty and Healthy Ageing (CIBERFES) is an initiative of Carlos III Institute of Health. Funding for open access charge: University of Córdoba / CBUA.
CONFLICT OF INTEREST STATEMENT
The authors declare no conflicts of interest.
Open Research
DATA AVAILABILITY STATEMENT
The data that supports the findings of this study are available in the supplementary material of this article.


