Sleep and the sleep electroencephalogram in C57BL/6 and C3H/HeN mice
Summary
Different mouse strains used in biomedical research show different phenotypes associated with their genotypes. Two mouse strains commonly used in biomedical sleep research are C57Bl/6 and C3H/He, the strains differ in numerous aspects, including their ability to secrete melatonin as well as the expression of several sleep-related genes. However, sleep regulation has only limitedly been compared between C3H/HeN and C57Bl/6 mice. We therefore compared sleep–wake behaviour and EEG-measured spectral brain activity for C57bl/6 and C3H/HeN mice during a 12:12 h light: dark baseline and during and after a 6 h sleep deprivation. The C3H mice spent more time in NREM sleep around the light–dark transition and more time in REM sleep during the dark phase compared with C57bl/6 mice. The C3H mice also showed more EEG activity in the 4.5–7.5 Hz range during all stages and a stronger 24 h modulation of EEG power density in almost all EEG frequencies during NREM sleep. After the sleep deprivation, C3H mice showed a stronger recovery response, which was expressed in both a larger increase in EEG slow wave activity (SWA) and more time spent in NREM sleep. We show large differences regarding sleep architecture and EEG activity between C3H and C57bl/6 mice. These differences include the amount of waking during the late dark phase, the 24 h amplitude in EEG power density, and the amount of REM sleep during the dark phase. We conclude that differences between mouse strains should be considered when selecting a model strain to improve the generalisability of studies investigating biomedical parameters related to sleep and circadian rhythms.
INTRODUCTION
The different mouse strains used in biomedical research show different phenotypes associated with their genotypes. Differences between inbred strains have been studied to relate differences in sleep or circadian phenotype to genetics. Several major mouse strains that have been compared in the context of sleep and circadian rhythms are C57BL/6, DBA/2J, C3H/HeN, and AKR/J (Adamah-Biassi et al., 2013; Franken et al., 1999; Hasan et al., 2012; Huber et al., 2000; Veasey et al., 2000; Wisor et al., 2008).
C57Bl/6 is a mouse strain used widely in biomedical research. Among its distinguishing features related to sleep and circadian rhythms are a relatively fast theta activity (7.4 Hz) in the electroencephalogram (EEG) during REM sleep, related to ACADS expression (Tafti et al., 2003), high activity in the slower frequencies (<5.0 Hz) in the EEG during NREM sleep, associated with Rarb expression (Maret et al., 2005), and a severely impaired ability to secrete melatonin due to mutations in AANAT (Roseboom et al., 1998) and HIOMT (Arendt et al., 1995; Kasahara et al., 2010). The C57Bl/6 strain consequently does not show a discernible daily rhythm in plasma melatonin levels (Kennaway et al., 2002).
C3H/HeN mice differ in gene expression compared with C57Bl/6 mice and show the corresponding differences in phenotype. It exhibits slower theta activity (6.4 Hz) during REM sleep (Tafti et al., 2003), and has a slightly lower activity in the slower EEG frequencies during NREM sleep (Maret et al., 2005). In contrast, this mouse strain does have a fully functional melatonin synthesis pathway resulting in rhythmic melatonin production in the pineal gland peaking around zeitgeber time (ZT) or circadian time (CT) 21 to 23 (Kennaway, 2019; Masana et al., 2000; Stehle et al., 2002). Additionally it has a mutation in Pde6b (retinal degeneration 1, rd1), which results in visual blindness between 4 and 12 weeks of age (Carter-Dawson et al., 1978; Han et al., 2013). This mutation in C3H mice does not affect the ipRGCs (Tu et al., 2005), and does not negatively impact the sensitivity of the strain to circadian light cues or the functioning of the circadian system (Benloucif & Dubocovich, 1996; Leclercq et al., 2021; Masana et al., 2000).
Comparisons between C57 and C3H mice have been performed previously to approximate the role and effects of melatonin on physiology and behaviour. These comparisons show, for example, differences in retinal clock gene expression (Dinet et al., 2007), spontaneous cage behaviour (Adamah-Biassi et al., 2013), and seasonal behaviour (Metzger et al., 2020) among many more (Brednow & Korf, 1998; Homola et al., 2015; Pfeffer et al., 2017; Sheynzon et al., 2005; Veasey et al., 2000; von Gall et al., 2000).
The differences previously found between the two strains can be interpreted to reveal effects in pathways where melatonin is involved, but could also originate from other, unrelated, or uncategorised genetic differences. Through knock-out models and exogenous application of melatonin, a role for melatonin has been established in photoperiodic adaption (Morgan & Hazlerigg, 2008; Revel et al., 2009), sleep regulation (Comai et al., 2013; Ochoa-Sanchez et al., 2011), and the development of the circadian system (Wong et al., 2022).
Despite the established involvement of melatonin in the circadian system and sleep, there have been few studies focussing on sleep architecture and sleep regulation including both C57BL/6 and C3H/HeN mice with electroencephalographic (EEG) confirmed sleep. In the present study we have compared sleep–wake behaviour and EEG-measured brain activity in C57bl/6 and C3H/HeN mice during a 12:12 h light: dark baseline and during and after a 6 h sleep deprivation.
METHODS
Animals
Eight male C57BL/6JOlaHsd mice and 10 male C3H/HeNHsd of at least 4 weeks of age for the rest–activity analysis and seven male C3H/HeNHsd and five male C57BL/6JOlaHsd, 12–15 weeks old for the EEG analysis, originating from Envigo (Envigo Research Models and Services; Horst, Netherlands) were housed in Plexiglas cages with food and water available ad libitum, in a 12:12 light: dark (LD) schedule (on at 09:00 off at 21:00; 50–100 lux at bottom of cage), in a temperature (21–22°C), and humidity (35%–65%) controlled environment.
Activity recording
The mice were single-housed with a passive infrared (PIR) sensor, for 11 days to record activity in LD and the subsequent 11 days to record free-running behaviour in constant darkness (DD). PIR-recorded locomotor behaviour was analysed and converted to activity profiles with Clocklab (Actimetrics, Illinois, USA). Activity profiles in DD were aligned at CT12 and activity onset was defined as at least 20 min more activity than 120% of the 24 h average activity and 30 min of more than 60% of average 24 h activity in 1 h.
EEG and EMG electrode implantation surgery
The mice were anaesthetised with a mix of ketamine (100 mg/kg), xylazine (10 mg/kg), and atropine sulfate (0.1 mg/kg) and fixed in a stereotact. Two holes were drilled (right hemisphere, 2 mm lateral to midline, 2 mm posterior to bregma; cerebellum, at midline, 2 mm caudal to lambda) for EEG-electrodes and two holes were drilled for stabilising screws. Two EMG electrodes were inserted between the skin and neck muscle. The two EEG and two EMG wires were inserted in a pedestal (Plastics One, Roanoke, Virginia, USA), which was fixed to the skull with dental cement. At the end of the surgery a cap was screwed on the pedestal to seal the connector holes and to prevent cage litter from entering the connector holes (Panagiotou et al., 2017; Panagiotou et al., 2019). After surgery the mice recovered in single housing for at least 7 days before entering the recording setup.
EEG-measurement and sleep deprivation
In the recording cages animals were connected to a cable, which was connected to a counterbalanced swivel system to allow for free movement within the recording cage. Light, humidity, and temperature in the recording cage were comparable to the home cage and food and water were available ad libitum. The signal was amplified ~2000 times and was filtered through an ACQ-7700 system (Data Sciences International, New Brighton, MN, USA) with a low pass filter of 100 Hz and subsequently recorded on a local computer with Ponemah v5.53 (DSI), with a primary sampling rate of 250 Hz and a secondary sampling rate of 125 Hz. Files were then prepared for scoring by filtering the 50.0 Hz powerline and by filtering EEG channels with a band pass of 0.5–25.0 Hz and filtering EMG with a band pass of 3.0–25.0 Hz.
EEG recording started at 09:00 (at lights on) first for 24 h in a LD cycle to establish a baseline, immediately followed by another 24 h in LD with a 6 h sleep deprivation starting at lights-on. Animals were sleep deprived by gentle handling as described previously (Panagiotou et al., 2017). When the animals appeared to fall asleep or when the EEG exhibited slow waves the animals were woken up by noise, or introducing new bedding, food, water, or cage enrichment.
Analysis
Activity profiles were compiled for 10 min bins in Clocklab data collection software (Actimetrics, Wilmette, IL, USA) and averaged over 1 h. The EEG was scored manually in epochs of 4 s into three different states: waking, rapid eye movement (REM) sleep, and non-REM (NREM) sleep. Epochs that contained artefacts were excluded from analysis of power spectra, but vigilance states could always be determined. Scored data were analysed as the percentage of time spent in a state for 1 h averages. Episode duration and number were determined by binning the episodes into different lengths ranging from 4 to over 1024 s. Spectral analysis was performed using a fast Fourier transform with 0.5 Hz bins from 0.5 to 5.0 Hz and in 1.0 Hz bins from 5.0 to 25.0 Hz. Afterwards brain activity was further analysed per hour per bin.
In SPSS (v25, IBM corp), a generalised linear model (GLM) was performed with the factors mouse strain, time (ZT or CT) and the interaction of the two for the analysis of rest–activity, vigilance state distribution, episode duration and distribution, and EEG power density spectra. Another GLM was performed with the additional factor day for the analysis of the effect of sleep deprivation (excluding the data obtained during sleep deprivation and the corresponding baseline period). Post-hoc paired or unpaired t-tests were performed where appropriate if the GLM showed significance for the factor mouse strain or day or an interaction of factors mouse strain or day.
To determine 24 h patterns in EEG activity, the data were binned in 0.5 Hz bins from 0.5 to 5.0 Hz and in 1.0 Hz bins from 5.0 to 25.0 Hz. A sine wave with a period of 24 h was fitted on the baseline data for each individual animal and each individual frequency bin. The amplitudes and peak times of the frequency bins were compared between mouse strains with an independent samples t-test. This analysis was performed on EEG activity during NREM sleep and waking, but not during REM sleep, because C57bl/6 had too few REM sleep episodes during the dark phase to perform the analysis.
RESULTS
Locomotor activity
Representative actograms for the two strains can be found in Figure S1. In 12:12 L:D no difference between the strains was observed for the average amount of locomotor activity over 24 h (Figure 1a; p = 0.913). Hourly locomotor activity was differently affected by time for each strain (interaction factor time*strain, p < 0.001). Post-hoc t-tests comparing the strains per hour show that C3H mice were more active in the late light phase and early dark phase (Figure 1a; ZT10-12 and 13-14) while C57 mice showed more activity in the mid and late dark phase (ZT17-18 and 23-24) and in the early light phase (ZT3-5).
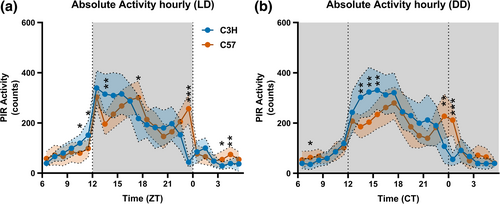
In constant darkness similar results were obtained: no strain-dependent differences on the 24 h amount of locomotor activity (p = 0.259), but time (p < 0.001), strain (p = 0.036), and the interaction of factors time*strain (p < 0.001) were significant for the 1 h average locomotor activity. Post-hoc t-tests between strains at 1 h intervals showed significant differences at the onset of the active phase (Figure 1b; CT13-16), at the offset of the active phase (CT23-1) and at CT7-8. Additionally, C3H had a shorter free-running period than C57 (Figure S2; t-test p < 0.001, example of representative periodograms for the two strains in Figure S1).
Vigilance state distribution
No significant difference between the two strains was observed in the total percentage of time spent awake (C57: 55.5%, C3H: 50.4%; p = 0.101), and in NREM sleep (C57: 39.0%, C3H: 41.8%; p = 0.277) over 24 h, but C3H mice spent more time in REM sleep (C57: 5.6%, C3H: 7.8%; p = 0.000). On a 12 h time scale C3H mice spent less time awake (p = 0.035; Figure 2b) and more time in REM sleep in the dark phase (p = 0.002; Figure 2f). The strains spent a similar amount of time awake (p = 0.063; Figure 2b) and in REM sleep in the light phase (p = 0.218; Figure 2f) and in NREM sleep in both phases of the day (light: p = 0.432; dark: p = 0.118; Figure 2d).
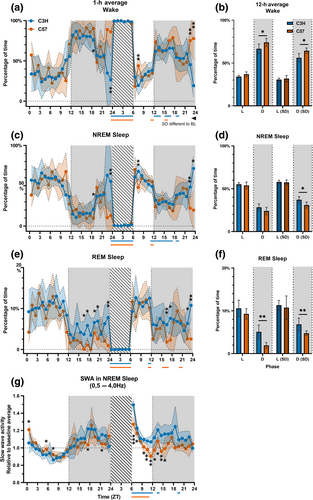
A GLM over 1 h intervals indicated a significant time-dependent change in state distribution for all vigilance states (factor time p < 0.001 in all states in both strains; Figure 2a–c). There was a strain-dependent difference in state distribution over time regarding wake (p = 0.001) and NREM sleep (p = 0.002), but not REM sleep (p = 0.180). Post-hoc t-tests comparing the amount of time spent awake and in NREM sleep per hour showed that C3H mice spent less time awake and more time in NREM sleep during the late dark phase (ZT23-24; p < 0.007).
Episode distribution and duration
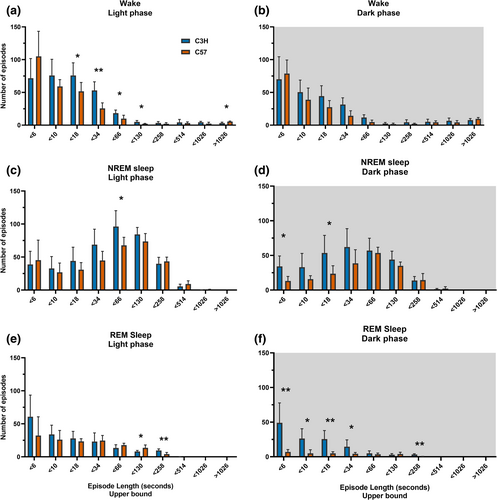
In the light phase C57 mice showed more of the longest waking episodes (Figure 3a; more than 1026 s, p = 0.012), while C3H mice showed more middle duration waking episodes from (10 to 130 s, p < 0.037). In the dark phase there was no significant difference in wake episode distribution between the strains (Figure 3b). During the light phase C3H mice showed more 34-66 s NREM sleep episodes (Figure 3c; p = 0.037) and in the dark phase C3H mice showed more episodes shorter than 6 s (Figure 3d; p = 0.016) and more 18–34 s episodes (p = 0.035). C3H mice also exhibited more REM sleep episodes of 66 to 258 s (Figure 3e; p < 0.012) during the light phase and during the dark phase they showed more REM sleep episodes of less than 34 s (Figure 3f; p < 0.048) and between 130 and 258 s (p < 0.001). Altogether, C3H mice showed more of the shorter NREM sleep episodes and short REM sleep episodes during the dark phase. In the light phase this pattern was not present and differences between the two strains were generally smaller.
Spectral analysis of EEG
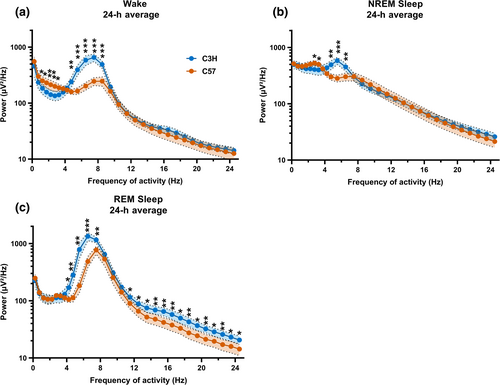
Compared with C57bl/6 mice, C3H mice had a higher EEG power density around the theta range in all vigilance states (wake: 4.5–9.0 Hz p < 0.005; NREM sleep: 4.5–7.0 Hz p < 0.004, REM sleep: 4.0–8.0 Hz p < 0.013) and lower power density in the slow wave range during waking (1.5–3.5 Hz: p < 0.033) and NREM sleep (2.5–3.5 Hz: p < 0.044). C3H mice also exhibited more activity in the faster frequencies in REM sleep (11.0–25.0 Hz; p < 0.042; Figure 4a–c).
The relative EEG power density values for waking and NREM sleep over the first 24 h (during baseline) were analysed for each frequency bin individually (0.5 Hz bins from 0.5 to 5.0 Hz and in 1.0 Hz bins from 5.0 to 25.0 Hz). During NREM sleep C3H mice showed a significant daily rhythm in EEG power density in all frequencies. C57 mice showed a significant daily rhythm in all frequencies except between 18.0–19.0 Hz and 20.0–22.0 Hz. For NREM sleep, C3H mice showed a significantly larger 24 h rhythm amplitude in EEG power density compared with C57 mice in all bins above 0.5 Hz (Figure 5; p < 0.011), except between 3.0 and 6.0 Hz. In contrast, C57 mice displayed a larger daily amplitude between 3.0 and 5.0 Hz (p < 0.046). EEG-power density during NREM sleep peaked in C3H mice in the middle of the dark phase (ZT18-22) for frequencies in the slow-wave range (0.5–5.0 Hz) and in the early dark phase (ZT13-18) for the faster frequencies (6.0–25.0 Hz), while for C57 mice, it was around the middle of the dark phase (ZT 17–21; 3.0–6.0 Hz) and around light onset (ZT18-5; for the remaining frequencies). These differences in timing of 24 h amplitude in NREM sleep spectral power were not visible when analysing the EEG slow wave activity (SWA) range (0.5–4.0 Hz) as a whole (as in Figure 2g).
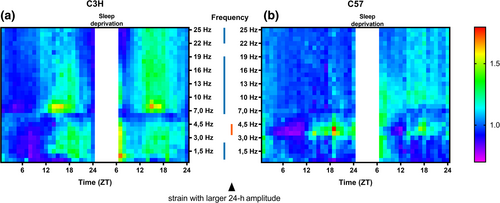
During waking C3H mice showed a significant 24 h rhythm in EEG power density in all analysed frequencies above 0.5 Hz except between 1.0–1.5 Hz, 13.0–15.0 Hz and 20.0–23.0 Hz (p < 0.030), while C57 mice had a significant 24 h rhythm in all frequencies above 1.0 Hz, except between 23.0 and 24.0 Hz (p < 0.011). Compared with C57 mice, C3H mice showed a larger amplitude in EEG power density values between 0.5 and 1.0 Hz (p = 0.042), 4.0–6.0 Hz (p < 0.001), 7.0–9.0 Hz (p = 0.011), and 23.0–24.0 Hz (p = 0.046), and C57 had a larger amplitude between 6.0 and 7.0 Hz (p = 0.005), 11.0–15.0 Hz (p < 0.044) and 20.0–23.0 Hz (p < 0.046; Figure S2). In the remaining frequencies the amplitude was similar. The significant rhythms in relative EEG power density during waking mostly peaked in the first half of the light phase (ZT1-7, both strains, frequencies below 7.0 Hz) or in the middle (ZT16-18, C3H) or late (ZT20-23, C57) dark phase (frequencies above 7.0 Hz).
Response to sleep deprivation
After the 6 h sleep deprivation, both strains showed an increase in time spent in NREM sleep (GLM-factor day: C57 p = 0.016, no significant interaction for day and time of day p = 0.381; C3H for day: p < 0.001 and no significant interaction between day and time of day p = 0.585). These effects were mainly found in the early night for C3H (p < 0.039 for ZT12-14, 15–17 and 18, 19), and only showed a significant effect at ZT11-12 and 15, 16 for C57 mice (p < 0.020). Additionally, there was an increase in time spent in REM sleep in both strains (GLM-factor day: p < 0.006), with post hoc tests indicating an effect at ZT11-12 for both strains, and at ZT16-17 and 21 for C57 mice only (p < 0.035).
After the sleep deprivation both C3H and C57 mice showed an increase in SWA during NREM sleep (GLM-effect of day: C57 p < 0.001; C3H p < 0.001), and both strains had a significant interaction effect (p < 0.001 for both strains) between time of day and day. This effect was most visible during the light phase, immediately after the sleep deprivation, where C57 mice showed an increase in SWA compared with baseline in ZT 6–10 (p < 0.026), and C3H mice showed an increased SWA compared with baseline from ZT6-12–14 and 19, 20 (p < 0.020). C3H mice showed a larger increase than C57 (compared with their own respective baselines) from ZT6-8 and from ZT9-16 (p < 0.041).
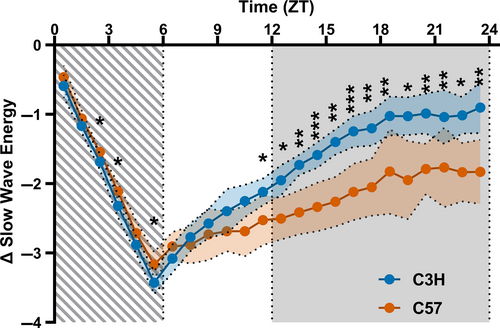
Because the responses to sleep deprivation were different between the two strains, we analysed in more detail the sleep deprivation and the recovery process of NREM sleep and SWA following sleep deprivation. In this analysis we pooled the time spent in NREM sleep with the expressed SWA by multiplying the percentage of time spent in NREM by the relative SWA for that time point. The resulting variable, called slow wave energy (SWE), is a measure for homeostatic sleep loss and recovery (Deboer, 2018). Subsequently, the difference with the corresponding baseline was calculated. A GLM indicated a significant effect (p < 0.001) for time of day, strain and their interaction on SWE (Figure 6). Post-hoc t-tests between the mouse strains indicated that C3H lost slightly, but significantly, more SWE during the sleep deprivation (ZT 2–4 and 5, 6 p < 0,040) but clearly recovered more SWE after ZT10 (p < 0.029) on the first day after sleep deprivation.
Per-frequency bin analysis showed a sleep deprivation-dependent relative increase in NREM sleep EEG-activity in C3H mice below 1.5 Hz, between 2.5–4.5 Hz and 6.0–13.0 Hz compared with C57 mice, while C57 mice showed a higher relative activity between 5.0 and 6.0 Hz (Figure 5). Additionally there was an interaction effect for day, strain and time between 0.5 and 1.0 Hz (p < 0.001), 3.5–6.0 Hz (p < 0.015) and 22.0–24.0 Hz (p < 0.014).
DISCUSSION
We have exposed mice of the C3H/HeNHsd and C57BL/6JOLAHsd strains to identical conditions and analysed daily locomotor activity patterns, sleep architecture, and EEG spectral activity. The data indicate differences between these two mouse strains in all three levels of analysis.
Locomotor activity profile
The largest differences between the strains in the locomotor activity profiles were found in the dark phase, when the animals are the most active. Where C3H mice seem to have a continuous pattern of locomotor activity during the dark phase, showing most activity during the early night and slowly and continuously decreasing activity as time in the dark phase progresses, C57 mice show a distribution of activity in two or three separate peaks over the dark phase.
C57 mice show more hourly activity in two of those peaks than C3H mice at the same time of day. The largest difference in activity between the two strains is in the last peak just before lights-on.
Sleep architecture
As was to be expected from the locomotor activity analysis, both strains showed a clear preference for wakefulness during the dark phase and a preference for sleep during the light phase. The most striking differences are also found in the late dark period. At this time point C57 mice show increased waking, while C3H mice show the mirror image: a strong reduction in waking and an increase in NREM sleep.
The increase in waking and activity in C57 mice has previously been considered the equivalent of a wake maintenance zone (WMZ): a period of time where the central circadian pacemaker is thought to induce wakefulness, during the late active phase (Collins et al., 2020), where sleep pressure is normally high. The WMZ has been proposed and studied frequently in humans (McMahon et al., 2021; Strogatz et al., 1987), but is not a prominently discussed phenomenon in mice. Our data in C3H mice, lacking the increase in waking and activity at the end of the day, suggest that C3H mice do not have the equivalent of a WMZ. This difference in activity at the late dark phase is even more interesting when compared with the nearly identical amount of activity and state distribution in both strains during the few hours around ZT20-22, just before the last activity peak of C57 mice. At this time, a suprachiasmatic nucleus-orchestrated reduction in activity, or siesta, was proposed in C57 mice (Collins et al., 2020). In our study both strains show a similar decrease in activity and waking around ZT20-22, strengthening the claim that this change is centrally organised. However, the continuous decrease in time spent awake in C3H mice after this time inclines us to not call the reduction in activity at ZT20-22 a siesta or nap in C3H mice. An explanation for the reduced waking and activity in the late night might be the shorter free-running rhythm that C3H mice have (Figures S1d,f and S2). Initiating light-phase like behaviour earlier, although the difference in free-running period (~10 min) seems to be rather small to be the only explanation.
Another striking difference was the amount of REM sleep during the dark phase. During the entire dark phase C3H mice show two to three times more REM sleep compared with C57 mice. From the episode distribution we conclude that C3H mice transit more from NREM to REM sleep during the dark phase, showing more, but shorter, NREM sleep episodes and more REM sleep episodes.
EEG spectral analysis
The most explicit strain difference in EEG spectral activity is the higher theta EEG activity (specifically 4.5–7.0 Hz) in C3H mice. Finding that this is the case in all three vigilance states makes it even more interesting. In humans, theta activity during waking seems to correlate with both time spent awake and active regional inhibition or cortical disengagement (Snipes et al., 2022), very much depending on the origin of the activity in that frequency. Previously, differences in theta peak frequency and theta to delta power have been shown between C3H and C57 mice (Maret et al., 2005; Tafti et al., 2003) and these findings were similar to the findings in our study.
Another remarkable difference in EEG activity is the consistent difference in 24 h amplitude in power density in the NREM sleep EEG. During NREM sleep C3H mice show a larger relative 24 hour amplitude than C57 mice in frequencies above 0.5 Hz, except between 2.0–6.0 Hz and between 19.0–21.0 Hz. The peak of this activity was generally observed around ZT13-19.
During waking, the differences between the strains (around 4.0–6.0 Hz and 8.0–9.0 Hz) in 24 h amplitude are likely to be caused by a shift of theta activity frequency between 7.0–8.0 Hz depending on the time of day, as shown before in rats for EEG activity around 8.0 Hz during REM sleep and waking (Yasenkov & Deboer, 2011).
Sleep deprivation
After the 6 h sleep deprivation both strains showed an increase in time spent asleep and in SWA during NREM sleep. The increase was larger in both variables in C3H mice, suggesting a stronger response to sleep deprivation in this strain. The analysis of the pooled parameter SWE gives information on the sleep loss during the sleep deprivation and the homeostatic response afterwards. The difference between the strains was very clear in SWE. While C3H mice start with a slightly larger debt in SWE directly after the 6 h sleep deprivation, it ends the day with a significantly higher level of SWE. C3H mice therefore recovered significantly more SWE in the 18 h following sleep deprivation.
A role for melatonin?
Although we did not measure melatonin in our group of animals, it has been well established that melatonin proficiency is an existing difference between the two strains (Kasahara et al., 2010; Kennaway, 2019; Roseboom et al., 1998; von Gall et al., 2000), and previous articles comparing C57 and C3H mice have discussed the observed differences in this context (Dinet et al., 2007; Homola et al., 2015; Metzger et al., 2020; Pfeffer et al., 2017; Sheynzon et al., 2005; Stehle et al., 2002). Since melatonin is known to be involved in sleep regulation we think it is appropriate to discuss its putative influence shortly.
Of all strain differences we observe, melatonin is most likely to play a role in the increased amount of REM sleep during the dark phase in C3H mice. This is in line with evidence of the involvement of melatonin and its receptors in switching from one vigilance state to another and possibly maintaining the state (Gobbi & Comai, 2019). Melatonin might also play an important role in the difference in vigilance state distribution at the end of the dark phase, when some melatonin is still present in C3H mice (Kennaway, 2019) and might be sleep promoting.
Additionally, melatonin may be involved in the difference in the amount of theta power, since this has been reported previously in humans (Cajochen et al., 1996), but not in rats (Fisher et al., 2008; Fisher & Sugden, 2009). In a melatonin receptor knockout mouse model, reduced theta power has been observed during NREM and REM sleep, possibly mediated by the MT1 receptor (Comai et al., 2013). The daily peak in EEG activity of different frequencies in the early to middle of the dark phase in C3H mice aligns well with the previously reported melatonin profile (Kennaway, 2019; Masana et al., 2000), while C57 mice show a much weaker daily rhythm in EEG power and more variance in the peak times in most frequencies.
A role for melatonin in the differences in rest–activity patterns is not likely, based on previous studies with knock-out and knock-in models of melatonin and its receptors (Pfeffer et al., 2017; C. Zhang et al., 2021; Z. Zhang et al., 2018). In these studies, the activity profiles closely matched the parent strains, regardless of the presence or absence of an endogenous melatonin rhythm. Further research with knock-in and knock-out models should be conducted to conclusively elucidate the role of melatonin in sleep phenotypes.
CONCLUSION
Here we provide an in-depth analysis of differences in sleep and the EEG between C57 and C3H mice which are both used extensively in biomedical research.
Of all the strain differences we observed, the differences in vigilance state distribution during the late dark phase and the amount of REM sleep are most likely influenced by the presence of melatonin.
The different activity profiles and the differences in the distribution of sleep and waking we observe in C3H and C57 mice are most likely a result of genetic background not related to melatonin. Future studies using knock-out and knock-in models should be able to more definitively determine the role of melatonin on theta activity, recovery from sleep deprivation and the daily patterns in NREM sleep EEG power density, since our data suggests a possible role for melatonin in these processes.
Our study is the latest in a tradition of comparative analyses between mouse strains, showing that large inter-strain differences regarding sleep architecture and EEG activity exist within the same species. We suggest that differences between mouse strains should be considered to improve the generalisability of studies investigating biomedical parameters related to sleep and circadian rhythms.
AUTHOR CONTRIBUTIONS
Rick van Dorp: Investigation; writing – original draft; methodology; formal analysis; visualization. Elisa Rolleri: Formal analysis; investigation; visualization; writing – review and editing. Tom Deboer: Conceptualization; funding acquisition; methodology; software; project administration; supervision; writing – review and editing.
FUNDING INFORMATION
The research was supported by a grant from the Velux Stiftung (Zurich, Switzerland) Project number 1289 to Tom Deboer.
CONFLICT OF INTEREST STATEMENT
The authors declare no conflicts of interest.
Open Research
DATA AVAILABILITY STATEMENT
The data that support the findings of this study are available from the corresponding author upon reasonable request.


