Geographic Variation of UV Stress Tolerance in Red Seaweeds Does Not Scale with Latitude Along the SE Pacific Coast
Abstract
Geographic variation of phenotypic traits affects the capacity of species to withstand and adapt to environmental stress. Here, we examined how geographic origin influences UV stress tolerance of the red seaweeds Chondracanthus chamissoi and Gelidium lingulatum distributed along the South-East Pacific coast between 20° S and 42° S. Seaweeds from six (C. chamissoi) and five (G. lingulatum) populations were grown under common-garden conditions and then exposed to consecutive UV stress events and essential biological traits (e.g., growth, photosynthetic responses, antioxidant capacity, and UV-absorbing compounds) were analyzed. In C. chamissoi, a strong UV sensitivity occurred in populations from mid-latitudes (27° S and 29° S) where the lowest recovery of maximum quantum yield (Fv/Fm; between 32.3% and 66.8% of control) and growth rate were observed. Likewise, the lowest amount of mycosporine-like amino acids (MAAs) and a significant decrease in phycobilins were registered in these populations. In G. lingulatum, recovery of Fv/Fm ranged from 82.0% to 97.7% of control, and antioxidant activity, carotenoid, and MAA contents were positively influenced by UV exposure. The multivariate analysis indicated a significant influence of PAR, cloud cover, and UV index on physiological traits, depending on species. The ecotypic differentiation index (EDI) indicated a higher phenotypic variation in C. chamissoi (EDI = 0.10) than G. lingulatum (EDI = 0.03). This study shows that the spatial distribution of UV stress tolerance in the studied seaweeds does not follow linear latitudinal or central–edge gradients. Instead, among-site variability of solar intensities driven by specific climatic conditions seems to act as driver of phenotypic variation.
Abbreviations
-
- DMF
-
- N,N-dimethylformamide
-
- DPPH
-
- 2,2-diphenyl-1-picrylhydrazyl
-
- EDI
-
- ecotypic differentiation index
-
- Fv/Fm
-
- maximum quantum yield
-
- MAAs
-
- mycosporine-like amino acids
-
- RDA
-
- Redundancy Analysis
Environmental heterogeneity is a powerful driver of intraspecific variation when divergent selection occurs between habitats (Linhart and Grant 1996). As a result, population-specific responses to environmental stress can arise within species (e.g., Valladares et al. 2014, King et al. 2018), imposing a challenge to obtain accurate predictions and effective management strategies for species under global change scenarios. For instance, the incorporation of intraspecific variation into predictive models requires a solid knowledge of the geographic variability of phenotypic traits (or phenogeography sensu Sotka 2012), as well as their underlying causal factors, which is still limited for several taxonomic groups.
Due to their sessile nature, benthic macroalgae or seaweeds are highly influenced by extrinsic environmental changes and have evolved specific phenotypic adjustments (Wiencke and Bischof 2012), which are the result of either ecotypic differentiation and/or phenotypic plasticity. While the first mechanism is favored by strong and persistent gradients of selective factors and low gene flow among populations, phenotypic plasticity is more probable in temporally heterogeneous habitats (Linhart and Grant 1996, Sanford and Kelly 2011).
Currently, the study of large-scale patterns in seaweeds has mainly focused on comparing populations at the center and boundary of their geographic ranges (reviewed by King et al. 2018). Generally, these studies have shown a better performance of central populations under stress conditions, thus supporting the center-to-margin hypothesis (e.g., Pearson et al. 2009) but also the local adaptation of edge populations (e.g., Jueterbock et al. 2014, Saada et al. 2016). In both cases, genetic diversity of local populations, modulated by connectivity and genetic drift, was a critical factor that favors or prevents local adaptation. However, studies in land plants revealed more variable patterns of geographic differentiation within species due to different scales of climatic variation (Linhart and Grant 1996, Abeli et al. 2014, Valladares et al. 2014). Indeed, according to Helmuth et al. (2006), local modifying factors can lead to geographic mosaics of thermal stress along benthic marine habitats, which could overcome the effect of latitudinal gradients on species performance. Thus, comparing only populations from central and range margins may not be sufficient to elucidate functional variation due to environmental heterogeneity.
In the case of seaweeds, the relationship between climatic heterogeneity and intraspecific variation has been mainly tested along vertical ranges. For instance, in intertidal brown seaweeds, genetic differentiation occurs despite gene flow due to the steep exposure gradient (Hays 2007, Zardi et al. 2011). Generally, individuals from the high intertidal are more resilient to abiotic stress than individuals from the subtidal zone (Bischof et al. 2006). To answer the question whether latitudinal gradients of main abiotic factors, and their local variability, are influencing the geographic differentiation of seaweeds requires experimental assessment of functional traits.
Solar radiation is a fundamental driver of biological processes in autotrophic organisms, influencing their patterns of distribution and abundance (Bischof et al. 2006, Austin and Van Niel 2011). The activity of photoprotective mechanisms is thought to reflect the vertical zonation of seaweeds, especially when the harmful ultraviolet radiation (UV-A and UV-B) is considered (Bischof et al. 1998, 2006). Mechanisms against UV radiation have mainly evolved to prevent DNA damage and malfunctions of biological processes such as photosynthesis, with the biosynthesis of UV-absorbing compounds and antioxidants being among the most important traits (Wiencke and Bischof 2012). In South America, as in other parts of the southern hemisphere, annual doses of PAR and UV radiation tend to decrease toward high latitudes mainly due to changes in the solar zenith angle (Diaz et al. 2006, Vernet et al. 2009). However, changes in stratospheric ozone concentration and cloudiness can also generate local variability in solar irradiance along the coast of Chile (18° S–56° S; Garreaud et al. 2011, Hernández et al. 2012). Thus, the seaweeds inhabiting this coast are exposed to contrasting solar environments, which could lead to geographic differentiation in their UVR tolerances.
Chondracanthus chamissoi (Gigartinales) and Gelidium lingulatum (Gelidiales) are two red seaweeds with a wide latitudinal distribution along the Chilean coast (Hoffmann and Santelices 1997). Additionally, both species are commercially important with the first species being a source of carrageenan and the second G. lingulatum being harvested for agar (Véliz et al. 2017, 2019). Current knowledge of the degree of intraspecific variation in the physiological traits of these two seaweeds is still scarce, even though this information can help in selection of suitable strains for aquaculture production and of appropriate source populations for restoration programs. This is especially relevant since there exist local reports of over-harvested populations of C. chamissoi (Hayashi et al. 2014) and Gelidium spp. (Santos and Melo 2018), highlighting the need for sustainable production and harvest alternatives of these and other seaweeds.
In natural habitats, Chondracanthus chamissoi is found principally in the shallow subtidal zone, while Gelidium lingulatum is growing in the intertidal zone of wave-exposed rocky shore. With respect to physiological traits involved in photoprotection, the amount of UV-absorbing MAAs appears to be related to local levels of PAR (which co-varied with UV irradiances) in both species, but field samples of G. lingulatum show less intraspecific variation in MAA contents than C. chamissoi (Véliz et al. 2019). For this reason, both species are ideal study models to assess the relationship between UV tolerance and the activity of photoprotective traits among populations. We hypothesized that within each species, there is a positive relationship between the incident irradiation at their site of origin and their photoprotective capacity (i.e., less reduction in growth and recovery of photosynthetic activity after UV exposure of subpopulations). Furthermore, we predicted that C. chamissoi will be more strongly affected by UV exposure than G. lingulatum due to its bathymetric distribution. To test these hypotheses, samples of both species from different latitudes (including populations at center and edge of their range of distribution) were experimentally exposed to UV radiation. These experiments, conducted under common garden environments, allow determining the genetic basis of phenotypic differences among populations, which can be visualized as persistent differences in functional traits after acclimation for several months.
Materials and Methods
Investigated species and sampling site
The red seaweeds Chondracanthus chamissoi and Gelidium lingulatum were collected along their geographic range on the coast of Chile during January and February 2016. Chondracanthus chamissoi was obtained from the subtidal zone (3–4 m depth) at six localities between 20° S and 42° S (~2,300 km; Table 1), whereas G. lingulatum was collected from intertidal rocky shores at five sites between 29° S and 42° S (~1,300 km; Table 1). Female gametophytes were used in C. chamissoi and tetrasporophytes in G. lingulatum because they were the predominant life cycle phase collected in each species. The relative position of each locality across its latitudinal range was also calculated to identify central and edge populations (Table 1), according to Sagarin and Gaines (2002): RI = 2 (L − S)/ R, where RI is the range index with values between − 1 and 1 (being − 1 = equatorward edge, 0 = center, 1 = poleward edge), L is the sampling site (in degrees of latitude), S is the midpoint of the distributional range, and R is the latitudinal range (in degrees of latitude).
| Species (geographic distribution) | Sampling site | Code | Latitude (° S) | Longitude (° W) | Range index |
|---|---|---|---|---|---|
| C. chamissoi (from 5° S to 42° Sa) | Iquique | IQU | 20°14′ | 70°08′ | −0.2 |
| Mejillones | MEJ | 23°04′ | 70°29′ | 0.0 | |
| Caldera | CAL | 27°40′ | 70°50′ | 0.3 | |
| La Herradura | LHE | 29°59′ | 71°23′ | 0.4 | |
| Coliumo | COL | 36°32′ | 72°57′ | 0.8 | |
| Lechagua | LEC | 41°52′ | 73°52′ | 1.0 | |
| G. lingulatum (From 23° S to 56° Sb; northern limit of distribution ~29° Sc) | La Pampilla | LPA | 29°57′ | 71°21′ | −0.9 |
| Maitencillo | MAI | 32°37′ | 71°25′ | −0.7 | |
| Curanipe | CUR | 35°50′ | 72°38′ | −0.5 | |
| Lebu | LEB | 37°43′ | 73°39′ | −0.4 | |
| Mar Brava | MBR | 41°56′ | 74°01′ | 0.0 |
The monthly averages of PAR (µmol photons · m−2 · s−1) and SST (°C) were determined for each sampling site (Fig. 1), using satellite data from MODIS Aqua level 3 (freely available from the NASA website: https://oceancolor.gsf.nasa.gov/cgi/I3) with a spatial resolution of 4 km. Data of PAR corresponded to monthly values from January 2013 to December 2015, whereas SST levels included the period between January and December 2015. The mean values of PAR corresponding to autumn, winter, and spring showed a negative correlation with latitude (P < 0.05; r = −0.80, r = −0.67, r = −0.67, respectively), but no relationship was observed between latitude and summer PAR values (P > 0.05, r = 0.02; Fig. 1). In the case of SST, its values were negatively correlated with latitude in all seasons (P < 0.05; autumn r = −0.98, winter r = −0.99, spring r = −0.98, summer r = −0.80; Fig. 1).

In the case of data for UV index and cloud cover, those were obtained from the Chilean Meteorological Agency website (https://climatologia.meteochile.gob.cl/), as a 5-year average for the period between 2013 and 2017, considering eight weather stations distributed from 20° S to 42° S (Fig. 1). The UV index showed a strong negative correlation with latitude during all seasons (P < 0.05; autumn r = −0.95, winter r = −0.97, spring r = −0.96, summer r = −0.73). The relationship between cloud cover and latitude was highly variable, with no association in winter and summer (P > 0.05; r = −0.24 and r = 0.01, respectively), whereas a positive correlation was observed in autumn (r = 0.38) and a negative one in spring (r = −0.51; Fig. 1).
Acclimation of species under identical laboratory conditions
In the first step, samples of Chondracanthus chamissoi and Gelidium lingulatum were acclimated under outdoor laboratory conditions (Marine Botany Laboratory, Coquimbo) for 5 and 8 months, respectively. Seaweeds were maintained inside outdoor tanks with continuous seawater flow (2 L · min−1) and permanent aeration. Sun-shading nets were put over each tank, reducing the incident PAR values by 80%. Then, both species were transferred to indoor conditions for 1 month to eliminate and prevent epiphyte contamination. Apical segments of 2–3 cm length were cut from individual thalli of both species. About 10–20 segments per thallus were placed in independent glass vessels, each containing 700 mL of autoclaved seawater enriched with half-strength von Stosch medium (VSES/2; Edwards 1970) that was renewed every 3 days. Continuous aeration was provided inside each vessel. The cultures were maintained in a temperature-controlled room at 14 ± 0.5°C, photoperiod of 12:12 h light:dark, and PAR values of 60 ± 5 μmol photons · m−2 · s−1.
Experimental design and set-up
The UV sensitivity of seaweeds was examined under controlled laboratory conditions in an experiment with two radiation treatments: PAR and PAR + UV. In Chondracanthus chamissoi, six populations were examined (Table 1) and 10 replicates per treatment were made for each population. These replicates were distributed over two consecutive runs (hereafter termed 1st and 2nd runs), which lasted 5 days each. These runs were conducted one after the other; the first run lasted from 5th until 10th July, whereas the 2nd run started on 16th and ended on 21st July 2016. In the case of Gelidium lingulatum, one experiment was conducted with the five source populations (Table 1) with eight replicates per treatment for each population. This experiment also lasted 5 d from 29th October until 3rd November 2016.
Seaweeds were exposed to radiation treatments for 5 consecutive days (see below). Samples for analysis of pigments, MAAs and antioxidant capacity were taken from the control and after the last UV pulse at day 5.
Exposure to UV radiation
Algal replicates were kept in an experimental container with 300 mL sterile seawater enriched with half strength von Stosch medium. Above these containers, three types of lamps were placed: UV-B 313 and UV-A 340 lamps (Q-Lab Co., Cleveland, OH, USA) as sources of UV radiation, and daylight fluorescent lamps (Philips 40 W), which provided PAR.
Cut-off filters were placed between the experimental containers and the light source to obtain two treatments: (i) PAR (395 nm cut-off filter = Ultraphan 395, Digefra GmbH), and (ii) PAR + UV (295 nm cut-off filter = Ultraphan 295, Digefra GmbH, Munich, Germany). Samples from the PAR treatment were used as control. PAR (60 ± 10 μmol photons · m−2 · s−1) was provided to all experimental seaweeds during the light period from 7:00 to 19:00 h. In the case of UV lamps, these were turned on for 2 h during five consecutive days, from 13:00 to 15:00 h. The light sources were positioned above the experimental containers following Véliz et al. (2006) to emit 2.4 W · m−2 of UV-B and 7.4 W · m−2 of UV-A. In terms of daily dose of UV, these values correspond to 17.1 kJ · m−2 of UV-B and 53.5 kJ · m−2 of UV-A, which represents approximately 34.2% and 2.8% of the daily doses of solar UV-B and UV-A registered by Gómez et al. (2004) in southern Chile (39°52' S) during the summer season. Given that both species are covered by water at high tide during part of the day, we considered that 2 h of UV exposure would be approximately representative of their natural daily doses of solar UV radiation. The PAR and UV irradiance were measured with a Li-190S quantum sensor connected to a LI-250 radiometer (LI-COR Inst., Lincoln, NE, USA) and a UV sensor (MU-100 UV, Apogee Inst., Logan, UT, USA), respectively.
Continuous aeration in the experimental containers ensured continuous movement and equal UV exposure of apical segments. During the experiment, enriched seawater was refreshed every 2 d. Experimental containers were placed in rectangular tanks (80 L) with continuous running seawater to avoid temperature shifts during UV exposure (temperatures varied from 13.2°C to 15.6°C during the experiments).
Determination of photosynthetic activity by chlorophyll a fluorescence
In vivo chlorophyll fluorescence of PSII was measured with a fluorometer PAM-2500 (Walz, Effeltrich, Germany). The maximal quantum yield (Fv/Fm) was determined in samples (10 replicates in Chondracanthus chamissoi and 8 replicates in Gelidium lingulatum) previously kept in darkness according to Hanelt et al. (1997). Measurements of Fv/Fm were carried out before the first UV pulse (initial value), then every day immediately after UV exposure, and again 19 h after the end of each UV exposure to assess recovery. Immediately after Fv/Fm determination, the samples were returned to their experimental container.
Inhibition of Fv/Fm was calculated as the percentage decrease between the values measured immediately after PAR + UV exposure (UVFv/Fm) and the Fv/Fm measured in the corresponding control (ControlFv/Fm), according to Hanelt et al. (1997): Inhibition (%) = 100 – (100 × [UVFv/Fm/ ControlFv/Fm]). Recovery of Fv/Fm was determined 19 h after the end of PAR + UV exposure by the following equation: Recovery (%) = 100 × (UVFv/Fm/ControlFv/Fm). According to natural daily cycles of Fv/Fm in seaweeds (see Gómez et al. 2004), 19 h is sufficient time to allow the restoration of photosynthetic activity when no photodamage of PSII has occurred.
Determination of photosynthetic pigments
Frozen samples were put in opaque vials filled with 1.5 mL of DMF and maintained at 4°C for 24 h for Chl a and carotenoid determination, whereas for phycobilin analyses these samples were ground with liquid nitrogen and mixed with 1.5 mL of 0.1 M phosphate buffer for 12 h at 4°C. Then, the extinctions of the extracts were measured in a scanning UV-visible spectrophotometer and the concentration (mg · g FW−1) was calculated according to Inskeep and Bloom (1985), Henley and Dunton (1995) and Beer and Eshel (1985), respectively.
Determination of MAAs
Samples dried in silica gel and ground in a mortar (about 10 mg of dry weight) were used to extract MAAs with 1 mL of 25% aqueous methanol (v/v) for 2 h in a water bath at 45°C. Seaweed extracts were prepared and analyzed by HPLC as detailed previously in Véliz et al. (2019) and based on Karsten et al. (1998). Briefly, after filtration of the extracts through a 0.22 μm MCM membrane filter, the MAAs were separated using a stainless steel Phenomenex Synergi 4 μ fusion RP column (C18, 4 μm, 250 x 3 mm I.D.) with a pre-column (RP-18 guard cartridge 4 × 3.0 mm I.D.). The mobile phase was 2.5% aqueous methanol plus 0.1% acetic acid (v/v) in water, run isocratically at a flow rate of 0.5 mL · min−1. Individual identification of each MAA was achieved by the analysis of absorption spectra and retention time in relation to the co-chromatography with secondary standards of Chondracanthus chamissoi and Gelidium lingulatum, previously obtained under the kind supervision of Ulf Karsten (University of Rostock, Germany).
Antioxidant capacity
The seaweed extracts were obtained according to Tala et al. (2016) by mixing ground frozen samples (about 100 mg fresh weight) with 1 mL of 70% ethanol and then incubated in a water bath at 50°C for 60 min. The extracts were centrifuged and 300 μL of supernatant was mixed with 700 μL of DPPH (50 mg · L−1 in 70% methanol) according to the free radical DPPH scavenging method of Brand-Williams et al. (1995). Reduction of the DPPH was calculated as a percentage of antioxidant capacity (AC) from the equation: AC (%) = (1 − [AF/AI]) x 100, where AF is the absorbance at 517 nm of algal extract after 30 min of reaction with DPPH and AI is the initial absorbance at time 0.
Biomass change
Total wet weight of seaweed samples was measured at the start (day 0) and day 5 of the experiment. Percent biomass change per day (BC % · d−1) was calculated with the equation: BC = (WF − WI)/WI * (100/T), where WF and WI are the final and initial wet weight of the individuals on the respective sampling days, and T is the number of days between sampling events.
Statistical analyses
Since the experiment with Chondracanthus chamissoi was repeated over two consecutive times (i.e., combined experiment), the homogeneity of error variances was analyzed with an F-test to determine the possibility of a combined analysis of data. Replicates from the 1st and 2nd run were pooled when the error variances were homogeneous and no interactive effects between runs and treatments were detected (Kuehl 2001). A combined analysis of data was not possible with Fv/Fm values, which were analyzed separately for each run. In both species, the effects of site of seaweed origin (populations) and exposure to radiation treatments on the amounts of MAAs, photosynthetic pigments, antioxidant capacity, and BC were evaluated with a two-factorial ANOVA. As Fv/Fm values were measured on subsequent days, those were evaluated with a two-factorial ANOVA with repeated measurements. A post-hoc Tukey's honest significant difference test was applied when significant effects were observed. Homogeneity of variances was analyzed using Levene's test and data were log-transformed when assumptions required for ANOVA were not met.
To compare the degree of phenotypic variation within species, the ecotypic differentiation index (EDI) presented by Carvajal et al. (2017) was calculated for fitness-related traits (i.e., recovery of photosynthetic activity, biomass change) that differed significantly among populations within each species. For this, the following equation was used: EDI = │(Meanpop − Meanspecies)│/ Meanspecies, where Meanpop is the main trait value for a given population and Meanspecies is the mean trait value for the species. The EDI values range from 0 to 1, with values close to 0 indicate little or no differentiation from the species mean value, whereas higher EDI values indicate greater differentiation. This EDI, which is conceptually related to indices of genetic population differentiation (e.g., Brommer 2011), was used in this study as a measure of phenotypic dissimilarity.
Multivariate redundancy analyses (RDA; Borcard et al. 2011) were carried out to assess the relationship between seaweed traits and environmental variables that directly influence photosynthetic activity, such as PAR, UV radiation (UV index), and cloudiness. Briefly, using the R package ‘vegan’ (Oksanen et al., 2018), significance test based on permutations was carried out to identify the best model, which included significant predictor variables not correlated among themselves. An adjusted R2 value was calculated as a measure of the percentage of variation in the response variables explained by predictors (Borcard et al. 2011). All statistical analyses were run using the R statistical software version 3.4.0 (R Development Core Team, 2016).
Results
UV-induced inhibition and recovery of maximum quantum yield of PSII
In both species, the daily exposure to 2h of UV radiation resulted in a marked decrease in Fv/Fm (Figs. S1 and S2 in the Supporting Information), which was significantly influenced by the geographic origin and days of experimentation (Table S1 in the Supporting Information). UV-induced reduction in Fv/Fm ranged between 15.8 ± 3.1% and 60.0 ± 10.5% in Chondracanthus chamissoi, and was strongest in the populations from mid latitudes (27° S and 29° S) at the last day of experimentation (Fig. 2). In the case of Gelidium lingulatum, all populations showed a similar range of Fv/Fm decrease (between 22.2 ± 7.7% and 55.3 ± 5.4%), with the highest inhibition on the first day of UV exposure (Fig. 3).
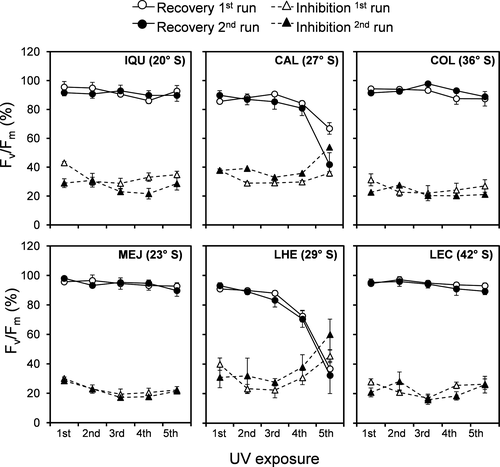
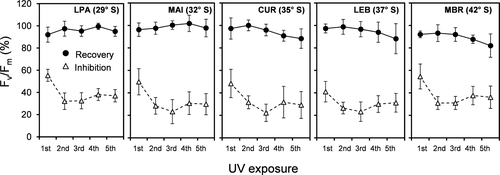
In both species, the recovery capacity of Fv/Fm at 19 h after UV exposure varied significantly among populations and decreased during the experiment (Table S1). In Chondracanthus chamissoi, the lowest recovery also occurred in the two populations from mid latitudes (between 32.3 ± 12.3 and 66.8 ± 4.0% of control; Fig. 2), whereas in Gelidium lingulatum a significant decrease was observed in the population from 42° S (Fig. 3).
Photosynthetic pigments
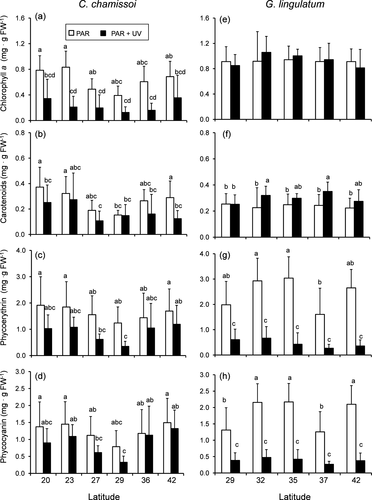
The amounts of pigments in both species varied significantly among populations and were differentially influenced by UV radiation (Fig. 4, Table S2 in the Supporting Information). In Chondracanthus chamissoi, exposure to UV radiation led to reduced Chl a (in populations from 20° S, 23° S, and 36° S; Fig. 4a), carotenoids (in populations from 20° S and 42° S; Fig. 4b), and phycobilins (in samples from 27° S and 29° S; Fig. 4, c and d). In the case of Gelidium lingulatum, the contents of Chl a were not influenced by geographic origin or UV exposure (Fig. 4e; Table S2), whereas carotenoids were positively influenced by UV radiation in populations from 32° S and 37° S (Fig. 4f). Phycobilin contents were highly reduced by UV radiation in all populations (Fig. 4h).
Mycosporine-like amino acids
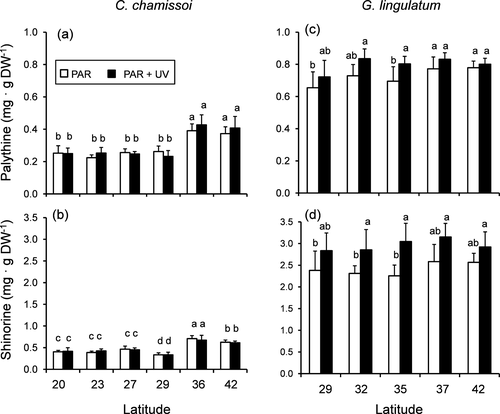
Two MAA types were identified in both species, palythine and shinorine (Fig. 5). In terms of total MAA contents, these compounds ranged from 0.6 ± 0.1 to 1.1 ± 0.1 mg · g DW−1 in Chondracanthus chamissoi (Fig. S3 in the Supporting Information) and from 2.9 ± 0.3 to 3.9 ± 0.3 mg · g DW−1 in Gelidium lingulatum (Fig. S3). In C. chamissoi, both MAAs were significantly influenced by populations (Table S3 in the Supporting Information), with the highest amounts in the southern samples from 36° S and 42° S (Fig. 5, a and b). In the case of G. lingulatum, the amounts of palythine were significantly influenced by populations and radiation treatment, whereas shinorine values were only affected by UV exposure (Table S3). Amounts of both MAAs increased after UV exposure in samples from 35° S, whereas shinorine content also increased in samples from 32° S (Fig. 5, c and d).
Antioxidant capacity
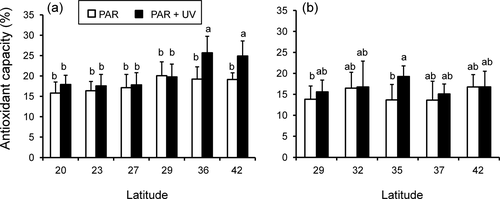
In both species, antioxidant capacity was significantly influenced by UV exposure (Table S2). Additionally, a significant interaction between UV exposure and populations was observed in Chondracanthus chamissoi (Table S2). In this latter species, higher values of MAAs were registered in the samples from 36° S and 42° S exposed to UV (Fig. 6), whereas in Gelidium lingulatum antioxidant capacity was induced by UV exposure in the population from 35° S (Fig. 5d).
Biomass change
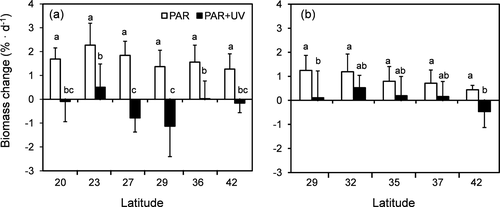
In both species, no differences among populations in biomass increase were observed under control conditions (Fig. 7). However, exposure to UV radiation produced a significant reduction in biomass in all populations of Chondracanthus chamissoi, with the highest decrease in the samples from 27° S and 29° S (Fig. 7a; Table S2); in Gelidium lingulatum populations from 29° S and 42° S lost weight after UV exposure (Fig. 7b; Table S2).
Relationship between environmental variables and phenotypic traits
The multivariate RDA analysis indicated a differential and significant effect of environmental variables on phenotypic traits, especially in Chondracanthus chamissoi (Table 2). In this species, the variation in MAAs was highly explained by PAR levels (R2 = 0.76), whereas photosynthetic traits were additionally influenced by cloud cover and UV index (R2 = 0.40 for both inhibition and recovery; Table 2). Contrary, in Gelidium lingulatum, only recovery of photosynthesis was significantly related to PAR and UV index, although with a weak association (R2 = 0.25; Table 2).
| Response | Predictor | DF (model, residual) | F | P | R2 adjusted |
|---|---|---|---|---|---|
| C. chamissoi | |||||
| MAAs |
PAR (MA) PAR (W) |
2, 57 | 94.29 | <0.001* | 0.76 |
| Antioxidant capacity |
UV Index (MA) Cloud cover (S) |
2, 57 | 29.47 | <0.001* | 0.49 |
| Chl a | 5, 54 | 1.58 | 0.193 | 0.04 | |
| Carotenoids |
PAR (MA) PAR (SP) |
2, 57 | 5.48 | 0.009* | 0.13 |
| Phycobilins |
Cloud cover (SP) Cloud cover (S) UV Index (S) |
3, 56 | 4.14 | 0.009* | 0.14 |
| Inhibition |
PAR (S) Cloud cover (S) |
2, 57 | 20.61 | <0.001* | 0.40 |
| Recovery |
PAR (S) UV Index (MA) Cloud cover (S) |
3, 56 | 14.32 | <0.001* | 0.40 |
| Biomass change |
Cloud cover (MA) Cloud cover (S) |
2, 57 | 8.97 | 0.002* | 0.21 |
| G. lingulatum | |||||
| MAAs | 4, 35 | 1.19 | 0.331 | 0.02 | |
| Antioxidant capacity | 4, 35 | 1.56 | 0.192 | 0.05 | |
| Chl a | 4, 35 | 1.56 | 0.200 | 0.05 | |
| Carotenoids | 4, 35 | 2.35 | 0.076 | 0.12 | |
| Phycobilins | 4, 35 | 1.78 | 0.177 | 0.07 | |
| Inhibition | 4, 35 | 1.21 | 0.325 | 0.02 | |
| Recovery |
PAR (SP) UV Index (MA) |
2, 37 | 7.62 | 0.004* | 0.25 |
| Biomass change | 4, 35 | 1.73 | 0.167 | 0.07 | |
Phenotypic differentiation within species
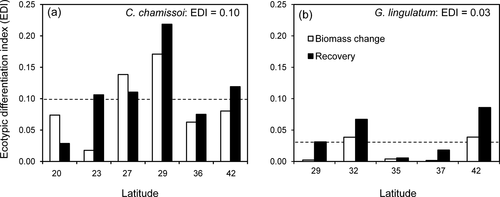
The ecotypic differentiation index (EDI), calculated for fitness-related traits that differ significantly among populations, showed a higher phenotypic differentiation in Chondracanthus chamissoi (EDIspecies = 0.10) than in Gelidium lingulatum (EDIspecies = 0.03; Fig. 8). Additionally, in C. chamissoi, a significant and negative correlation was observed between EDI calculated for biomass change (as indicator of growth) and the levels of PAR during the summer season (P < 0.05; ρ = −0.94; Table S4 in the Supporting Information).
Discussion
Geographic patterns of phenotypic variation within seaweed species
The study of geographic patterns in physiological performance is a necessary step to properly understand and describe the tolerance ranges of species due to different degrees of intraspecific differentiation in functional traits (Sotka 2012). In general, our results demonstrate that red seaweeds display population-specific responses related to their sensitivity to UV stress, being the intertidal Gelidium lingulatum more resilient to stress and physiologically flexible than the subtidal Chondracanthus chamissoi. Interestingly, neither latitudinal gradients nor center–margin patterns were found, contrary to the most commonly reported results for large brown seaweeds (reviewed in Eggert 2012, King et al. 2018).
In this study, the distinction between plastic and genetic responses was assessed by comparing populations acclimated under common-garden conditions for several months, being this the first such study for temperate red seaweeds from the SE Pacific coast. Although some limitations have been described for this experimental approach in marine invertebrates due to developmental plasticity and persistent maternal effects (Sanford and Kelly 2011), Hays (2007) showed that it is suitable for studying trait variability in seaweeds.
For Gelidium lingulatum, the high variability and the lack of differences among populations in most of the physiological traits studied suggest the predominance of phenotypic plasticity in this species; consequently, its generalist strategy could explain the absence of clear spatial patterns in UV stress tolerance. Contrary, Wieters et al. (2013) reported for the taxonomically related species Gelidium chilense a complex spatial variation in its UV tolerance linked to tidal height and site of origin. These differential results between these two species are in agreement with the specific segregation in physiological performance described for Chilean species of Gelidium (Oliger and Santelices 1981), albeit no common-garden acclimation was used in the study of G. chilense from the central coast of Chile.
In the case of Chondracanthus chamissoi, the marked variation among populations in photosynthesis, growth, and metabolites suggests ecotypic differentiation as main adaptive strategy. This intraspecific variation was not a linear response to the latitudinal gradient because populations from low (20° S and 23° S) and high latitudes (36° S and 42° S) were equally efficient in photosynthetic recovery, whereas seaweeds from mid-latitudes (27° S and 29° S) were severely affected, showing signs of chronic photoinhibition or even photodamage of PSII (sensu Murata et al. 2007). When traits were compared among populations, the most UV-sensitive seaweeds showed the lowest amounts of phycobilins and MAAs suggesting that both compounds are necessary in photoacclimation and photoprotective processes of C. chamissoi, as previously reported for red seaweeds in general (Bischof et al. 2006, Karsten 2008). In the case of the more UV-tolerant G. lingulatum, in addition to an increase in MAA contents and antioxidant capacity under UV exposure, higher amounts of carotenoids were also observed. Carotenoids can act as UV-absorbing compounds as well as quenchers of reactive oxygen species (Rastogi et al. 2010), thus contributing to UV tolerance. Future studies should also consider the analysis of additional traits, such as mechanism of enzymatic DNA repair (e.g., MacFadyen et al. 2004), to better understand the molecular base allowing geographic variation in UV tolerance.
With respect to the factors driving intraspecific variation in seaweeds, SST has been the most studied due to its effects on distribution patterns and the current concern about global warming (King et al. 2018). However, evidence from land plants indicates that solar irradiation is also a key factor influencing the geographic differentiation in autotrophic organisms (Austin and Van Niel 2011). Indeed, our results showed a significant relationship between environmental variables involved in determining local irradiation conditions (i.e., PAR, UV index, and cloud cover) and seaweed responses, especially in Chondracanthus chamissoi (Table 2). For instance, in this species, summer levels of PAR and cloud cover were related to the inhibition and recovery of photosynthetic activity (Table 2), both responses being considered as fitness-related traits in seaweeds (e.g., Saada et al. 2016). Cloud cover is an important determinant of solar radiation intensity on the Earth's surface since it can strongly attenuate the radiation depending on the cloud type (Matuszko 2012). Considering this, it is interesting to note that the most UV-sensitive populations of C. chamissoi are located around 30° S, where the poleward edge of the subtropical stratocumulus cloud regime is located along the SE Pacific (Garreaud et al. 2011). This area is considered a source of climatic instability with respect to the northern region, observing a higher percentage of cloudy skies over time (Molina et al. 2017). Thus, the local regime of cloud cover, by decreasing surface solar radiation, could reduce the strength of selection for UV-tolerant seaweeds around 30° S. In addition, the presence of a biogeographic boundary at 30° S–33° S, linked among other factors to oceanographic processes that limit gene flow along this zone (Guillemin et al. 2016), could also favor the intraspecific differentiation of marine benthic organisms (e.g., Broitman et al. 2018).
On the other hand, although not evaluated directly in this study, interactive effects of solar radiation and temperature on the spatial variation of stress tolerance of seaweeds cannot be discarded. Indeed, main enzymatic processes involved in the repair of UV-induced damage are temperature-dependent, such as the repair of DNA (MacFadyen et al. 2004) and the turnover and re-synthesis of D1 protein in the PSII (Wong et al. 2015).
Factors influencing adaptive differentiation within seaweed species
According to the recent review by King et al. (2018), the intraspecific variation of thermal niches is a widespread characteristic in seaweeds, but the analysis of the underlying mechanisms is still scarce for most species. Nevertheless, the selective pressure of environmental factors and the intensity of gene flow arise as main evolutionary forces from experimental studies in marine organisms and land plants (Sanford and Kelly 2011, Sotka 2012, Abeli et al. 2014). Generally, since phenotypic plasticity is favored under temporal and predictable environmental heterogeneity (Valladares et al. 2014), intertidal seaweeds could benefit from employing this mechanism in their changing habitat. In fact, our results suggest that the intertidal Gelidium lingulatum displays mostly a generalist strategy. However, phenotypic plasticity and ecotypic differentiation are non-exclusive mechanisms (Sanford and Kelly 2011), being the latter also reported in intertidal species such as Fucus vesiculosus, F. spiralis, and F. serratus (Pearson et al. 2009, Ferreira et al. 2014, Saada et al. 2016).
Furthermore, the different scales at which environmental factors and gene flow occur in natural habitats complicate the identification of the drivers of adaptive differentiation. For instance, ecotypic differentiation can arise even across small spatial scales in intertidal seaweeds when differences in emersion time are strong enough to produce disruptive selection (Hays 2007, Zardi et al. 2011). In other cases, trans-Atlantic dispersal has been suggested as sufficient to neutralize genetic differentiation between eastern and western Atlantic populations of tropical seaweeds (Pakker et al. 1996).
To date, rafting transport on buoyant seaweeds (e.g., Macrocystis pyrifera, Durvillaea antarctica) appears as an important mechanism that facilitates genetic connectivity among distant populations (Macaya et al. 2016). In this way, Gelidium lingulatum seems to disperse along the Chilean coast by rafting on D. antarctica (López et al. 2017), and this strategy could contribute to the lack of ecotypic differentiation in this species. Contrary, Chondracanthus chamissoi has not been reported with floating seaweed rafts (Macaya et al. 2016, López et al. 2018), which suggests that its genetic connectivity may be limited as the only way of dispersal is via short-lived propagules.
Conclusions
The study of large-scale patterns of intraspecific variation is a necessary step to understanding the adaptive potential of species given the challenging scenarios of climate change and anthropogenic disturbances. Seaweeds appear as a group in which intraspecific differentiation is common, but their specific adaptive mechanisms are not yet well understood (Sotka 2012, King et al. 2018). Although the study of several populations across the entire species range is a demanding task, our results showed that comparing only populations from central and range margins may not be sufficient to elucidate functional variation within species, especially when selective factors are not linearly related to latitude.
Our results suggest that both phenotypic plasticity and ecotypic differentiation in red seaweeds are apparently linked to bathymetric origin and dispersal capacity. Although solar radiation is a key factor for autotrophic organisms, its effect on geographic differentiation has been underestimated in seaweeds in comparison to land plants. Large-scale patterns of tolerance to UV stress seem to be mainly driven by the local variation of solar irradiation, rather than being determined by the latitudinal gradient of annual radiation. Similarly, in seagrasses, the geographic variation of sensitivity to abiotic stress has been mainly related to causal factors acting at seasonal and local scales such as the type of microhabitats and timing of low tides (Soissons et al. 2018). This complex spatial distribution of the physiological performance in benthic species highlights the need of incorporating more than 2 or 3 (center, edge) populations when intraspecific differentiation is assessed.
This study was funded by PhD Grant CONICYT 21130402 to K.V., and CONICYT/FONDECYT 1131082 to M.T. We appreciate the laboratory facilities provided by the Centro de Investigación y Desarrollo Tecnológico en Algas (CIDTA). We are very grateful to Gabrielle Grenier, Sarah Funkenhauser, David Yañez, and Samanta García for their collaboration in laboratory activities, and to Carlos Lara for providing satellite data.


