
Stealth Acquisitions and Product Market Competition
ABSTRACT
We examine whether and how firms structure their merger and acquisition deals to avoid antitrust scrutiny. There are approximately 40% more mergers and acquisitions (M&As) than expected just below deal value thresholds that trigger antitrust review. These “stealth acquisitions” tend to involve financial and governance contract terms that afford greater scope for negotiating and assigning lower deal values. We also show that the equity values, gross margins, and product prices of acquiring firms and their competitors increase following such acquisitions. Our results suggest that acquirers manipulate M&As to avoid antitrust scrutiny, thereby benefiting their own shareholders but potentially harming other corporate stakeholders.
A core mission of regulators in most countries is to prevent anticompetitive practices that harm consumers. To carry out this mandate in the United States, the Department of Justice (DOJ) and Federal Trade Commission (FTC) conduct extensive reviews to evaluate the potential impact of corporate mergers and acquisitions (M&As) on competition. Concerns about the increasing incidence of anticompetitive M&As motivated the adoption of the Hart-Scott-Rodino (HSR) Antitrust Improvements Act of 1976, which established a pre-merger notification threshold that requires parties to notify the DOJ and FTC of their intent to merge if their deal is above a specified value.1 Recent adjustments to the threshold rule mean that the vast majority of M&As now go without antitrust review (e.g., Wollmann (2019)).2 Thus, although a key purpose of M&As is to achieve productivity improvements for acquirers or synergies between acquirers and targets (e.g., David (2021)), many questions remain about the potential anticompetitive effects of M&As that are not subject to regulatory scrutiny.
A long line of corporate finance research examines the role of M&As in creating or destroying shareholder value (see, e.g., Eckbo (1983), Schipper and Thompson (1983), Asquith (1983), Agrawal, Jaffe, and Mandelker (1992)), and suggests that one important way M&As create value for shareholders is by consolidating the acquirer's industry to increase the firm's own market power (e.g., Hoberg and Phillips (2010a), Fathollahi, Harford, and Klasa (2021)). Such increases in market power can be substantial and potentially harmful to other corporate stakeholders—especially consumers—and thus are precisely the reason that antitrust regulators pay close attention to the competitive effects of M&As. Accordingly, prior literature typically assumes that firms conduct their M&As seeking regulatory approval for a given deal under the confines of the current antitrust regime. However, this literature assumes away the possibility that firms can actively circumvent the regulatory rules for screening of anticompetitive deals.
In this paper, we study whether firms engage in “stealth acquisitions,” that is those deliberately negotiated and structured to assign deal values that fall “just below” the regulatory notification threshold. We find a substantial number of stealth acquisitions whereby firms manipulate the terms of their M&A financial and governance contracts to avoid oversight and review by antitrust regulators. These acquisitions, while beneficial to shareholders of the acquiring firm, have broader stakeholder implications by inducing anticompetitive effects that can harm other corporate stakeholders (e.g., target shareholders and consumers).
The question of acquirers systematically circumventing antitrust rules is not only of academic interest to financial economists. Reflecting concerns about stealth acquisitions, the FTC recently launched initiatives aimed at understanding the anticompetitive effects of nonreportable deals (FTC (2020)).3 For example, in 2020 the FTC launched antitrust investigations into all nonreportable acquisitions since 2010 by five of the leading U.S. technology firms—Amazon, Apple, Facebook, Google, and Microsoft—due to concerns that many of these deals had anticompetitive consequences (e.g., Kamepalli, Rajan, and Zingales (2021)). These regulatory concerns extend beyond the technology sector, as stealth acquisitions in nontechnology industries could have more direct consequences for other stakeholders in terms of increased product prices for consumers. Yet little is known about whether acquirers across industries systematically structure deals to evade the notice of resource-constrained antitrust regulators and, if so, how these stealth acquisitions are structured and the extent to which these deals impact product market competition. This paper attempts to fill this gap.
Using data on all M&A transactions for U.S. firms between 2001 and 2019, we first document evidence of a discontinuity around the pre-merger notification threshold. Specifically, we find a 28% to 45% higher-than-expected number of deals “bunching” immediately below the threshold that would trigger antitrust review.4 We refer to these potentially manipulated deals as “stealth acquisitions.” If scrutinized by antitrust regulators, these stealth acquisitions would increase the number of Second Requests by 4% to 6%.5 We further find that bunching of M&As just below the threshold does not occur when we examine other M&A deals whose values are further away from the threshold that would trigger antitrust review, when we focus exclusively on acquisitions in industries that are always exempt from the pre-merger notification program (i.e., hotels and real estate; FTC (2008)), and when we assess deal discontinuity based on the next year's notification threshold. Evidence of significant M&A activity just below the threshold, together with the absence of such a discontinuity in the “falsification tests” suggests that some acquirers deliberately manage the size of their deals to avoid antitrust review.
We next conduct several tests to better understand the characteristics of the targets and acquirers engaging in these stealth acquisitions. First, consistent with concerns that large public companies find ways to make reportable transactions nonreportable, we find that acquisitions involving public firms acquiring smaller private targets are 31.3% more likely to occur just below the threshold. We also find that financial contracts incorporating earnouts, which allow managers of acquiring firms to exercise discretion in the methods used to assign deal values so that they fall just below the deal-size threshold, are more likely in these just-below acquisitions. In addition, we find that deals involving acquirers that extend the directors and officers (D&O) insurance coverage of private target firms or that agree to higher post-acquisition breach-of-terms deductible thresholds, both of which can allow acquirers to negotiate lower deal values, are more likely to be just below the threshold. Consistent with these lower deal values being actively managed to avoid antitrust review, we find that public acquirers pay lower deal premiums for private targets in acquisitions that fall just below the threshold.
One might wonder why, in equilibrium, managers of target firms are willing to accept values that are manipulated to fall below the threshold. We conduct several tests that provide insights into why target firm managers would be willing to make such decisions. First, we find that deals involving cash payments, which reduces the exposure of targets to risk associated with the post-acquisition stock holding requirements of U.S. securities laws, are 28% more likely to be just-below deals. Second, consistent with concerns that acquirers can take advantage of target shareholders by providing private benefits to target CEOs in exchange for lower deal values (e.g., Morck, Shleifer, and Vishny (1988), Fich, Cai, and Tran (2011)), we find that deals with governance contracts that employ target CEOs post-acquisition are more likely to be stealth acquisitions, and in such cases earnout provisions are 6% more likely to pay off. These findings suggest that acquirers compensate target firms and their managers for lower deal values with implicit and explicit benefits in financial and governance contracts to facilitate deal values that fall below the threshold that otherwise would have triggered antitrust review.
Next, we study the economic incentives of acquirers to negotiate and assign lower deal values to avoid antitrust scrutiny. We expect deals involving acquirers with incentives to coordinate with their targets—for example, acquisitions in concentrated industries, which are typically of greater concern to antitrust regulators due to their potential to harm consumers (Gowrisankaran, Nevo, and Town (2015), Wollmann (2019), Eliason et al. (2020))—are more likely to fall just below the pre-merger review threshold. Consistent with this expectation, we find that the discontinuity is largely due to acquirers with the strongest incentives to coordinate with their targets, that is, rivals from the same industry. We also find that this relation is more pronounced for deals that involve acquirers and targets in the same geographic area and deals in more concentrated industries. Together, these findings suggest that deals likely to have anticompetitive effects that are harmful to consumers tend to be structured as stealth acquisitions that narrowly avoid antitrust review.
We conduct several tests to examine whether stealth acquisitions benefit acquiring firms’ shareholders at the cost of other stakeholders such as consumers through reduced product market competition. Prior studies argue that certain patterns in the returns of industry rivals around a merger are indicative of reduced product market competition. In particular, benefits of mergers that only provide synergies to the acquirer should not propagate to rival firms, while benefits from mergers that result in increases in product market prices should (e.g., Eckbo (1983), Stillman (1983), Chevalier (1995a), Fathollahi, Harford, and Klasa (2021)). Consistent with the anticompetitive nature of stealth acquisitions, we find that public announcements of just-below mergers are associated with 12.5% higher abnormal returns for rival firms when such acquisitions are horizontal in nature, that is between direct competitors operating in the same industry, relative to announcements of horizontal mergers that are just above the threshold. We also examine changes in the gross margins of acquirers and their industry rivals and find a 1.1-percentage-point increase in industry-average gross margins in the year after horizontal acquisitions falling just below the threshold compared to horizontal acquisitions just above the threshold.
As a direct test of the impact of stealth acquisitions on consumers, we narrow our focus to three acquisitions during our sample period—one just below, one just above, and one well below the pre-merger deal value threshold—by horizontal rivals in the consumer products industry. This analysis, which employs product-level prices for the acquirer and rivals that share common products with the targets, is based on the idea that product pricing patterns of industry rivals following events that reduce product market competition can help identify anticompetitive behavior (e.g., Chevalier (1995b), Azar, Schmalz, and Tecu (2018)). Consistent with reduced product market competition, we find an increase in average monthly product prices for product market rivals’ common products following our stealth acquisition of interest, while we find no change in prices for the just-above or well-below deals.
We conduct several additional tests to assess the robustness of our results and consider potential alternative explanations. Our results are robust to alternative bin sizes, do not hold for several definitions of already-exempt mergers, are robust to alternative fixed effect structures (e.g., industry-year), and are robust to alternative definitions of “horizontal” mergers (e.g., Hoberg and Phillips (2016)). When we consider several nonmutually exclusive alternative explanations for our inferences, we do not find evidence that the bunching we find below the threshold is driven by (i) acquirers’ incentives to delay merger announcements until the subsequent year, (ii) mergers that are already exempt under alternative thresholds (i.e., the “size-of-person” test), or (iii) firms avoiding Second Requests from antitrust authorities for innocuous reasons.
Our study makes three contributions to the broad literature on the role of M&As in product market competition. First, we contribute to the emerging literature on the relation between antitrust enforcement screening and M&A activity. Although newly exempt horizontal deals increased following a change to the notification screening thresholds (Wollmann (2019, 2020)), our study highlights differences in and potential manipulation of the contracts of deals that fall just below the threshold. In particular, we show that firms can structure M&As to avoid antitrust scrutiny and reduce competition by exploiting regulators’ monitoring resource constraints at the expense of target shareholders and consumers. Although prior literature typically assumes that managers extract private benefits from shareholders alone, our study adopts a broader stakeholder governance perspective to shed light on the possibility of managers extracting private benefits from other, nonshareholder stakeholders such as consumers.
Our study also contributes to the literature on the interaction between corporate finance and product market competition—for example, Eckbo (1983, 1992), Chevalier (1995a, b), Sheen (2014), Wollmann (2020), Eliason et al. (2020), Fathollahi, Harford, and Klasa (2021)—by providing initial evidence on whether and how acquirers intentionally structure deals to avoid antitrust enforcement and reduce product market competition. A concurrent study by Wollmann (2020) on mergers in the U.S. kidney dialysis sector does not find bunching of M&A deal values around the notification thresholds, and attributes this result to the legal risk associated with intentional avoidance of notifications. In related work, Cunningham, Ederer, and Ma (2021) show that incumbent pharmaceutical firms acquire innovative targets solely to “kill” their projects, and that some of these deals fall just below the threshold for pre-merger review, but they do not examine how these deals are structured to avoid antitrust scrutiny. Our study contributes to this recent literature by documenting the explicit financial and governance contracting mechanisms that are used to manipulate deal values. Given the effects of these deals on nonshareholder stakeholders such as consumers, future research at the intersection of corporate finance and antitrust regulation can play a particularly important role in informing academic and policy debates about shareholder- versus broader stakeholder-based corporate governance (e.g., Bebchuk (2004, 2005), Edmans (2021)).
Finally, our study contributes to the industrial organization literature on the evolution and regulation of competition (e.g., Shahrur (2005), Azar, Schmalz, and Tecu (2018), Wollmann (2019), De Loecker, Eeckhout, and Unger (2020)). Our evidence suggests that concerns about the limited efficacy of sharp pre-merger review guidelines are warranted (e.g., Rose and Sallet (2020)), as a conspicuous number of firms appear to manipulate their deal size to circumvent regulatory review, potentially harming consumers. Moreover, while our focus on M&As around this threshold is well-suited to identify bunching as evidence of deal manipulation, our findings likely extend to M&As around other filing thresholds and regulations. Therefore, if anything, our estimates likely underestimate the frequency and impact of M&A antitrust regulation avoidance.
The remainder of this paper proceeds as follows. Section I discusses institutional features of antitrust regulation for M&A deals and related academic literature. Section II describes our sample and key variables. Section III presents results on the existence of and contracting for stealth acquisitions. Section IV presents results on the effects of stealth acquisition on product market competition. Section V provides concluding remarks.
I. Institutional Background and Related Literature
A. Antitrust Regulation and M&As
Competition law in the United States places strict limits on the ability of M&A deals to impact industry competition. For instance, Section 7 of the Clayton Act prohibits M&As “in any line of commerce or in any activity affecting commerce in any section of the country, [where] the effect of such acquisition may be substantially to lessen competition or tend to create a monopoly.” Moreover, Section 5 of the FTC Act prohibits “unfair” methods of competition. To enforce these regulatory objectives, the antitrust division of the DOJ and the FTC rely on the HSR Antitrust Improvements Act of 1976 to review potential anticompetitive effects of M&A deals before they take place. The filing of the pre-merger notification report allows regulators up to 30 days to perform a review of whether the proposed transaction will adversely affect U.S. commerce under antitrust laws.6 Figure 1 illustrates the FTC's typical pre-merger review notification process and potential outcomes of this process on an M&A deal's ability to proceed.

Although the HSR Act initially required notification filings on all transactions that exceeded a threshold of $15 million, in 2000 Congress significantly amended this size-of-transaction threshold to apply only to transactions with a deal value above $50 million.7 The rationale for exempting deals with a value below $50 million was that such transactions were unlikely to raise substantive antitrust concerns. In which case requiring notifications for smaller deals may impose an unnecessary burden on firms and/or weaken regulators’ monitoring capacity, costs that can exceed the social welfare or efficiency benefits from identifying competitive issues from small deals.8
The adjustment to the size of the transaction threshold had a dramatic effect on pre-merger notifications. Notably, while the number of annual notifications increased by around 33% in the three-year period leading up to the 2000 size-of-transaction threshold amendment, notifications fell by 79% in the three years immediately following the amendment (FTC (2004)). Recent evidence suggests that the increase in the size-of-transaction threshold increased the prevalence of horizontal mergers between firms in the same industry. For instance, Wollmann (2019) estimates that the decade following the threshold increase witnessed up to 324 additional horizontal mergers per year that collectively involved the acquisition of targets worth a total of $53 billion in annual revenue. Further, while the general authority granted to FTC and DOJ under Sections 6 (b), 9, and 20 of the FTC Act and Section 1312 of the United States Code on Commerce and Trade permits them to retrospectively investigate nonreportable transactions, Wollmann (2019) shows that mergers that are newly exempted from the pre-merger notification requirement are less likely to be subject to regulatory investigation after the M&A deal is executed. These observations give rise to concerns that smaller nonreportable M&A deals can also raise competitive issues that violate antitrust statutes.
Concerns over antitrust risk from small deals are further supported by anecdotal evidence of higher financial gains that acquirers realize from such deals. For example, a study conducted by McKinsey & Company indicates that firms that adopt a systematic approach to M&As through the use of an increased number of small deals are able to accrue more market capitalization relative to peers that focus on larger deals and selective acquisitions (Rudnicki, Siegel, and West (2019)). These concerns have led antitrust regulators to question the potential anticompetitive effects arising from nonreportable M&A transactions. For instance, in a 2014 speech, DOJ Deputy Assistant Attorney General Overton noted that potential harm to consumers is unlikely to be captured by the size of the transaction or by merging party market values (DOJ (2014)), and he elaborated on how nonreportable transactions could give rise to antitrust concerns, including harm to consumers in regional markets, adverse effects on the market for a key input to a downstream product, and reduced competition in a narrow product market that still creates broader or national issues (e.g., impair the quality of voting equipment systems).
Consistent with these regulatory concerns, antitrust challenges against nonreportable transactions have increased significantly in recent years (e.g., Mason and Johnson (2016)). Moreover, in February 2020, the FTC issued an order under Section 6(b) of the FTC Act to formally launch its own antitrust investigations into every nonreportable acquisition made by five of the leading U.S. technology firms—Google, Amazon, Apple, Microsoft, and Facebook—dating as far back as 2010.9 The FTC stated that its probe would help it understand “whether large tech companies are making potentially anticompetitive acquisitions of nascent or potential competitors that fall below HSR filing thresholds” and reform its policies to promote competition and protect consumers. Subsequent statements released by FTC commissioners Rohit Chopra and Christine Wilson questioned the sufficiency of the HSR notification process in other industries and called for studies across a broader range of industries to gain a better understanding of the competitive effects of nonreportable mergers (Wilson and Chopra (2020)).
B. Related Literature
Although it is illegal for firms to engage in business practices that harm competition under Section 7 of the Clayton Act, a large body of industrial organization research studies firms’ incentives to engage in anticompetitive behavior (e.g., Stigler (1964), Harrington and Skrzpacz (2011)). Within this literature, several studies examine how lax M&A antitrust enforcement in the pharmaceutical industry leads to an increase in anticompetitive mergers and worse product market outcomes for consumers in terms of higher product prices (e.g., Eliason et al. (2020)).10 Furthermore, Cunningham, Ederer, and Ma (2021) provide evidence that this result is due in part to large acquirers amassing firms with similar research projects and terminating overlapping innovation—that is, risky pharmaceutical drug projects—of targets. These studies examine whether certain M&A deals have anticompetitive effects, but do not examine how firms achieve such anticompetitive M&A deals in the first place.
Building on this literature, a burgeoning corporate finance literature explores the broader relation between anticompetitive behavior and corporate finance practices. For example, Eckbo (1992) and Shahrur (2005) find that horizontal mergers tend to be bad for consumers and that rents accrue to all firms in an industry following horizontal M&A deals, consistent with recent evidence on firms’ efforts to more easily navigate the FTC's antitrust review process (e.g., Mehta, Srinivasan, and Zhao (2020)). More recently, Dasgupta and Žaldokas (2019) find that increases in the cost of explicit collusion lead to more M&A activity and equity issuances, and Azar, Schmalz, and Tecu (2018) provide evidence from the U.S. airline industry that a common ownership structure can lead to anticompetitive pricing strategies.
Our study contributes to these growing corporate finance and economics literatures by identifying (i) evidence of firms manipulating the size of their M&A deals to avoid antitrust scrutiny as a novel channel through which firms avoid regulatory scrutiny, (ii) the financial contracting characteristics of these stealth acquisition deals that facilitate regulatory avoidance, (iii) heterogeneous industry and market conditions that incentivize firms to participate in stealth acquisitions, and (iv) the impact of these stealth acquisitions on competition among firms’ product market rivals. In these regards, our study is the first to examine firms’ avoidance of antitrust regulation by manipulating the size of their deals, and offers novel evidence that such avoidance is detrimental to consumers.
II. Data and Descriptive Statistics
A. Data Sources and Key Variables
Our initial sample comes from all completed and terminated U.S. M&As involving public and private targets and acquirers announced from January 2001 to February 2020 on the Thomson Securities Data Company (SDC) Mergers and Acquisitions database. Following Moeller, Schlingemann, and Stulz (2005), we exclude deals below $1 million. We also discard all deals involving targets that are financial firms (SICs 6000 to 6999) or regulated utilities (SICs 4900 to 4999), as M&As of these types are subject to industry-specific merger regulation that is unrelated to our analysis. Finally, we exclude deals involving the acquisition of hotels and motels (SIC 7011), as these acquisitions are always exempt from pre-merger review (FTC (2008)). This selection process, presented in Panel A of Table I, yields a final sample of 19,886 deals with nonmissing acquirer and target firm data for the key variables in our analyses. We use this sample of deals to test for a discontinuity in M&As around the pre-merger review threshold and assess the types of firm and deal characteristics involved in stealth acquisitions.
| This table presents the sample selection procedure for the full sample of M&As (Panel A) and for the near-threshold sample of M&As (Panel B). The sample is constructed using the universe of deals from the Securities Data Company (SDC) Mergers and Acquisition database announced between February 1, 2001 and February 27, 2020. In addition, Panel C presents the top 10 industries in our full sample of 19,886 deals, using Fama-French 48-industry classifications, Panel D presents the comparable distributions for the top 10 industries in two subsamples representing deals with transaction values that are within 10% of the annual FTC notification threshold, that is deal values that are either ≥0% but ≤10% below the threshold or >0% but ≤10% above the threshold (i.e., just-below-threshold deals and just-above-threshold deals, respectively). Panel B presents the top 10 industries separately for below- and above-threshold deals. | |
|---|---|
| Panel A: Sample Selection (Full Sample) | |
| All U.S. public and private M&As (>$1 mil.) from February 1, 2001 to February 6, 2020 | 34,839 |
| Less: Deals with missing data on % acquired, % owned before, or % owned after | (6,225) |
| Less: Deals involving financial firms or utilities | (7,212) |
| Less: Deals involving real property for rental or investment purposes, or hotels | (1,495) |
| Less: Deals when acquirer purchases remaining interest of its own subsidiary | (21) |
| Full sample of deals | 19,886 |
| Panel B: Near-Threshold Sample | |
|---|---|
| Just-above-threshold M&As | 274 |
| Just-below-threshold M&As | 366 |
| Sample of near-threshold deals | 640 |
| Panel C: Industry Distribution (Top Ten Industries) | ||
|---|---|---|
| Fama-French 48-Industry Groups | Number of Deals | Percentage of All Deals |
| Top 10 | ||
| Business services | 6,417 | 32.27 |
| Pharmaceutical products | 1,305 | 6.56 |
| Healthcare | 1,012 | 5.09 |
| Electronic equipment | 991 | 4.98 |
| Wholesale | 776 | 3.90 |
| Retail | 753 | 3.79 |
| Medical equipment | 716 | 3.60 |
| Communication | 665 | 3.34 |
| Computers | 570 | 2.87 |
| Transportation | 503 | 2.53 |
| Total (Top 10) | 13,708 | 66.40 |
| Panel D: Industry Distribution (Within ±10% of Annual Threshold) | ||||
|---|---|---|---|---|
| Just-Below Threshold | Just-Above Threshold | |||
| Fama-French 48-Industry Groups | Number of Deals | Percentage of Deals “Below” | Number of Deals | Percentage of Deals “Above” |
| Top 10 | ||||
| Business services | 123 | 33.61 | 93 | 33.94 |
| Pharmaceutical products | 22 | 6.01 | 17 | 6.20 |
| Electronic equipment | 22 | 6.01 | 11 | 4.01 |
| Medical equipment | 20 | 5.46 | 13 | 4.74 |
| Retail | 18 | 4.92 | 15 | 5.47 |
| Healthcare | 13 | 3.55 | 16 | 5.84 |
| Wholesale | 13 | 3.55 | 7 | 2.55 |
| Personal services | 12 | 3.28 | 7 | 2.55 |
| Computers | 12 | 3.28 | 13 | 4.74 |
| Construction | 10 | 2.73 | 3 | 1.09 |
| Total (Top 10) | 265 | 72.40 | 195 | 71.13 |
We also examine the financial contracting terms, incentives, and product-level prices for stealth acquisitions. Although we rely on the Center for Research in Security Prices (CRSP) and SDC for data to construct many of our key variables, data to capture other deal provisions important to our study (e.g., earnouts, deal premiums for private targets, provisions for extended D&O coverage, and post-closing deductible thresholds) are collected by reading through merger-related financial contract disclosures found in EDGAR 8-K, 10-Q, and 10-K public filings. For tests that require extensive hand collection, we restrict our test sample to 640 deals that fall just below and above the pre-merger notification thresholds, presented in Panel B of Table I. Our data collection process is detailed in the Internet Appendix.11
B. Descriptive Statistics
Panel C of Table I shows that the top 10 industries represented in our full sample account for almost 70% of M&A deals, with the largest number of deals (around 30% of all deals) completed by acquirers in the business services industry. Panel D of Table I presents the comparable distributions for the top 10 industries in two subsamples representing deals with transaction values that are within 10% of the annual FTC notification threshold—that is, deal values that are either ≥0% but ≤10% below the threshold, or > 0% but ≤10% above the threshold (just-below-threshold deals and just-above-threshold deals, respectively). We find that the top 10 industries in these two subsamples consist of the same industries in Panel C, with the exception of the personal services industry and the construction industry, indicating that the mix of deals that occur near the pre-merger notification threshold is similar to the mix across all M&A deals. Further, the two subsamples are similar to each other and the full sample on the distribution of observations across industries (e.g., business services accounts for 33% to 34% of observations). The absence of any industry being overrepresented in the subsample of deals that are within 10% below the threshold suggests that the scrutiny of deals by DOJ/FTC does not appear to vary significantly across industries in a manner that produces a greater concentration of below-threshold deals in certain industries.
Panel A of Table II presents descriptive statistics on the variables used in our main empirical analyses. We find that the average deal value of acquisitions in our full sample is approximately $400 million (DealValue) and that roughly 77% of deals involve a private target (PrivateTarget).
| This table presents the distribution of key variables used in our analysis. All variables are defined in Appendix A. Panel A presents descriptive statistics for all variables for both the pooled and the near-threshold analysis, and Panel B presents descriptive statistics for key variables in the near-threshold analysis (split by below versus above the pre-merger review threshold). *, **, *** indicate significance at the 10%, 5%, and 1% levels, respectively. | ||||||
|---|---|---|---|---|---|---|
| Panel A: Key Variables (Pooled and Near-Threshold Analysis) | ||||||
| Variable | N | Mean | SD | 25th | Median | 75th |
| Deal analysis | ||||||
| PublicAcquirer | 19,886 | 0.69 | 0.46 | 0.00 | 1.00 | 1.00 |
| PrivateAcquirer | 19,886 | 0.15 | 0.36 | 0.00 | 0.00 | 0.00 |
| PublicTarget | 19,886 | 0.23 | 0.42 | 0.00 | 0.00 | 0.00 |
| Public-Public | 19,886 | 0.12 | 0.33 | 0.00 | 0.00 | 0.00 |
| Public-Private | 19,886 | 0.57 | 0.49 | 0.00 | 1.00 | 1.00 |
| Private-Private | 19,886 | 0.09 | 0.29 | 0.00 | 0.00 | 0.00 |
| Private-Public | 19,886 | 0.06 | 0.24 | 0.00 | 0.00 | 0.00 |
| AllCash | 19,886 | 0.32 | 0.47 | 0.00 | 0.00 | 1.00 |
| AllStock | 19,886 | 0.08 | 0.28 | 0.00 | 0.00 | 0.00 |
| AllCashandOther | 19,886 | 0.78 | 0.41 | 1.00 | 1.00 | 1.00 |
| AllStockandOther | 19,886 | 0.48 | 0.50 | 0.00 | 0.00 | 1.00 |
| Horizontal | 19,886 | 0.28 | 0.45 | 0.00 | 0.00 | 1.00 |
| Intrastate | 19,886 | 0.19 | 0.39 | 0.00 | 0.00 | 0.00 |
| Earnouts | 19,886 | 0.10 | 0.30 | 0.00 | 0.00 | 0.00 |
| EarnoutPerc | 19,886 | 3.60 | 13.11 | 0.00 | 0.00 | 0.00 |
| AcqTermFeePercent | 19,886 | 0.00 | 0.02 | 0.00 | 0.00 | 0.00 |
| PublicTargetDealPremium | 3,642 | 64.58 | 456.29 | 14.34 | 31.46 | 54.28 |
| EconomicTie | 603 | 0.75 | 0.43 | 0.00 | 1.00 | 1.00 |
| PrivateTargetDealPremium | 222 | 55.74 | 22.84 | 40.63 | 57.21 | 73.40 |
| EarnoutPayoff | 45 | 0.69 | 0.47 | 0.00 | 1.00 | 1.00 |
| Financial contracting analysis | ||||||
| ExtendedLiabilityCoverage | 234 | 0.53 | 0.50 | 0.00 | 1.00 | 1.00 |
| DeductibleThreshold | 192 | 0.33 | 0.47 | 0.00 | 0.19 | 0.50 |
| Returns and gross margin analysis | ||||||
| RivalRet | 594 | 0.00 | 0.03 | −0.01 | 0.00 | 0.01 |
| ∆ GrossMargin | 364 | 0.01 | 0.04 | −0.01 | 0.00 | 0.02 |
| Product pricing analysis | ||||||
| NormalizedPrice | 1,915,291 | 0.05 | 1.02 | −0.70 | 0.00 | 0.71 |
| JustBelowThreshold | 1,915,291 | 0.21 | 0.41 | 0 | 0 | 0 |
| Post | 1,915,291 | 0.49 | 0.50 | 0 | 0 | 1 |
| Product pricing analysis | ||||||
| Below-Threshold | ||||||
| Price | 77,835,861 | 6.46 | 3.31 | 3.99 | 5.67 | 8.09 |
| CommonProduct | 77,835,861 | 0.01 | 0.07 | 0.00 | 0.00 | 0.00 |
| Post | 77,835,861 | 0.46 | 0.50 | 0.00 | 0.00 | 1.00 |
| Above-Threshold | ||||||
| Price | 4,091,337 | 19.65 | 25.16 | 6.79 | 9.99 | 23.74 |
| CommonProduct | 4,091,337 | 0.06 | 0.24 | 0.00 | 0.00 | 0.00 |
| Post | 4,091,337 | 0.49 | 0.50 | 0.00 | 0.00 | 0.00 |
| Further-Below-Threshold | ||||||
| Price | 4,760,492 | 3.64 | 0.91 | 3.00 | 3.69 | 3.99 |
| CommonProduct | 4,760,492 | 0.26 | 0.44 | 0.00 | 0.00 | 1.00 |
| Post | 4,760,492 | 0.53 | 0.50 | 0.00 | 1.00 | 1.00 |
| Controls | ||||||
| DealValue | 19,886 | 400.33 | 2,625.67 | 7.50 | 26.00 | 120.00 |
| TenderOffer | 19,886 | 0.04 | 0.19 | 0.00 | 0.00 | 0.00 |
| PrivateTarget | 19,886 | 0.77 | 0.42 | 1.00 | 1.00 | 1.00 |
| NumRivals | 594 | 40.54 | 55.77 | 4.00 | 14.00 | 49.00 |
| RepsSurvive | 232 | 0.59 | 0.49 | 0.00 | 1.00 | 1.00 |
| SurvivalPeriod | 222 | 0.85 | 0.95 | 0.00 | 1.00 | 1.50 |
| TargetTermFeePercent | 19,886 | 0.01 | 0.03 | 0.00 | 0.00 | 0.00 |
| Panel B: Near-Threshold Sample (±10% of Threshold) | ||||||||
|---|---|---|---|---|---|---|---|---|
| Just-Below Threshold | Just-Above Threshold | |||||||
| Variable | N | Mean | Median | N | Mean | Median | Diff. in Means | Diff. in Medians |
| Deal analysis | ||||||||
| PublicAcquirer | 366 | 0.73 | 1.00 | 274 | 0.73 | 1.00 | 0.00 | 0.00 |
| PrivateAcquirer | 366 | 0.10 | 0.00 | 274 | 0.13 | 0.00 | −0.03 | 0.00 |
| PublicTarget | 366 | 0.19 | 0.00 | 274 | 0.23 | 0.00 | −0.04 | 0.00 |
| Public-Public | 366 | 0.08 | 0.00 | 274 | 0.12 | 0.00 | −0.04* | 0.00* |
| Public-Private | 366 | 0.65 | 1.00 | 274 | 0.61 | 1.00 | 0.04 | 0.00 |
| Private-Private | 366 | 0.05 | 0.00 | 274 | 0.07 | 0.00 | −0.02 | 0.00 |
| Private-Public | 366 | 0.05 | 0.00 | 274 | 0.07 | 0.00 | −0.02 | 0.00 |
| AllCash | 366 | 0.36 | 0.00 | 274 | 0.33 | 0.00 | 0.02 | 0.00 |
| AllStock | 366 | 0.04 | 0.00 | 274 | 0.09 | 0.00 | −0.05** | 0.00*** |
| AllCashandOther | 366 | 0.85 | 1.00 | 274 | 0.76 | 1.00 | 0.09** | 0.00*** |
| AllStockandOther | 366 | 0.42 | 0.00 | 274 | 0.47 | 0.00 | −0.05 | 0.00 |
| Horizontal | 366 | 0.28 | 0.00 | 274 | 0.26 | 0.00 | 0.02 | 0.00 |
| Horizontal(Continuous) | 366 | 0.43 | 0.33 | 274 | 0.35 | 0.15 | 0.08** | 0.18** |
| Intrastate | 366 | 0.17 | 0.00 | 274 | 0.20 | 0.00 | −0.03 | 0.00 |
| Earnouts | 366 | 0.16 | 0.00 | 274 | 0.11 | 0.00 | 0.05* | 0.00* |
| EarnoutPerc | 366 | 4.62 | 0.00 | 274 | 3.57 | 0.00 | 1.05 | 0.00 |
| AcqTermFeePercent | 366 | 0.00 | 0.00 | 274 | 0.00 | 0.00 | 0.00** | −0.00** |
| PublicTargetDealPremium | 50 | 93.46 | 47.36 | 51 | 65.62 | 49.05 | 27.84 | −1.69 |
| PrivateTargetDealPrem | 133 | 55.00 | 56.60 | 89 | 56.87 | 56.60 | −1.87 | 0.00 |
| EconomicTie | 343 | 0.80 | 1.00 | 260 | 0.68 | 1.00 | 0.12*** | 0.00*** |
| EarnoutPayoff | 28 | 0.64 | 1.00 | 17 | 0.76 | 1.00 | −0.12 | 0.00 |
| Financial contracting analysis | ||||||||
| ExtendedLiabilityCoverage | 123 | 0.54 | 1.00 | 111 | 0.51 | 1.00 | 0.03 | 0.00 |
| DeductibleThreshold | 105 | 0.39 | 0.24 | 87 | 0.27 | 0.06 | 0.12** | 0.18 |
| Returns and gross margin analysis | ||||||||
| RivalRet | 344 | 0.00 | 0.00 | 250 | 0.00 | 0.00 | 0.00 | 0.00 |
| ∆GrossMargin | 206 | 0.01 | 0.01 | 158 | 0.01 | 0.02 | 0.00 | −0.01 |
| Controls | ||||||||
| DealValue | 366 | 59.35 | 58.27 | 274 | 66.66 | 65.13 | −7.31*** | −7.86*** |
| TenderOffer | 366 | 0.03 | 0.00 | 274 | 0.03 | 0.00 | 0.00 | 0.00 |
| RepsSurvive | 122 | 0.61 | 1.00 | 110 | 0.56 | 1.00 | 0.05 | 0.00 |
| SurvivalPeriod | 116 | 0.87 | 1.00 | 106 | 0.84 | 1.00 | 0.03 | 0.00 |
| TargetTermFeePct | 366 | 0.00 | 0.00 | 274 | 0.01 | 0.00 | 0.01 | 0.00* |
| NumRivals | 344 | 39.66 | 14.00 | 250 | 41.76 | 13.50 | −2.10 | 0.50 |
Panel B of Table II illustrates how the acquirer, target, and deal attributes vary across the two restricted subsamples of just-above- and just-below-threshold deals. Although the statistical difference between the values of deals (DealValue) involving just-above- and just-below-threshold targets is expected, the mean difference amounts to only $7.31 million, which is small relative to the general variance of deal values in our full sample (standard deviation = $2.6 billion). This implies that deals just above and just below the threshold are in essence fundamentally similar, as suggested by the insignificant differences in the values of nearly all of the other variables across the two subsamples of firms. We find some evidence of greater use of earnouts (Earnouts) and cash and other nonstock payments (AllCashandOther), as well as lower use of all-stock financing (AllStock), in just-below-threshold deals. Moreover, acquirers in deals that are just below the threshold are more likely to have a future economic tie with a target CEO (EconomicTie).
III. Characteristics of Stealth Acquisitions
This section examines three features of stealth acquisitions. First, we examine the existence and prominence of stealth acquisitions by assessing the frequency of deals occurring just below relative to just above the pre-merger review notification threshold. The advantage of this approach is that it focuses on a narrow subset of deals in close proximity to the threshold, deals for which merger activity and attributes of the acquirers and targets involved should be similar. Second, we examine differences in deal and financial contract characteristics for M&A deals occurring just below relative to just above the pre-merger review notification threshold. These tests allow us to identify the types of deals that most often bunch just below as well as the financial and implicit contracting mechanisms that facilitate acquirers’ ability to manipulate deal values to below-notification levels. Finally, we investigate whether stealth acquisitions are more likely to consist of deals that can lead to anticompetitive outcomes. Together, these analyses allow us to understand the incentives that drive firms to intentionally structure deals to avoid antitrust scrutiny.
A. Existence of Stealth Acquisitions
We first examine whether firms seeking to avoid antitrust review structure financial contracts such that deal sizes bunch just below the pre-merger review dollar-based threshold, leading to a discontinuity in the number of M&As occurring in close proximity to the threshold. While circumventing the review process significantly reduces potential regulatory costs, such as forced asset divestitures or even blocking of the merger, to the benefit of shareholders, anticompetitive behavior following the acquisitions of existing or nascent competitors can attract complaints from customers and competitors in the aftermath of acquisitions. This in turn can prompt regulators to conduct post-acquisition reviews and issue enforcement actions aimed at deals that were not subject to pre-merger notification—even years after deals have been completed, which can be costly to shareholders. The significance of this threat is underscored by the fact that remedies sought by antitrust regulators in such cases can be harsher than in deals with pre-merger notification (Heltzer and Peterson (2018)). This is because the unwinding of transactions to restore competition to pre-merger levels can require the closure of business units, divesture of acquired assets at fire-sale prices, and other costly interventions.12 Such potential costs can disincentivize acquirers and targets from manipulating transaction sizes to avoid notification. Consistent with this view, Wollmann (2020) does not observe bunching of deal values just below the threshold in the dialysis industry. As such, the extent to which a discontinuity exists in the number of M&As surrounding the notification thresholds across sectors in the broader economy is an open question.
A.I. Research Design
To first document evidence on the existence of stealth acquisitions, that is, on a discontinuity in the number of M&A deals around the pre-merger notification threshold, we take advantage of two notable features of the HSR Act: (i) annual adjustments to the dollar-based threshold for requiring pre-merger notifications (shown in Figure 1), and (ii) the tracking of these adjustments to the U.S. gross national income growth rate. Together, these features result in a time-varying threshold that grows (or shrinks) by unequal dollar amounts annually, which we exploit to examine near-threshold deal size activity.
In our first set of tests, we use these signed distances and employ McCrary's (2008) test for a discontinuity at the threshold (e.g., Jäger, Schoefer, and Heining (2021)). The null hypothesis of the McCrary test in our setting is that the discontinuity around the pre-merger notification threshold is zero, that is, absent manipulation of deal sizes, a significant difference in the number of deals occurring just below relative to just above the threshold should be unobservable. In a first stage, McCrary's test obtains a finely graded histogram and smooths the histogram on either side of the threshold using local linear regression techniques. In a second stage, the McCrary test evaluates the difference in the density heights just below and just above the threshold. A finding of a significant difference in these heights would be indicative of a discontinuity.
A.2. Main Results
Figure 2 presents a graph of the McCrary (2008) test of continuity in the density function around the pre-merger review threshold. The solid lines, which depict the density function around the review threshold along with the 95% confidence intervals (i.e., dotted lines), provide visual evidence of a discontinuity. A Wald test, reported in Panel A of Table III, confirms this by rejecting the null of continuity of the density function at the threshold (p-value < 0.01).

| This table presents results of tests of the statistical difference between the frequency of just-below-threshold deals and just-above-threshold deals. In Panel A, we report results for the difference in density heights around the threshold related to Figures 2 and 5. The log difference in heights is from the perspective of the bin just to the right of the threshold (i.e., a negative sign indicates the right bin is lower than the left bin). In Panel B, we report results for the difference between actual and estimated frequencies of deals occurring in the bins just to the left and just to the right of zero related to Figure 3. *** indicates significance at the 1% level. The estimation procedure follows the methods in McCrary (2008) in Panel A and Burgstahler and Dichev (1997) in Panel B. | ||
|---|---|---|
| Panel A: Difference in Density Heights | ||
| Log Diff. in Heights | t-Statistic | |
| Difference around threshold (Figure 2) | −0.680*** | −5.019 |
| Falsification test (Figure 4) | 0.129 | 0.445 |
| Panel B: Difference in Estimated and Actual Bin Heights (Figure 3) | ||||
|---|---|---|---|---|
| Bin | Frequency (Actual) | Frequency (Estimated) | Difference | t-Statistic |
| JustBelowThreshold | 176 | 121 | 55*** | 4.046 |
| JustAboveThreshold | 96 | 141 | −45*** | −3.103 |
The results above provide evidence that is consistent with the manipulation of deals by acquirers and targets to avoid pre-merger antitrust reviews. Nonetheless, we conduct several additional tests to further support this inference.14
In our initial additional test, given that the McCrary (2008) method automatically selects optimal bin widths, we construct a histogram on bin widths of $2.5 million around the pre-merger review threshold and compare the frequency of deals above versus below the threshold. The histogram, presented in Figure 3, shows that deal frequencies generally increase as deal values decrease. However, we find a sharp increase in the number of deals occurring in the bin to the immediate left of the threshold as compared to the bin to the immediate right.15 To test whether there is a significant difference in these bin heights relative to what we would expect, we employ a commonly used statistical approach for testing for discontinuities. This approach entails comparing the actual frequency of deals in each bin with the expected deal frequency, computed as the mean of deal frequencies in the two adjacent bins. The results, reported in Panel B of Table III, show that the actual number of deals in the left (right) bin is around 45% (30%) higher (lower) than the expected number (p-value < 0.01).16 Given that over our sample period the FTC and DOJ made 928 Second Requests, of which 10% involved mergers occurring above and within $50 million of the threshold, our results suggest an economically meaningful number of deals (i.e., 55) that represent a nearly 6% increase in Second Requests potentially manipulated to avoid pre-merger review.17,18

A.3. Falsification Tests
We conduct a set of falsification tests to help alleviate the concern that other prominent deal features explain the phenomenon we observe around the threshold. We first test for discontinuities at other points in the distribution of deals by constructing a set of “placebo” thresholds (e.g., Goncharov, Ioannidou, and Schmalz (2021)). To construct placebo thresholds, we adjust the actual threshold in a given year by ±1% to ±25% relative to the actual threshold value, and standardize the threshold each year around zero.19 Under the assumption that these other thresholds are as-if random, the rank of the McCrary t-statistic at the actual threshold when compared to the ranks of the McCrary t-statistics for these placebo thresholds indicates the probability of observing a similar t-statistic as we find in our main results by chance. We limit this analysis to 50 placebo thresholds—25 above the actual threshold and 25 below—since deals occur increasingly less (more) frequently above (below) the actual threshold, which could result in spurious discontinuities as there are significantly fewer deals (zero in many cases) in deal value bins far above the actual threshold.20 Using these 51 t-statistics, we estimate a p-value for the percentile rank, which is calculated by taking the rank of a t-statistic relative to the other t-statistics (rank) and dividing by the number of permutations (n) plus one (i.e., rank/n+1). The resulting p-value represents the probability of observing a discontinuity by random chance.
Figure 4 plots t-statistics over all 50 placebo thresholds and the actual threshold.21 The t-statistic for the discontinuity at the actual threshold—see Table III, Panel A—has the second-highest rank (i.e., rank = 2), with a p-value of 0.039 (2/51).22 To increase the precision of this test, we increase the number of permutations within ±1% to ±25% of the threshold to 100—50 above and 50 below the actual threshold—we randomly draw one threshold, and we repeat our analysis for all 100 permutations, resulting in 100 t-statistics. We find that the t-statistic for the actual threshold has the highest rank (rank = 1) and a p-value of 0.009 (i.e., 1/101).

We conduct two additional falsification tests. First, we repeat our main McCrary test using a sample of real estate and hotel M&A deals that occur around the threshold and, by law, are always exempt from pre-merger review (FTC (2008)), and repeat the analysis in from our main McCrary test. The McCrary graph presented in Figure 5 reveals no detectable discontinuity around the threshold (t-statistic of 0.445; see also Table III, Panel A).23 Second, in Figure 6, we assign the following year's threshold to each year. We find no discontinuity under this alternative threshold. Collectively, the results from these falsification tests support our inference that the discontinuity of deals documented in our earlier analyses is driven by the manipulation of deals to avoid pre-merger reviews. In the following analysis, we examine the techniques and incentives that drive the avoidance of pre-merger antitrust review, and we explore the implications of these stealth acquisitions for acquirer and target shareholders, rivals, and consumers.


B. Financial Contracting for Stealth Acquisitions
We next examine whether deals bunching just below the threshold involve financial contract characteristics that differ systematically from (i) all other deals, and from (ii) deals just above the threshold in subsequent near-threshold tests.
We first focus on examining the types of acquirers and targets participating in just-below-threshold deals. We then examine a set of deal terms that legal practitioners suggest could incentivize or induce target managers to structure deals that avoid pre-merger reviews. Specifically, we look at (i) the form of payment (cash versus stock), (ii) the deal premium level, (iii) the use of contingency payments such as earnouts, (iv) the extension of D&O insurance for target managers and directors, and (v) the deductible acquirers are willing to pay before demanding breach-of-terms damages from the target.
B.I. Research Design
In our first set of tests, to provide evidence that JustBelowThresholdi,t deals differ in systematic ways from other deals occurring below but not proximate to the threshold, we estimate (2) using both our full sample of M&As and our sample of near-threshold deals.
B.2. Results
To determine the types of firms that are likely to be involved in stealth acquisitions, we estimate equation (2) using indicator variables that capture the ownership status of targets and acquirers (i.e., public versus private). Our results, reported in the first four columns of Table IV, indicate that deals that involve public acquirers buying public targets (column (1)) are less likely to fall just below the threshold. Notably, in column (2), we find that takeovers of privately held firms by publicly listed ones are 31.3% (0.005/0.016) more likely to be just-below-threshold deals, aligning with recent concerns of regulators on nonreportable deals undertaken by large public acquirers.25,26
| This table presents results from OLS regressions of M&As on acquirer-target characteristics. The dependent variable, JustBelow, is an indicator that assumes the value of 1 if a deal's transaction value is within a 10% window below the FTC annual pre-merger review threshold, and 0 otherwise. The main variables of interest in columns (1) to (4) are indicator variables that assume the value of 1 based on combined acquirer-target characteristics, and 0 otherwise. The main variables of interest in columns (5) to (8) are indicator variables that take the value of one if the deal's payment terms are structured as 100% cash, 100% stock, 100% cash and other (i.e., debt and earnouts), or 100% stock and other, respectively. We control for the size of the deal (DealValue) in all specifications and for public targets (PublicTarget) in columns (5) to (8). All variables are defined in Appendix A. All columns include target-firm industry fixed effects (using Fama-French 48-industry classifications) and year fixed effects. Robust t-statistics are reported in parentheses and calculated using standard errors clustered at the target-firm industry and year levels. *, **, *** indicate significance at the 10%, 5%, and 1% levels, respectively. | ||||||||
|---|---|---|---|---|---|---|---|---|
| (1) | (2) | (3) | (4) | (5) | (6) | (7) | (8) | |
| Dependent Variable | JustBelow | JustBelow | JustBelow | JustBelow | JustBelow | JustBelow | JustBelow | JustBelow |
| Public-Public | −0.007** | |||||||
| (−2.64) | ||||||||
| Public-Private | 0.005** | |||||||
| (2.71) | ||||||||
| Private-Private | −0.010*** | |||||||
| (−3.40) | ||||||||
| Private-Public | −0.004 | |||||||
| (−1.57) | ||||||||
| AllCash | 0.005* | |||||||
| (2.01) | ||||||||
| AllStock | −0.013*** | |||||||
| (−12.16) | ||||||||
| AllCashandOther | 0.008*** | |||||||
| (4.01) | ||||||||
| AllStockandOther | −0.006* | |||||||
| (−1.95) | ||||||||
| DealValue | −0.000*** | −0.000*** | −0.000*** | −0.000*** | −0.000*** | −0.000*** | −0.000*** | −0.000*** |
| (−3.82) | (−5.96) | (−5.08) | (−5.60) | (−4.22) | (−4.49) | (−3.47) | (−4.47) | |
| Constant | 0.019*** | 0.016*** | 0.020*** | 0.019*** | 0.018*** | 0.021*** | 0.013*** | 0.023*** |
| (231.01) | (17.09) | (238.40) | (362.25) | (51.04) | (132.57) | (11.17) | (16.50) | |
| Observations | 19,886 | 19,886 | 19,886 | 19,886 | 19,886 | 19,886 | 19,886 | 19,886 |
| Adjusted R2 | 0.001 | 0.002 | 0.002 | 0.001 | 0.002 | 0.002 | 0.001 | 0.002 |
| Year fixed effects | Yes | Yes | Yes | Yes | Yes | Yes | Yes | Yes |
| Industry fixed effects | Yes | Yes | Yes | Yes | Yes | Yes | Yes | Yes |
Next, we evaluate the prevalence of cash-financed deals, which, by providing lower risk payoffs, might lead targets to accept a lower offer price that helps acquirers avoid pre-merger reviews. The results from this analysis, presented in columns (5) to (8) of Table IV, indicate that deals that include all-cash payments (column (4)) or a combination of cash and other nonstock consideration (column (7)) are indeed 28% (0.005/0.018) and 62% (0.008/0.013) more likely to be just-below-threshold deals. Conversely, we find that all-stock-financed acquisitions (column (6)) and deals employing a combination of stock and other noncash consideration (column (8)) are much less prevalent in just-below-threshold acquisitions.27 The greater use of cash versus stock payments in just-below-threshold deals is consistent with targets accepting the most liquid and least risky form of payments in exchange for a lower deal price, given post-acquisition holding requirements in stock transactions prescribed by U.S. securities laws (“Rule 144”; Latham and Watkins (2008)).28
In addition to, or as an alternative to, offering lower risk payoffs to targets, legal practitioners highlight other options available to acquirers that may facilitate the manipulation of deal values to avoid pre-merger notifications. First, we consider the use of earnouts, that is deferred payments that are contingent on a target's ability to meet or exceed certain milestones, in just-below-threshold deals. An important nuance of the pre-merger regulations is that the inclusion of contingency payments such as earnouts necessitates the assessment of the fair value of the acquisition rather than using the face value of the deal to determine whether the deal meets the size-of-transaction test for filing pre-merger notifications. The FTC expects that the fair value determinations will be performed in good faith and on a commercially reasonable basis by the acquirer's board of directors. However, use of an earnout could be an accounting and valuation method to generate a fair valuation that falls below the pre-merger notification thresholds.29 We investigate this possibility for a restricted sample of deals with values falling within a ±10% window centered around the FTC threshold after hand-collecting the relevant granular data on acquisitions—for example, use of extended D&O insurance—which would increase the power of these tests if collected for the full sample.30
Table V presents the results. Consistent with the view that earnouts allow greater discretion in assigning deal values, the results reported in column (1) indicate that the use of earnouts is associated with a 6.2-percentage-point increase (or 39% increase compared to the sample mean) in the probability of a deal being just below relative to just above the threshold (p-value < 0.05). When we examine whether earnouts account for a larger fraction of transaction value in the just-below-threshold deals, conditional on deals using earnouts, we do not find significant results (column (2) of Table V), likely due to the fact that the use of valuation methods to generate deal values below notification thresholds is triggered by the existence rather than the size of earnouts.
| This table presents results from OLS regressions of M&As on financial contract characteristics. The sample is restricted to observations for which the deal value falls within a ±10% window centered on the FTC threshold (see Table I, Panel B). The dependent variable, JustBelowThreshold, is an indicator variable that assumes the value of 1 if a deal's transaction value is within a 10% window below the FTC annual pre-merger review threshold, and 0 otherwise. The main variable of interest in column (1) is an indicator variable that assumes the value of 1 if the financial contract includes a provision for earnouts, and 0 otherwise. Results presented in column (2) are conditional on the inclusion of an earnout provision, where the main variable of interest is a continuous variable that measures the percentage of the transaction value represented by earnouts. All variables are defined in Appendix A. All columns include target-firm industry fixed effects (using Fama-French 48-industry classification) and year fixed effects. Robust t-statistics are reported in parentheses and calculated using standard errors clustered at the target-firm industry and year levels. **, *** indicate significance at the 5% and 1% level, respectively. The sample comprises 637 deals (base sample of 640 less three singletons). | ||
|---|---|---|
| (1) | (2) | |
| Dependent Variable | JustBelow | JustBelow |
| Earnouts | 0.062** | |
| (2.42) | ||
| EarnoutPerc | 0.001 | |
| (0.66) | ||
| DealValue | −0.071*** | −0.108*** |
| (−11.01) | (−6.53) | |
| Constant | 5.022*** | 7.295*** |
| (12.60) | (7.25) | |
| Observations | 637 | 79 |
| Adjusted R2 | 0.440 | 0.530 |
| Year fixed effects | Yes | Yes |
| Industry fixed effects | Yes | Yes |
Next, we examine the inclusion of financial contracting provisions by acquirers to lower deal prices below the pre-merger notification thresholds. In the context of our setting, for instance, the agreement to extend, and pay for, D&O coverage for private target firms can serve as another mechanism for acquirers to manipulate deal values to just below the threshold. Note that the cost to the acquirer of extending D&O coverage is not trivial, with combined premiums often exceeding $1 million, and is likely to be weighed against the total deal price (Goodwin Procter (2020)).31 To assess this possibility, we focus on private targets (which comprise the vast majority of firms involved in just-below-threshold deals), and hand-collect data on insurance payment terms for the deals in our sample.32 Table VI presents the results. In column (1), we find that extending D&O coverage for the former D&O of the target increases the likelihood of a deal being a stealth acquisition by 13.1 percentage points or 25% relative to the mean (p-value < 0.05).
| This table presents results from OLS regressions of M&As on financial contract terms. The dependent variable, JustBelowThreshold, is an indicator that assumes the value of 1 if a deal's transaction value is within a 10% window below the FTC annual pre-merger review threshold, and 0 otherwise. The main variable of interest in column (1), ExtendedLiabilityCoverage, is an indicator variable that assumes the value of 1 if the acquirer extends D&O coverage for the former directors and officers of the target, and 0 otherwise. The main variable of interest in column (2), DeductibleThreshold, is a continuous variable that measures the threshold (as a percentage of the total deal value) above which the target is responsible for post-acquisition claims against the acquirer. We also include controls for whether the representations and warranties survive beyond the effective date (RepsSurvive), the length of the survival period (SurvivalPeriod), and whether the holdback funds are held in escrow or otherwise (Escrow). All variables are defined in Appendix A. All columns include target-firm industry fixed effects (using Fama-French 48-industry classification) and year fixed effects. Robust t-statistics are reported in parentheses and calculated using standard errors clustered at the target-firm industry and year levels. **, *** indicate significance at the 5% and 1% levels, respectively. The sample comprises 122 deals in column (1) (base sample of 640 less 132 public targets less 366 deals with missing data to construct main independent variables less 12 deals with missing data to construct control variables less eight singletons). The sample comprises 99 deals in column (2) (base sample of 640 less 132 public targets less 379 deals for which terms do not survive beyond the closing date less 11 deals with missing data to construct main independent variable less nine deals with missing data to construct control variables less 10 singletons). | ||
|---|---|---|
| (1) | (2) | |
| Dependent Variable | JustBelow | JustBelow |
| ExtendedLiabilityCoverage | 0.131** | |
| (2.16) | ||
| DeductibleThreshold | 18.705** | |
| (2.19) | ||
| DealValue | −0.108*** | −0.095*** |
| (−19.99) | (−14.36) | |
| Constant | 7.125*** | 6.020*** |
| (19.16) | (11.56) | |
| Observations | 122 | 99 |
| Adjusted R2 | 0.603 | 0.609 |
| Controls | Yes | Yes |
| Year fixed effects | Yes | Yes |
| Industry fixed effects | Yes | Yes |
In column (2), we conduct another test that examines the level of the deductible that an acquirer is willing to accept before demanding post-acquisition breach-of-terms damages from the target. Deductible levels in a merger financial contract are analogous to deductibles in other settings (i.e., car or health insurance), in that a higher deductible should be associated with a lower deal premium. Thus, the existence of higher deductibles in just-below-threshold deals would be consistent with acquirers willing to accept higher post-closing risk in exchange for a lower deal price. Consistent with this view, we find that higher deductible thresholds are more likely for stealth acquisitions (p-value < 0.05). Taken together, the results from Table VI indicate that stealth acquisitions are more likely to feature financial contracting terms that implicitly compensate targets with greater legal protections that are typically associated with lower deal prices.
To the extent that firms employ financial contracting provisions to manipulate deal values to avoid antitrust review, we expect to find lower average deal premiums for targets just below versus just above threshold. However, an empirical challenge in assessing the deal values of private targets is that private firms do not have observable market values with which to calculate the premium paid by the acquirer firm. To overcome this limitation, we take advantage of SEC reporting rules that require publicly traded firms to report in their filings the amount paid for the target that is above the fair value of net assets (i.e., the goodwill portion of the deal). Because goodwill reflects the premium paid above the fair value of the target's net assets, it is analogous to the market premiums paid for public targets. We hand-collect from public SEC filings the reported goodwill amounts for all deals involving public acquirers and private targets around the threshold over our entire sample period and calculate the proportion of the deal value that is recognized as goodwill. Table VII presents the results. Column (1) indicates a negative relation between premiums paid for private targets and just-below-threshold deals (p-value < 0.10). This result suggests that an interquartile downward shift in deal premium increases the likelihood of a deal being below the threshold by 135%. In column (2), we find no difference between the deal premium paid for public targets in deals falling just above or just below the threshold.33 Taken together, this evidence is consistent with deal values, particularly for private targets, being manipulated to fall below the notification threshold.34
| This table presents results from OLS regressions of M&As on private-target deal premiums. The dependent variable, JustBelowThreshold, is an indicator that assumes the value of 1 if a deal's transaction value is within a 10% window below the FTC annual pre-merger review threshold, and 0 otherwise. The main variable of interest in column (1), PrivateTargetDealPrem, is a continuous variable that measures the premium paid for private targets. The main variable of interest in column (2), PublicTargetDealPrem, is a continuous variable that measures the premium acquirers pay for publicly traded target firms. All variables are defined in Appendix A. All columns include target-firm industry fixed effects (using Fama-French 48-industry classification) and year fixed effects. Robust t-statistics are reported in parentheses and calculated using standard errors clustered at the target-firm industry and year levels. *, **, *** indicate significance at the 10%, 5%, and 1% levels, respectively. The sample comprises 219 deals in column (1) (base sample of 640 less 132 public targets less 102 deals with nonpublic acquirers less 184 deals with missing data to construct main independent variable less three singletons). The sample comprises 84 deals in column (2) (base sample of 640 less 508 private targets less 31 deals with missing data to construct main independent variable less 17 singletons). | ||
|---|---|---|
| (1) | (2) | |
| Dependent Variable | JustBelow | JustBelow |
| PrivateTargetDealPrem | −0.199* | |
| (−1.96) | ||
| PublicTargetDealPrem | −0.000 | |
| (−0.25) | ||
| DealValue | −0.069*** | −0.060** |
| (−7.54) | (−2.80) | |
| Constant | 4.966*** | 4.030*** |
| (9.57) | (3.19) | |
| Observations | 219 | 84 |
| Adjusted R2 | 0.449 | 0.373 |
| Year fixed effects | Yes | Yes |
| Industry fixed effects | Yes | Yes |
Finally, we consider corporate governance concerns such as the use of continued economic ties with target managers (e.g., Morck, Shleifer, and Vishny (1988), Fich, Cai, and Tran (2011)) and more attainable earnout targets as implicit compensation for lower deal values. We manually collect data on post-merger employment between target CEOs and the acquiring firms in near-threshold deals (e.g., from executives’ LinkedIn pages, Bloomberg, and public proxy statement profiles). To the extent that acquirers exploit such economic incentives to reduce the purchase price to below the pre-merger notification threshold, we expect a greater representation of deals with target CEOs retained by or offered an economic interest in an acquiring firm for deals that are just-below the threshold. Such private benefits can also persuade target CEOs to accept deal terms that contain contingency payments, since earnout negotiations are typically shaped by target executives who know how to maximize the probability of meeting the earnout targets. Accordingly, we examine whether economically connected executives are more likely to achieve post-acquisition earnout payoffs. Table VIII presents the results. In Panel A, we find a positive relation between target CEOs that have post-merger economic ties with acquirers and just-below-threshold deals (p-value < 0.05). Panel B documents a positive and significant (p-value < 0.01) interaction effect between CEOs with post-merger economic ties in acquirers and earnout payoffs in just-below-threshold deals. Together, these results are consistent with the use of discretion to employ target executives and with greater earnout payoffs as a means to implicitly compensate such executives for lower deal premiums.
| This table presents results from OLS regressions of M&As on acquirer-target CEO economic ties. The dependent variable, JustBelowThreshold, is an indicator that assumes the value of 1 if a deal's transaction value is within a 10% window below the FTC annual pre-merger review threshold, and 0 otherwise. In Panel A, the main variable of interest, EconomicTie, is an indicator that takes the value of one if the target CEO is retained by the acquiring firm and/or has an economic interest in the surviving firm. We also control for whether the acquirer is public (PublicAcquirer) and for whether the merger is horizontal (Horizontal). In Panel B, column (1), the main variable of interest is EarnoutPayoff, and in column (2) the main variable of interest in the interaction term EconomicTie × EarnoutPayoff. All variables are defined in Appendix A. We include target-firm industry fixed effects (using Fama-French 48-industry classification) and year fixed effects. Robust t-statistics are reported in parentheses and calculated using standard errors clustered at the target-firm industry and year levels. **, *** indicate significance at the 5% and 1% levels, respectively. The sample comprises 423 deals in Panel A (base sample of 640 less 208 deals with missing data on economic ties less nine singletons). The sample comprises 39 (29) deals in column (1) ((2)) of Panel B (base sample of 640 less 551 deals without earnouts less 44 deals with missing data on earnout payoffs less six singletons). | |
|---|---|
| Panel A: Economic Ties and Below-Threshold M&As | |
| (1) | |
| Dependent Variable | JustBelow |
| EconomicTie | 0.084** |
| (2.15) | |
| DealValue | −0.078*** |
| (−8.67) | |
| Constant | 5.341*** |
| (9.66) | |
| Observations | 423 |
| Adjusted R2 | 0.466 |
| Controls | Yes |
| Year fixed effects | Yes |
| Industry fixed effects | Yes |
| Panel B: Economic Ties and Earnout Payoffs | ||
|---|---|---|
| (1) | (2) | |
| Dependent Variable | JustBelow | JustBelow |
| EarnoutPayoff | 0.059 | −0.386 |
| (0.49) | (−1.78) | |
| EconomicTie | −0.198 | |
| (−1.31) | ||
| EconomicTie × EarnoutPayoff | 0.590*** | |
| (9.04) | ||
| DealValue | −0.144*** | −0.151*** |
| (−10.12) | (−6.06) | |
| Constant | 9.190*** | 9.682*** |
| (12.11) | (6.84) | |
| Observations | 39 | 29 |
| Adjusted R2 | 0.753 | 0.505 |
| Year fixed effects | Yes | Yes |
| Industry fixed effects | Yes | Yes |
C. Heterogeneity in Stealth Acquisitions: Incentives to Coordinate
We next examine whether horizontal M&As (i.e., targets and acquirers operating in the same industry), deals between geographically proximate targets and acquirers, and deals in concentrated industries—all of which represent M&As that are theoretically more likely to lead to anticompetitive outcomes—have a higher likelihood of falling just below the threshold.
C.1. Research Design
| This table presents results from OLS regressions of M&As on acquirer-target industry and location characteristics. The sample is restricted to observations for which the deal value falls within a ±10% window centered around the FTC threshold. In Panels A and B, the dependent variable, JustBelowThreshold, is an indicator variable that assumes the value of 1 if a deal's transaction value is within the 10% window below the FTC annual pre-merger review threshold, and 0 otherwise. In Panel A, the main variables of interest in columns (1) and (2) are indicator variables that assume the value of one based on whether the target and acquirer share the same four-digit SIC code (i.e., horizontal merger) or share the same state of operations (i.e., intrastate). In column (3), the main variable of interest is the interaction term, Horizontal × Intrastate, which takes the value of 1 if the merger is both horizontal and intrastate, and 0 otherwise. All variables are defined in Appendix A. In Panel B, columns (1) and (4), the main variable of interest, HighConc, is an indicator that assumes the value of 1 if the target firm's industry is above the median concentration, and 0 otherwise. In columns (2) and (5) and (3) and (6), the main variables of interest are interaction terms Horizontal × HighConc and Intrastate × HighConc, which assume the value of 1 when the target firm's industry is above the median concentration and the acquirer and target share the same four-digit SIC code (in columns (2) and (5)), or share the same state of operations (in columns (3) and (6)), and 0 otherwise. In columns (1) to (3) industry concentration is estimated using the methodology in Hoberg and Phillips (2010b) (Conc_HP). In columns (4) to (6), industry concentration is estimated using net sales by four-digit SIC code, by year (Conc_Sales) (Hou and Robinson (2006)). All variables are defined in Appendix A. All columns in Panel A include target-firm industry fixed effects (using Fama-French 48-industry classifications) and year fixed effects, while all columns in Panel B include industry fixed effects. Robust t-statistics are reported in parentheses and calculated using standard errors clustered at the target-firm industry and year levels. *, **, *** indicate significance at the 10%, 5%, and 1% levels, respectively. The sample comprises of 637 deals in Panel A (base sample of 640 less three singletons). The sample comprises 501 in columns (4) to (6) in Panel B (base sample of 640 less 136 deals with missing data to construct HHI measure less three singletons). | |||
|---|---|---|---|
| Panel A: Horizontal and Intrastate M&As | |||
| (1) | (2) | (3) | |
| Dependent Variable | JustBelow | JustBelow | JustBelow |
| Horizontal | 0.066** | 0.028 | |
| (2.61) | (1.43) | ||
| Intrastate | −0.061 | −1.26* | |
| (−1.31) | (−1.92) | ||
| Horizontal × Intrastate | 0.194*** | ||
| (2.91) | |||
| DealValue | −0.072*** | −0.072*** | −0.072*** |
| (−10.81) | (−11.06) | (−11.45) | |
| Constant | 5.048*** | 5.064*** | 5.076*** |
| (12.35) | (12.66) | (13.17) | |
| Observations | 637 | 637 | 637 |
| Adjusted R2 | 0.442 | 0.440 | 0.447 |
| Year fixed effects | Yes | Yes | Yes |
| Industry fixed effects | Yes | Yes | Yes |
| Panel B. Highly Concentrated Industry M&As | ||||||
|---|---|---|---|---|---|---|
| (1) | (2) | (3) | (4) | (5) | (6) | |
| Dependent Variable | JustBelow | JustBelow | JustBelow | JustBelow | JustBelow | JustBelow |
| Measure of HighConc | Conc_HP | Conc_HP | Conc_HP | Conc_Sales | Conc_Sales | Conc_Sales |
| HighConc | −0.003 | −0.024 | −0.009 | 0.011 | −0.014 | 0.050 |
| (−0.12) | (−1.15) | (−0.36) | (0.28) | (−0.27) | (1.30) | |
| Horizontal | 0.005 | 0.013 | ||||
| (0.25) | (0.55) | |||||
| Horizontal x HighConc | 0.100** | 0.133** | ||||
| (2.24) | (2.27) | |||||
| Intrastate | −0.105* | 0.036 | ||||
| (−1.80) | (0.45) | |||||
| Intrastate x HighConc | 0.051 | −0.223 | ||||
| (0.60) | (−1.62) | |||||
| DealValue | −0.071*** | −0.072*** | −0.072*** | −0.074*** | −0.074*** | −0.075*** |
| (−11.11) | (−11.32) | (−11.47) | (−10.45) | (−10.64) | (−11.59) | |
| Constant | 5.035*** | 5.055*** | 5.069*** | 5.111*** | 5.110*** | 5.173*** |
| (12.53) | (12.76) | (13.01) | (11.86) | (12.18) | (12.96) | |
| Observations | 640 | 640 | 640 | 501 | 501 | 501 |
| Adjusted R2 | 0.444 | 0.447 | 0.446 | 0.460 | 0.464 | 0.467 |
| Year fixed effects | Yes | Yes | Yes | Yes | Yes | Yes |
| Industry fixed effects | No | No | No | No | No | No |
C.2. Results
Prior to estimating equation (3), we again employ McCrary's (2008) test to examine the discontinuity around the threshold after restricting attention to horizontal mergers. Figure IA.4 in the Internet Appendix shows this result. We find a noticeable jump in the number of horizontal deals just to the left of the threshold, which we verify with a Wald test (p-value < 0.01). It is important to note that while prior research suggests that changing the notification threshold level is associated with more horizontal mergers at all deal-size levels below the threshold (Wollmann (2019)), our findings in this section reveal a higher-than-expected number of such mergers in deals that are just below the threshold.
Next, we estimate equation (3) for the sample of deals that fall immediately below and above the pre-merger notification threshold. The results, reported in column (1) of Table IX, Panel A, confirm a greater likelihood horizontal mergers occurring just below the threshold (p-value < 0.05). Notably, we do not find that deals in which targets and acquirers share the same state of operations, which can allow acquirers to realize significant gains than from geographic proximity are more likely to fall just below threshold (column (2) of Panel A). However, when we expand the analysis to include interaction effects of these intrastate deals and horizontal mergers in column (3) of Panel A, we find a significant result for the interaction effect, indicating that our findings for horizontal mergers in column (1) are driven by intrastate horizontal mergers (p-value < 0.01).
To further explore factors that motivate the implementation of horizontal acquisitions in just-below-threshold deals, we also consider the role of industry concentration, given evidence on increased market power in concentrated industries (e.g., hospitals and dialysis centers) adversely affecting not only prices, but also quality of services (Gowrisankaran, Nevo, and Town (2015), Wollmann (2019), Eliason et al. (2020)). We do so by considering the interaction between horizontal mergers and two measures of concentrated industries, namely, the Hoberg and Phillips (2010b) measure and a concentration measure estimated using net sales by four-digit SIC code (Hou and Robinson (2006)).35 The results are reported in Panel B of Table IX. Although we do not find that deals involving concentrated industries are more likely to be just-below-threshold acquisitions (columns (1) and (4)), we do find evidence (p-value < 0.05) of horizontal mergers in concentrated industries having a higher likelihood of falling just below the threshold (columns (2) and (5)).36 Together, our findings in Table IX are consistent with more pervasive manipulation of deals to avoid pre-merger reviews in horizontal mergers, especially those that occur between firms in the same state and firms in concentrated industries.37
D. Quantifying the Value of Avoidance Techniques to the Target
Our results thus far suggest that acquirers and targets employ techniques to reduce deal values and thereby avoid pre-merger antitrust review. In this section, we quantify the value of such deal enhancement techniques from the perspective of target shareholders who must accept lower listed deal prices. Figure IA.3 in the Internet Appendix shows a large spike of deals occurring just below but within 2% of the threshold—indicating that the typical “stealth” acquisition is structured such that the deal value is approximately $1 million to $1.8 million below the threshold depending on the year of the deal.38 Figure IA.3 in the Internet Appendix also shows that the heights of the first two bins located just above the threshold (i.e., 2% to 4% above) are shorter than what would be expected under no manipulation, indicating that deals occurring just below plausibly originate from the two bins just above the threshold. In the analysis that follows, we examine whether our estimated values of these enhancement techniques are large enough—either on their own or jointly with each other—to shift a deal from one of the two bins located just above to the bin located just below the threshold, that is whether use of one or more of these techniques can facilitate a reduction of $1.5 million to $2.7 million from the headline deal price.39 In this analysis, we focus on D&O insurance, deductible thresholds, and private benefits to target CEOs, since these deal enhancement techniques can impact the negotiated deal price in quantifiable ways.40 However, we acknowledge that other techniques, such as the use of earnouts or the inclusion of cash as a less risky form of payment, may improve the probability of deal completion and thus be of value to the target. Our estimated values of these enhancement techniques are therefore likely to represent lower bounds on the actual extent to which deal values can be manipulated to fall below the threshold.
D.1. D&O Insurance
We collect information on the typical coverage for small firms, in addition to other standard features of D&O insurance policies, to estimate the value to the target of extending the D&O insurance, since coverage amounts are not publicly disclosed in our sample. For example, for the typical modest-size company, the annual D&O premium ranges from $50,000 to $60,000 per million in coverage, where post-merger premiums for target firms are generally two to four times that of regular D&O insurance premiums (Goodwin Procter (2020)). In terms of coverage, the typical small firm carries a policy with $5 million to $10 million in post-merger coverage (Goodwin Procter (2005)). Accordingly, the average policy can have an out-of-pocket cost of $1.24 million for the acquirer (with a range of $0.5 million to $2.4 million).41 Thus, in isolation, the average post-merger D&O policy likely has enough value to the target that it is more than the $1 million we estimate needed to shift a deal from just above to just below the pre-merger review threshold. Even at the low end of our estimate ($0.5 million), post-merger D&O insurance together with the other deal enhancement techniques could be sufficiently valuable to the target to warrant a deal price that shifts below the threshold.
D.2. Deductible Thresholds
Deductible thresholds in our sample of deals range from $0 to $2.5 million, with an average of $0.35 million or approximately 0.6% of total deal value. Thus, at the high end of this range, all else equal, an acquirer is willing to accept $2.5 million in post-acquisition legal costs for claims directed at the target before drawing from the portion of the deal payment held in escrow to defend against or settle lawsuits. From the perspective of the target, higher post-acquisition legal risk for the acquirer typically results in a reduction in the deal premium it receives.42 Such a trade-off can be valuable overall to the target if, for instance, the reduced deal premium it receives is less than the increase in the deductible threshold. To quantify this value, we calculate the elasticity of the deal premium with respect to the deductible threshold (i.e., the coefficient from an OLS regression of the natural log of the deal premium regressed on the natural log of the deductible threshold), which, in our sample of deals, is −0.6%. Using this elasticity, along with the 25th and 75th percentiles of the deductible threshold in our sample (i.e., $0.15 million and $0.5 million, respectively), we calculate the net value to the target from an interquartile shift upward in the deductible threshold. For instance, $0.35 million in additional deductible reduces the deal premium by an estimated $0.21 million, which amounts to a net increase in value to the target of approximately $0.14 million. In this case, the decrease in the deal premium of $0.21 million will be economically important to many acquirers as it represents between 14% to 8% of the $1.5 million to $2.7 million reduction in deal value required to facilitate avoidance of antitrust review.
D.3. CEO Private Benefits
We document that target CEOs receive post-acquisition employment contracts more often in deals just below the threshold. Although we cannot directly observe the economic value of the benefits conveyed to target CEOs from these employment contracts (since the monetary terms of employment contracts for private targets are not publicly disclosed), we use publicly available compensation data for CEOs of similar public firms to estimate what these post-acquisition contracts are potentially worth. For instance, in a sample of the largest public U.S. firms from 2006 to 2014, Guay, Kepler, and Tsui (2019) provide descriptive statistics for CEO compensation during our sample period. The smallest firm in their sample has market value of equity of $17 million and annual total CEO compensation of $0.2 million. The average acquisition price for a deal in our just-below-threshold sample is $61 million—about 3.5 times the size of the smallest firm in their study. Thus, we conservatively estimate that the value of continued employment with an acquirer is likely to be at least $0.3 million per year. Consistent with this finding, the CEO of one of our public targets acquired below the threshold in 2011 for $59 million received an average total compensation during the two years prior to acquisition of $0.338 million.43 Assuming continued employment of the target CEO for two to three years post-acquisition, this lower bound estimate of a target CEO's annual employment contract provides between $0.6 million and $0.9 million in value to a target CEO.
E. Magnitude of Results
In this section, we conduct several additional robustness tests to assess the sensitivity of our results to alternative research design choices, and we discuss the reliability of our findings thus far. Although the relatively small-sample tests that we examine yield statistically significant results, the economic significance of the findings may be subject to alternative explanations. For example, while we find a statistically significant difference in the use of earnouts in deals just below the threshold relative to just above, the importance of this finding is arguably more reliable after considering that earnouts appear in 58 of the 366 deals (or 16%) below the threshold as compared to (i) 31 of the 274 deals (or 11%) above the threshold and (ii) 32 of the 299 deals (or 11%) further below the threshold.44 Using these just-above and further-below bins as a proxy for our expectation under no manipulation of the proportion of earnouts in deals at this point in the distribution of deals, we expect 40 of the 366 just-below deals (or 11%) to include an earnout provision, rather than the 58 that we find. This 45% difference (i.e., 18/40 = 0.45) suggests that our finding is reliable and economically meaningful.
Our tests examining D&O insurance and deductible thresholds also result in statistically significant differences between firms just above and just below the threshold. For instance, focusing on the private targets for which we could obtain data, we find that 30 of the 78 targets (or 38.5%) just below the threshold have extended D&O insurance as compared to 17 of the 64 targets (or 27%) just above the threshold. Under the assumption of no manipulation, we expect to observe approximately nine fewer deals with extended D&O insurance just below the threshold (i.e., 78 × 0.27 = 21 instead of 30). Thus, under these assumptions, D&O insurance alone has a value to the target that could potentially shift a deal from above to below the threshold (see Section III.D.1). However, given that 142 of the deals for which we obtain data account for about 28% (i.e., 142 of 508) of all deals involving private targets around the threshold, if our data collection methods are not systematically biased then our finding likely underestimates the prevalence of this behavior in the just-below-threshold deals in practice.
F. Alternative Explanations and Robustness Tests
In this section, we discuss several potential alternative explanations for and robustness tests of our findings and inferences regarding strategic manipulation to avoid antitrust enforcement.
F.I. Delaying the Merger Announcement
Given that the pre-merger threshold is adjusted annually, and the effective date of the threshold occurs on approximately the same date every year, one possible explanation for the bunching we find is that acquirers and targets agree to delay announcement of the deal such that deals just above the threshold become just-below deals when announced in the following year if the pre-merger review threshold increases by enough. For instance, using the $50 million threshold in 2004 as an example, a deal that is $51 million in value, if announced at the end of 2004, would be above the threshold and therefore subject to the pre-merger review requirement, while the same merger announced after the threshold was adjusted to $53.1 million on March 2, 2005 would be exempt from pre-merger review.
We test whether merger announcement delays commonly occur in practice by identifying 55 deals in our near-threshold sample that (i) are announced within three months before or after the date that the new threshold becomes effective and (ii) have a deal value below the new threshold but above the immediately preceding threshold. We then measure the number of calendar days between the date the threshold was adjusted and the date the merger was announced to assess whether announcements of these deals are delayed to occur after the threshold adjustment. In Figure IA.5 in the Internet Appendix, we do not find evidence of systematic delay, as 29 of the 55 deals are announced within three months after the threshold-change date as compared to 26 announced within three months before the threshold-change date.
F.2. Already Exempt Mergers: Size of Person Test
We examine how other, nondeal size thresholds that trigger antitrust review may explain our bunching results. Although deals below the deal-size threshold are always exempt from pre-merger review, it is not always the case that deals above the deal-size threshold are subject to review. Specifically, for deals above the deal-size threshold but below a much higher “size-of-person-test” threshold (e.g., $200 million in 2001 and up to $359.9 million in 2019), the merger is subject to antitrust review only if both the acquirer and target have assets and sales above a specified level—for example, $100 million for the acquirer and $10 million for the target in 2001 (FTC (2008)). Although it is arguably difficult to manipulate sales or assets downward, as this would need to occur in the year prior to the merger announcement, such manipulation could also lead to lower deal values, and therefore contribute to the bunching we find below the deal-size threshold. To explore this possibility, we manually collect all annual reports, media articles, press releases, and industry publications to obtain the sales and or assets of firms involved in as many of our 640 near-threshold deals as possible; see Section II of the Internet Appendix for additional details on our collection procedure. This search results in data for 545 of the 640 deals (i.e., 85% of our near-threshold sample).45
Of the 545 deals, 68 would be considered exempt from pre-merger review based on the size-of-person test. We find that deals just below the threshold, compared to those just above in a simple difference-in-means test, are more likely to not be exempt from pre-merger review based on the size-of-person test (i.e., 92% versus 81.5%; p-value = 0.002). In regression analysis, we do not find a statistically significant difference in the propensity for already-exempt deals (based on the size-of-person test) to occur just below relative to just above the threshold (t-statistic = 1.29; p-value = 0.212). These results suggest that the bunching we find does not appear to be driven by firms manipulating their sales or assets downward to avoid the size-of-person threshold. Given that there are more deals above the threshold that would meet pre-merger review exemption based on the size-of-person test, if we were to remove these 68 already-exempt deals from our near-threshold sample, we would see a net increase of 18 in the difference between the number of deals occurring just below relative to just above the threshold, suggesting that our main results underestimate the prevalence of deal-size avoidance that occurs in practice.
F.3. Avoiding Second Requests
Although our analyses thus far are consistent with acquirers structuring their deals to avoid antitrust scrutiny, particularly when these deals are anticompetitive, the incentives to avoid a costly (and lengthy) pre-merger Second Request may also explain our results. To explore this possibility, we conduct interviews with legal practitioners and collect additional data on the estimated costs involved in a lengthy pre-merger review. We learn from the interviews that the probability of a Second Request—a request by the FTC or DOJ to provide additional documentation beyond that required for the initial pre-merger notification filing—is relatively low but highly predictive of the merger being blocked. We confirm this by analyzing all HSR Annual Reports created by the regulators during our 19-year sample period.46 We find that over this period, a total of 31,056 filings were submitted to regulators, of which 928 were subject to Second Requests (or approximately 3% of all filings). Of these Second Requests, 77% led to a challenge by either the FTC or DOJ. We further find that 10% of the Second Requests were for mergers with values between $50 and $100 million, that is mergers that are relatively close to the pre-merger notification threshold. Thus, even relatively small deals can be a concern to regulators, which suggests that deals involving smaller targets may also have incentives to avoid a Second Request review. Private correspondence with legal practitioners also indicates that the costs associated with a Second Request are estimated to be between $5 million to $10 million per request (regardless of deal size), and that Second Requests last six months on average.
In sum, acquirers seeking to avoid Second Requests plausibly do so because such investigations are both costly and likely to lead to a blocked merger. Thus, deals that are more likely to be scrutinized by the regulator, such as those involving horizontal rivals in highly concentrated industries and/or sharing the same geographic markets (i.e., mergers with deal values shifted below the threshold), have powerful incentives to avoid a pre-merger review. The fact that we find 55 more deals than expected just below the threshold and, during the same period, regulators issued Second Requests for 90 mergers in close proximity to the threshold suggests that the economic magnitude of our findings is realistic, with these deals likely representing deals that would have faced heightened scrutiny if they had not avoided review.47 Nonetheless, firms may also have incentives to avoid the costs of Second Requests to the extent that they believe that antitrust regulators imperfectly identify anticompetitive mergers and hence sometimes issue Second Requests for mergers that are not anticompetitive. In Section IV.C, we address this alternative explanation by analyzing post-merger product pricing for horizontal mergers above and below the pre-merger notification threshold to assess the effectiveness of regulatory review for deals around the threshold.
F.4. Robustness to Alternative Bin Sizes
Most of our analyses above use deals that fall within ±10% of the deal-size threshold each year. In robustness tests we use decreasing bin widths—for example, 9%, 8%, 7%, 6%, and 5%. Table IA.V in the Internet Appendix shows that our results remain stable across different bin widths. Coefficients are of the same sign and have similar magnitudes, although the results generally decrease in statistical significance as the sample size shrinks. For many of the deal enhancement-techniques we examine—including extended D&O insurance, deductible thresholds, and the retention of the target CEO—our main results persist regardless of bin width choices, consistent with our earlier analysis and inferences indicating which deal enhancement techniques provide sufficient economic value to the target to warrant accepting lower headline deal values.
F.5. Robustness to Already Exempt Mergers
Given our sample of always-exempt hotel and real estate deals is relatively small, and these deals lack the contractual features needed to conduct further analysis, in Section III.F.2 we employ a sample of 68 already-exempt deals based on the size-of-person test. In addition to having similar deal size and having contractual features similar to other deals around the threshold, these deals cover many different industries and thus we use this large sample of already-exempt deals to conduct additional placebo tests. Unlike deals whose values would trigger pre-merger review if they were above the threshold, these already-exempt deals are not expected to have incentives to manipulate deal value and thus, all else equal, we do not expect to find differences in the structure of these deals. Consistent with this prediction, in Figure IA.6 in the Internet Appendix we find no evidence of bunching below the threshold for already-exempt mergers. Furthermore, results from falsification tests in Table IA.VI in the Internet Appendix indicate that nearly all of our tests (i.e., 21 of 23) yield no statistically significant differences between just-above and just-below deals when they are already exempt from pre-merger review based on the size-of-person test.
F.6. Robustness to Alternative Fixed Effects
Our main research design controls for unobservable industry and time heterogeneity by including separate industry and year fixed effects. In this section, we take an alternative approach and use the interaction of industry and year fixed effects, that is, industry × year fixed effects, which control for unobservable factors within an industry in a given year that could be associated with our outcome variables.48 Table IA.VII in the Internet Appendix presents the results. We find that the coefficient estimates based on industry × year fixed effects are similar to those in the main specifications that include separate industry and year effects. In general, for tests employing our larger samples (e.g., Table IV), our main results hold. In tests employing our relatively smaller samples (i.e., Tables V to X), we typically find similar estimates, albeit with weaker statistical significance or marginal insignificance.49
| This table presents results from OLS regressions of announcement returns and gross margins on M&As. In columns (1) and (2), the dependent variable, RivalRet, is a continuous variable that represents the equal-weighted (three-day) market-adjusted portfolio returns of horizontal rivals of acquirers. In columns (3) and (4), the dependent variable, ∆ GrossMargin, is a continuous variable that equals the change in the industry-average gross margin measured as the difference between the industry-average gross margin before the merger and the industry-average gross margin after the merger, where gross margin equals sales minus cost of goods sold all scaled by sales. The main variable of interest in columns (1) and (3), JustBelowThreshold, is an indicator variable that assumes the value of 1 if a deal's transaction value is within a 10% window below the FTC annual pre-merger review threshold, and 0 otherwise. In columns (2) and (4), we present results for the association between announcement returns (in column (2)) and gross margins (in column (4)) and an interaction term, Horizontal × JustBelowThreshold, which assumes the value of 1 if the deal is below the threshold and the acquirer and target share the same four-digit SIC code, and 0 otherwise. All regressions also include as controls DealValue, PublicAcquirer, PublicTarget, and LowNumRivals. All variables are defined in Appendix A. All columns include acquirer industry fixed effects (using Fama-French 48-industry classification) and year fixed effects. Robust t-statistics are reported in parentheses and calculated using standard errors clustered at the acquirer industry and year levels. *, **, *** indicate significance at the 10%, 5%, and 1% levels, respectively. The sample comprises 543 deals in columns (1) and (2) (base sample of 640 less 94 deals with missing data to construct variables less three singletons). The sample comprises 359 deals in columns (3) and 4) (base sample of 640 less 276 deals with missing data to construct variables less five singletons). | ||||
|---|---|---|---|---|
| (1) | (2) | (3) | (4) | |
| Dependent Variable | RivalRet | RivalRet | ∆ GrossMargin | ∆ GrossMargin |
| JustBelowThreshold | 0.005 | 0.002 | −0.002 | −0.005 |
| (1.05) | (0.49) | (−0.39) | (−1.05) | |
| Horizontal | −0.006* | −0.009*** | ||
| (−1.79) | (−3.18) | |||
| Horizontal × JustBelowThreshold | 0.009* | 0.011** | ||
| (1.78) | (2.82) | |||
| Constant | −0.064*** | −0.066*** | 0.039 | 0.037 |
| (−2.92) | (−2.91) | (0.77) | (0.74) | |
| Observations | 543 | 543 | 359 | 359 |
| Adjusted R2 | 0.115 | 0.115 | 0.066 | 0.066 |
| Controls | Yes | Yes | Yes | Yes |
| Year fixed effects | Yes | Yes | Yes | Yes |
| Industry fixed effects | Yes | Yes | Yes | Yes |
IV. Product Market Competition following Stealth Acquisitions
In this section, we examine whether stealth acquisitions are associated with patterns consistent with reduced product market competition. In particular, we first examine whether successful antitrust avoidance provides economic benefits for acquirers and their horizontal rivals. We then examine multiple falsification tests based on acquisitions just above the pre-merger notification threshold and further below the pre-merger notification threshold.
A. Effects on Product Market Competition: Industry Rival Returns
We next examine whether successful pre-merger notification avoidance has product market consequences in horizontal mergers. It is well-known that mergers of industry competitors can reduce competition among industry rivals and facilitate monopolistic prices at the expense of consumers (e.g., Stigler (1964)). Following Eckbo (1983), Stillman (1983), Chevalier (1995a), and Fathollahi, Harford, and Klasa (2021), we formally test for this is by examining the abnormal returns of industry rivals around the announcement date of horizontal mergers. The intuition is that if these mergers are more anticompetitive in nature, monopoly rents should accrue to merging firms. Rents should also accrue to industry rivals, since these firms can free ride on higher product prices. Assuming markets are efficient, stock prices—including those of horizontal rivals—should reflect these rents soon after the merger is announced because the combined effect of expected future cash flows should be impounded into prices relatively quickly.
A.I. Research Design
Although our estimate of equation (4) resembles that of a standard regression discontinuity design (RDD), the empirical approach in our study differs in notable ways and is more akin to a “bunching” design (see Kleven (2016) for a review). Unlike the standard RDD approach, which, for the researcher to draw causal inferences about a treatment or policy, relies on the strong assumption that firms cannot endogenously determine whether they are above or below a specified threshold, we examine whether firms manipulate deal values to avoid antitrust scrutiny in mergers and then look at product market effects. In our setting, if firms can manipulate deal values, then it could be the case that those firms that choose to be just below the threshold are somewhat different from those that choose to be just above, which would invalidate the standard RDD approach (Lee and Lemieux (2010)). Thus, evidence of discontinuous product market effects around the threshold can shed new light on the impact of systematic regulatory avoidance in the M&A market, which is what the RDD techniques are designed to describe (Garmaise (2015)) but interpretation of our results differs from that of a standard RDD.
A.2. Results
Prior to estimating equation (4), we consider the relation between just-below-threshold deals and the abnormal returns of industry rivals across all deals. Although this analysis does not yield significant results (column (1) of Table X), our findings from the estimation of equation (4) in column (2) of Table X indicate that just-below-threshold deals generate 12.5% higher abnormal returns for rivals in horizontal mergers falling just below the threshold relative to horizontal mergers just above (p-value < 0.05). These results suggest that investors recognize that industry rivals benefit more from below-threshold horizontal mergers.
One alternative explanation for our results on rival returns is that “winners” of acquisition auctions overbid for targets, leading to increases in the stock prices of “losers”—some of which may be rivals—who avoid overpaying. If so, we would expect our return results to be driven by those deals with the highest deal premiums (i.e., for which acquirers overpaid by the greatest amount). We formally test this conjecture by including the additional interaction term, HighDealPremi,t, which equals 1 if the deal premium is in the highest quartile, and 0 otherwise.50 Table IA.VIII in the Internet Appendix shows that high deal premiums are not associated with higher rival announcement returns in deals just below the threshold. Moreover, the coefficient on Horizontali,t × JustBelowThresholdi,t × HighDealPremi,t is negative and statistically significant, which is inconsistent with the aforementioned alternative explanation of our results. The coefficient on Horizontali,t × JustBelowThresholdi,t, however, remains positive and of similar magnitude as in column (2) of Table X. Overall, the results in Table X and Table IA.VIII in the Internet Appendix are consistent with equity market investors recognizing that horizontal mergers that avoid antitrust scrutiny also benefit industry rivals.
A.3. Robustness to Alternative Measure of “Horizontal” Mergers
Our main measure of a horizontal merger uses four-digit SIC codes, as this classification mirrors what antitrust regulators have historically used to define “horizontal.” A more conceptually advanced method of defining horizontal competitors, such as the text-based approach developed by Hoberg and Phillips (2016), requires firms to be public in order to develop measures of horizontal competitors from public filings. Given that much of our sample comprises private acquirers and targets, we develop a new approach to measuring horizontal mergers that captures similar degree of granularity as the Hoberg and Phillips approach.51 Specifically, we measure the proportion of acquirer-target product-market overlap using all four-digit SIC codes that the target and acquirer operate in and, using the overlap of these codes (i.e., the number of shared four-digit SIC codes), we measure the proportion of product-market overlap between the two firms scaled by the total number of industries the target operates in (i.e., the number of four-digit SIC code matches divided by the total number of SIC codes for the target).52 To validate this measure, for the 36 deals in our sample that involve both public acquirers and public targets, we find a positive and statistically significant correlation (coefficient of 0.18) between our new measure of product-market overlap and the Hoberg and Phillips measure. Our novel measure therefore captures a significant amount of the variation that the Hoberg and Phillips measure is designed to capture.53
Next, we use our measure to reestimate the results from column (1) of Table IX, Panel A. We find that the estimates increase in economic magnitude and statistical significance relative to our results using only the primary SIC code. We also reestimate our tests of rival-returns results from Table IX. Column (1) of Table IA.IX in the Internet Appendix shows that our magnitudes increase when using our novel measure of horizontal competitors. Taken together, these results indicate that our results in Tables IX and X are not driven by how we define horizontal mergers.
B. Effects on Product Market Competition: Gross Margins
We also reestimate equation (4) to test for a discontinuity in the change in industry-level gross margins around the threshold (e.g., Fathollahi, Harford, and Klasa (2021)), which can be further indicative of economic benefits to acquirers and their industry rivals resulting from reduced product market competition following stealth acquisitions, and can also help validate the economic mechanism of our return results in Section IV.A.2. In column (4) of Table X, the evidence is consistent with firms and their industry rivals benefitting from stealth acquisitions: industry-average gross margins increase by 1.1 percentage points in the year after as compared to the year before just-below-threshold (relative to just-above-threshold) horizontal deals. In column (2) of Table IA.VII in the Internet Appendix, we check robustness to our alternative measure of horizontal mergers and find a similar result, albeit slightly smaller in magnitude.
C. Effects on Product Market Competition: Product Prices
In our final set of tests, we provide direct evidence on how horizontal stealth acquisitions can impact product market competition by considering how such acquisitions impact product prices of industry rivals that share common products. Product price increases by rivals following events that reduce product market competition can be indicative of such effects (e.g., Chevalier (1995b), Azar, Schmalz, and Tecu (2018)). Evaluating changes in product prices after deal completion requires data on detailed micro-level product pricing data for shared common products of industry rivals over time. Although such data are scarce, we are able to study three horizontal mergers in the consumer products industry—one in the beauty products sector located just below the pre-merger notification threshold, one in the infant products sector located just above the threshold, and one in the food products sector located further below the threshold—for which we can (i) identify common products of the acquirer's rivals via exhaustive analysis of product groupings in online advertising and in retail stores, and (ii) obtain retail scanner pricing data for the rivals’ products using Universal Product Codes (UPCs) provided by Nielsen Consumer.54 These criteria yield a sample that consists of approximately 1.9 million observations of rival retail scanner observations related to common products that were sold during a two-year period around the closing of the three mergers. To the extent that stealth acquisitions reduce product market competition, we expect an increase in the prices of the rivals’ common products following the merger located just below the threshold (i.e., the “stealth acquisition”), relative to the prices of the rivals’ common products following the two other mergers.55 This prediction of price changes in the immediate 12 months following the completion of deals is in line with prior studies documenting consumer price effects shortly after acquisitions that reduce competition in the consumer products industry (e.g., Chevalier (1995b)).56
C.I. Research Design
C.2. Results
Figure 7 illustrates that, for each of the three mergers, the normalized monthly average prices for acquirers’ and rivals’ common products are stable during the months leading up to the acquisition date, indicating no evidence of pre-trends. However, in contrast to the pre-acquisition period, the same figure shows that normalized prices increase sharply following the completion of the “stealth” acquisition only.58 Although prices in the pre-acquisition period vary across all three mergers before the announcement date, such prices tend to stay within a band ranging from zero to 0.5 standard deviations away from a mean of zero. In contrast, product prices for the stealth acquisition just below the threshold during the post-acquisition period are higher by one to two standard deviations relative to product prices in the two other mergers.

We test for the statistical significance of these differences by estimating equation (5) using five specifications with various fixed effect structures to control for time trends in product prices and local economic shocks (i.e., using week and geographic region fixed effects).59 Table XI presents the results. Across all specifications, we find evidence of a positive and statistically significant coefficient on the interaction between JustBelowThresholdi,t and Postt, indicating a roughly 1.2-standard-deviation increase in the prices of rivals’ common products in the first year following the completion of the stealth acquisition, relative to price changes for common products of acquirers and rivals in the two other mergers. Overall, while these findings are based on only three mergers, the evidence suggests that (i) unlike stealth acquisitions occurring just below the threshold, mergers occurring just above and further below the threshold have no detectable pricing consequences for consumers, and (ii) the regulatory review process in this case appears to be effective in that it allows mergers above the threshold that do not harm competition to go forward. This latter finding also supports our argument that firms seek to avoid regulatory scrutiny because it is likely that their proposed mergers would be blocked by an effective regulator.
| This table presents results from difference-in-differences OLS regressions of normalized average weekly product prices on three mergers: one just below the threshold, one just above the threshold, and one further below the threshold. The dependent variable, NormalizedPrice, is a continuous variable that represents the normalized average weekly prices for common products of the acquirer and its rivals. The main variable of interest, JustBelowThreshold × Post, is an interaction term that takes the value of 1 if the observation belongs to the merger occurring just below the threshold and the week falls after the effective date of the merger, and 0 otherwise. All variables are defined in Appendix A. We vary the inclusion of week and geographic fixed effects across columns such that column (5) represents our fully specified model. For our week fixed effect, we count weeks relative to the effective date of the merger, since the three mergers occur in different years. Robust t-statistics are reported in parentheses and calculated using standard errors clustered at the product and week levels. *, **, *** indicate significance at the 10%, 5%, and 1% levels, respectively. | |||||
|---|---|---|---|---|---|
| (1) | (2) | (3) | (4) | (5) | |
| Dependent Variable | Normalized Price | Normalized Price | Normalized Price | Normalized Price | Normalized Price |
| JustBelowThreshold | −0.000 | 0.002 | −0.043 | 0.168 | 0.181 |
| (0.00) | (0.03) | (−0.54) | (0.36) | (0.39) | |
| Post | 0.087 | −0.200*** | −0.207*** | ||
| (1.29) | (−2.79) | (−2.85) | |||
| JustBelowThreshold × Post | 1.30* | 1.28* | 1.27** | 1.23** | 1.22** |
| (1.93) | (1.98) | (2.00) | (2.21) | (2.30) | |
| TimeTrend | 0.001*** | 0.001*** | 0.064 | 0.088 | |
| (3.58) | (3.49) | (0.41) | (0.57) | ||
| Constant | −0.000 | 0.149* | 0.162* | 0.812 | 1.114 |
| (0.00) | (1.71) | (1.93) | (0.44) | (0.62) | |
| Observations | 1,915,291 | 1,915,291 | 1,915,291 | 1,915,291 | 1,915,291 |
| Adjusted R2 | 0.004 | 0.010 | 0.137 | 0.044 | 0.173 |
| Week fixed effects | No | No | No | Yes | Yes |
| Geographic fixed effects | No | No | Yes | No | Yes |
C.3. Robustness to Different Product Markets
Panels A to C of Table IA.X in the Internet Appendix present results from estimating equation (6) using five specifications with various fixed effects to control for time trends in product prices and local economic shocks (i.e., using week and geographic region fixed effects). In Panel A, for the stealth acquisition, we find evidence across all specifications of a positive and statistically significant coefficient (p-value < 0.01 in all columns) on the interaction between CommonProducti,t and Postt, indicating a 5.5% increase in the prices of the rivals’ common products in the first year following the completion of the stealth acquisition, relative to changes in the prices of their uncommon products. If similar price increases occur—for a similar number of annual units sold—across the 55 more-than-expected mergers occurring just below the threshold in our sample period, and assuming that this increase benefits an acquirer (i) in a duopoly (i.e., with one additional competitor in the product market) or (ii) with four additional competitors (i.e., in a product market of five rivals, which antitrust regulators tend to consider a threshold for “highly concentrated”), then our calculation conservatively estimates that such stealth acquisitions cost consumers between $182 million and $454 million in terms of increased prices for consumers during the first 10 years following these deals.60 By contrast, for the competitive acquisitions (in Panels B and C), we do not find an increase in prices in the months after the merger: the coefficient on the interaction term, CommonProducti,t and Postt, is insignificant in all columns of Panel B and insignificant in column (5) (our main specification) of Panel C. Together, these results provide further evidence of the potentially economically meaningful pricing consequences for consumers in markets impacted by stealth acquisitions.61
V. Conclusion
We show that a greater-than-expected number of M&A deals are structured to narrowly avoid antitrust scrutiny (i.e., filing of pre-merger notifications with the DOJ and FTC), and that these “stealth acquisitions” are driven by acquisitions of private targets that entail financial contracting terms with lower deal premiums and payoff functions that allow for more discretion in assigning deal values. We explore the economic mechanisms driving this bunching of acquisitions below the pre-merger notification threshold and find that the discontinuity in stealth acquisitions around the pre-merger notification threshold is driven by firms with the greatest incentives to coordinate, which is indicative of stealth acquisitions occurring in settings more likely to have anticompetitive effects. We further find that both acquiring firms and their industry rivals benefit from stealth acquisitions, consistent with reduced product market competition that limits output and raises prices.
Our findings have important policy implications. Current antitrust review guidelines include bright-line thresholds that trigger pre-merger review. Firms can manage financial contracting features of their M&A deals, however, to avoid antitrust scrutiny from regulators. Such regulatory avoidance can have deleterious effects on consumers. Our results suggest a more nuanced view of government resource allocation in monitoring the antitrust implications of corporate M&A deals: setting arbitrary thresholds can have real effects on industrial organization behavior to the extent that firms have discretion to manipulate the criteria used to identify corporate transactions that warrant regulatory scrutiny. In particular, our study provides evidence supporting regulatory concern about the limitations set by pre-merger review thresholds, as firms appear to systemically manipulate the size of their deals to circumvent regulatory review. Moreover, our results suggest that firm discretion in the antitrust review process facilitates avoidance of regulatory scrutiny of the effects of corporate deals on product market competition. We view these and related topics as promising avenues for future research into the role of corporate financing strategies in anticompetitive behavior.
Editors: Stefan Nagel, Philip Bond, Amit Seru, and Wei Xiong
Appendix A: Variable Definitions
This appendix provides definitions for the key variables used in our tests.
| Variable | Description | Source |
|---|---|---|
| Dependent variables | ||
| JustBelowThreshold | Indicator variable equal to 1 if a merger's deal value is within ≥−10% and ≤0% of the threshold, calculated as [(deal value − threshold)/deal value], and 0 otherwise. | SDC |
| RivalRet | Equal-weighted portfolio return of horizontal rivals (at the four-digit SIC level), measured over the three-day window [−1, 1] centered on the announcement date. | CRSP |
| ∆ GrossMargin | Continuous variable equal to the change in the industry-average gross margin, measured as the difference between the industry-average gross margin one year after the merger and the industry-average gross margin one year before the merger, where gross margin is calculated as (sales − cost of goods sold)/sales. Industry is determined at the four-digit SIC code level. | Compustat |
| NormalizedPrice | Average weekly normalized product price, by UPC code. | NielsenIQ |
| Price | Average weekly product price, by UPC code. | NielsenIQ |
| Explanatory variables | ||
| PublicAcquirer | Indicator variable equal to 1 if the acquirer is a publicly traded company, and 0 otherwise. | SDC |
| PrivateAcquirer | Indicator variable equal to 1 if the acquirer is a private company, and 0 otherwise. | SDC |
| PublicTarget | Indicator variable equal to 1 if the target firm is a publicly traded company, and 0 otherwise. | SDC |
| PrivateTarget | Indicator variable equal to 1 if the target firm is a private company, and 0 otherwise. | SDC |
| Public-Public | Indicator variable equal to 1 if both the acquirer and the target firm are publicly traded companies, and 0 otherwise. | SDC |
| Public-Private | Indicator variable equal to 1 if the acquirer is a publicly traded company and the target firm is a private company, and 0 otherwise. | SDC |
| Private-Public | Indicator variable t equal to 1 if the acquirer is a private company and the target firm is a publicly traded company, and 0 otherwise. | SDC |
| Private-Private | Indicator variable t equal to 1 if both the acquirer and the target firm are private companies, and 0 otherwise. | SDC |
| AllCash | Indicator variable t equal to 1 if the payment terms include 100% cash, and 0 otherwise. | SDC |
| AllStock | Indicator variable equal to 1 if the payment terms include 100% stock, and 0 otherwise. | SDC |
| AllCashandOther | Indicator variable t equal to 1 if the payment terms include 100% cash and other nonstock and noncash consideration (e.g., debt, earnouts, etc.), and 0 otherwise. | SDC |
| AllStockandOther | Indicator variable equal to 1 if the payment terms include 100% stock and other noncash and nonstock consideration (e.g., debt, earnouts, etc.), and 0 otherwise. | SDC |
| Horizontal | Indicator variable equal to 1 if the acquirer and target share the same four-digit SIC code, and 0 otherwise. | SDC |
| Horizontal(continuous) | Continuous variable equal to the proportion of overlap (i.e., from zero to one) of the target's and acquirer's four-digit SIC codes for the product markets they operate in. Overlap is calculated as the number of overlapping SIC codes divided by the total number of target SIC codes. | SDC |
| Intrastate | Indicator variable equal to 1 if the headquarters of the acquirer and target are in the same state, and 0 otherwise. | SDC |
| HighConc | Indicator variable equal to 1 if the industry is above the median concentration, and 0 otherwise. We calculate industry concentration using (i) Hoberg and Phillips (2010b) and (ii) net sales (by four-digit SIC code) to compute Conc_HP and Conc_Sales, respectively. | Hoberg and Phillips website. |
| Earnouts | Indicator variable equal to 1 if earnouts are included in the payment terms, and 0 otherwise. | SDC |
| EarnoutPerc | % of deal value that consists of earnouts. | SDC |
| AcqTermFeePercent | Continuous variable that measures the acquirer's termination fee as a proportion of the total deal value. | SDC |
| PrivateTargetDealPrem | Premium paid for a private target. Measured as the proportion of goodwill relative to total deal value. Calculated using the amount of goodwill recognized in the first available 10-K SEC filing for publicly traded acquirers. |
SEC EDGAR |
| EconomicTie | Indicator variable equal to 1 if the target CEO is retained by and/or holds equity in the acquiring firm, and 0 otherwise. | Various online sources |
| PublicTargetDealPremium | Premium paid for a publicly traded target firm. Measured as the deal price divided by the target firm's stock price (four weeks prior to the announcement date) minus one multiplied by 100. | SDC |
| EarnoutPayoff | Indicator variable equal to 1 if an earnout is achieved (and paid out), and 0 otherwise. | SEC EDGAR |
| ExtendedLiabilityCoverage | Indicator variable equal to 1 if the acquiring firm agrees to extend and pay for D&O liability insurance for directors and officers of the target firm, and 0 otherwise. | SEC EDGAR |
| DeductibleThreshold | Continuous variable that measures the dollar-based threshold above which the acquirer can claw back a portion of the purchase price to defend and pay damages associated with post-closing breaches of representations and warranties made by the target. | SEC EDGAR |
| CommonProduct × Post | Indicator variable equal to 1 if an acquirer's rival's product overlaps with a product of the target and retail purchase occurs after the effective date of the merger, and 0 otherwise. | NielsenIQ |
| Control variables | ||
| DealValue | Value of the merger in US$ millions. | SDC |
| TargetTermFee | Indicator variable equal to 1 if the deal includes a termination fee payable by the target firm, and 0 otherwise. | SDC |
| TenderOffer | Indicator variable equal to 1 if the deal is structured as a tender offer, and 0 otherwise. | SDC |
| NumRivals | Number of horizontal rivals of the acquirer. Calculated using the number of publicly traded companies that share the same four-digit SIC code as the acquirer. | CRSP |
| LowNumRivals | Indicator variable equal to 1 if the number of public rivals is below the median for all industries, and 0 otherwise. We use the number of publicly traded companies that share the same four-digit SIC code as the acquirer to calculate the number of rivals. | CRSP |
| TargetTermFeePercent | Continuous variable that measures the target termination fee as a proportion of the total deal value. | SDC |
| RepsSurvive | Indicator variable equal to 1 if the representations and warranties made by the target and contained in the merger agreement survive beyond the effective date of the deal, and 0 otherwise. Data are hand-collected from merger agreements located on EDGAR. | SEC EDGAR |
| SurvivalPeriod | Continuous variable that measures the amount of time the representations and warranties made by the target in the merger agreement have been extended. Data are hand-collected from merger agreements located on EDGAR. | SEC EDGAR |
| Escrow | Indicator variable equal to 1 if the purchase price holdback is kept in third-party escrow, and 0 otherwise. | SEC EDGAR |
| TimeTrend | Continuous variable that measures, for each observation, the number of days after the effective date of the deal. Observations prior to the effective date assume a negative value. | NielsenIQ |
Appendix B: Measuring Deal Values
-
For publicly traded targets, the FTC requires the use of acquisition price (AP) or market price (MP), whichever is greater. Since AP includes MP + deal premium, it will be greater than MP and therefore AP will be the price used in the pre-merger filing.
-
For private targets, if the AP can be “determined” then the FTC requires the use of AP. If AP cannot be determined (e.g., includes post-acquisition contingency payments, such as an earnout, that cannot be determined at announcement date) then the FTC requires the use of fair market value (FMV). Since the FTC requires that FMV includes intangibles (such as goodwill), the AP and FMV should be the same. We can confirm this: for public acquirers, we can observe details on the acquisition contained in the 10-K, including the allocation of the AP across the asset and liability classes, and the assignment of a portion of the AP to intangibles and goodwill. An example of this allocation (shown below) is the acquisition of PureWellness (private firm) by Cerner Corp (public firm) for $69.1 million on February 25, 2013; note that the deal included an earnout.
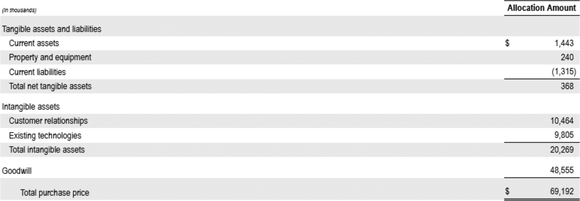
To further align the SDC deal values that we use with those submitted in the pre-merger filings, we take the additional step of adjusting the deal value to include the value of the acquirer's “toehold” in the target. Specifically, to determine whether the deal value is above or below the threshold, the pre-merger notification rules require that the parties include the market value of the portion of the target that the acquirer may already hold prior to the transaction (i.e., the value of the toehold). As such, we follow the same process prescribed by the antitrust regulators and calculate the total value of the target held by the acquirer on the announcement date (e.g., by using the announcement-date deal value as an indication of the market value of X% of the target and then applying this to the percentage of the target already held by the acquirer). We then add the toehold value to the announcement-date deal value to obtain the total value to be held by the acquirer.
REFERENCES
- 1 As of 2020, at least 41 countries, including all 10 of the world's largest economies, have some threshold in place for the purpose of pre-merger notification (Thomson Reuters Practical Law (2020)).
- 2 In our full sample from 2001 to 2019, we find that almost two-thirds of M&A deals, which collectively represent $240 billion in aggregate deal value, fall below the applicable filing threshold.
- 3 In 2014, DOJ Deputy Attorney General Overton noted that potential harm to consumers cannot be measured by the size of the transaction or merging parties (DOJ (2014)). She elaborated on how nonreportable transactions could give rise to antitrust concerns, including harm to consumers in regional markets, adversely affecting the market for a key input to a downstream product, and reducing competition in a narrow product market that still creates issues.
- 4 Our lower bound estimate of 28% deals more than expected just below the threshold assumes an “intended effect” of the regulation, that is, the increase in deal activity just below the threshold regulators would expect to see. Our upper bound estimate of 45% assumes no expected discontinuity around the threshold and compares actual mergers to expected.
- 5 A Second Request allows the FTC or DOJ to extend its merger review and ask the parties to submit additional information to accommodate a closer look at how the merger will impact competition. We discuss our procedure for collecting Second Request data in Section III.F.3.
- 6 The 30-day period is expected to allow regulatory agencies to request additional information, extend the waiting period by another 30 days, and determine whether it will file a challenge based on antitrust regulations to block a deal. Notwithstanding a request for additional information by the regulators, the parties must wait 30 days after filing (15 days in the case of a cash tender offer) or until the agencies grant early termination of the waiting period before they can close the transaction.
- 7 Size-of-transaction refers to the value of the assets, voting securities, and noncorporate interests that are being acquired. Since September 30, 2004, the size-of-transaction filing threshold has been adjusted each year based on the change in gross national product and applies to deals valued at $94 million or more effective as of January 21, 2020. For transactions above the size threshold and below a higher threshold (e.g., $200 million in 2001), pre-merger antitrust review might be avoided if the sales or assets of the target or acquirer are less than a specified amount (e.g., $10 million for the target and $100 million for the acquirer in 2001), which is referred to as the size-of-person test. We examine the impact of the size-of-person test on our results in Section III.F.5.
- 8 Fines for failing to file a transaction that meets the requirements for pre-merger notification are $41,484 per day as of January 23, 2018, which is typically enforced.
- 9 For example, Facebook made more than 80 acquisitions during this time, of which dozens involved small deals that were not reportable under the HSR Act. See www.arstechnica.com/tech-policy/2020/02/feds-launch-a-probe-into-big-techs-smallest-acquisitions.
- 10 Related work by Eliason et al. (2018) and Einav, Finkelstein, and Mahoney (2018) exploit variation in thresholds that determine hospital reimbursements in the setting of long-term care hospitals to identify strategic behavior on the part of hospitals as to when they discharge patients.
- 11 The Internet Appendix is available in the online version of this article on The Journal of Finance website.
- 12 For example, in 2017 the FTC challenged the acquisition of Synacthen Depot by Mallinckrodt subsidiary Questcor Pharmaceuticals, Inc., which was not subject to the pre-merger notification requirement. The allegations were settled by Mallinckrodt agreeing to disgorge $100 million in obtained profits as well as divesting part of the acquired assets.
- 13 For example, a deal of size $85 million ($95 million) in 2018 (2019) when the pre-merger notification threshold was $84.4 million ($90 million) would be assigned a DistanceFromThresholdi,t value of $85 – $84.4 = $0.6 million ($95 – $90 = $5 million).
- 14 We find similar results, which we present in Figure IA.1 in the Internet Appendix, when we conduct a McCrary test using percent from threshold distance as our measure.
- 15 In Figure IA.2 of the Internet Appendix, we construct four additional histograms with alternative bin widths, namely 2 million, $1.5 million, $1 million, and $0.5 million (the last of which approximates the optimal bin width set by the McCrary test of $0.55 million), and continue to find a sharp increase in the number of deals in the bin to the immediate left of the threshold.
- 16 Our inferences from this method are unaffected when we draw our comparisons based on bin widths of $5 million around the pre-merger review threshold.
- 17 We also construct a histogram using the percent distance from the threshold as our measure and set bin widths to 2%. The results presented in Figure IA.3 of the Internet Appendix document a similar discontinuity around the threshold, confirming our main analysis.
- 18 We also consider the possibility that regulators expected an increase in below-threshold deals, that is an “intended effect” of the regulation. To estimate this value, we use the average growth rate in bin heights for the six bins immediately to the left of our focal bin and then use this rate to estimate the height for the just-below-threshold bin. Our calculation indicates an expected bin height of 138 deals, which is still roughly 40 deals less than what we find occurring in practice.
- 19 Our placebo thresholds begin at ±1% and end at ±25% to ensure that these tests are conducted on thresholds that are sufficiently far away from the actual threshold each year.
- 20 We limit our analysis to 50 placebo thresholds following prior literature conducting similar analysis of placebo thresholds (e.g., Goncharov, Ioannidou, and Schmalz (2021)).
- 21 For ease of interpretation and comparison, Figure 4 displays the absolute value of the t-statistic.
- 22 The highest-ranking t-statistic is the placebo threshold at 1% above the actual threshold; it has a t-statistic of 5.11 compared to 5.02 for the actual threshold, suggesting that the closer we get to the actual threshold, the more likely the discontinuities we find represent the actual threshold rather than a placebo threshold.
- 23 The number of hotel and real estate deals immediately around the threshold (e.g., within ±10%) is relatively small—we have eight such deals within that bin width (and 41 within ±$25 million of the threshold), and thus we urge caution in drawing inferences from this analysis alone. However, in additional analysis presented in Section IV.F.2., we collect data on 68 deals within ±10% of the thresholds that are already exempt from pre-merger review based on an alternative threshold rule and find similar evidence of no discontinuity around the threshold.
- 24 We estimate equation (2) using linear probability models.
- 25 This finding is unlikely to be explained by below-threshold deals naturally involving smaller targets that are likely to be private firms. This is because the majority of acquisitions coded zero for our dependent variable are deals that are smaller than the just-below-threshold deals. Hence, the completion of deals involving public acquirers and private targets is systematically higher in just-below-threshold acquisitions compared to the entire population of deals, including many smaller deals. In Table IA.I of the Internet Appendix, we confirm this using a sample of deals that fall further below the threshold (i.e., further-below) and compare this group of deals to all other deals to show no systematic difference across types of firms involved. We also repeat this analysis using only the further-below and just-above deals and again find no systematic differences.
- 26 In Table IA.II the Internet Appendix, we show that our main results in Table IV hold when we use a smaller bin width (i.e., within 5% of the threshold).
- 27 The t-statistic (–12.16) in column (6) of Table IV is noticeably larger than the other t-statistics in this table due to our choice of industry classification (Fama-French 48) for clustering standard errors. We find that the t-statistic in column (6) is weakly sensitive to alternative industry classifications: using two-digit SIC, four-digit SIC, and Fama-French 12 classifications yields t-statistics that range from –6.56 to –10.97. Results from all of our tests are qualitatively similar in analyses using these alternative industry classifications, with the Fama-French 48 classification consistently providing the most conservative t-statistics.
- 28 In the United States, when a target shareholder receives registered securities as payment for the sale of the company, Rule 144 requires the shareholder to hold the stock for a minimum of six months (if the buyer is a Securities and Exchange Commission (SEC) reporting company) or a minimum of one year (if the buyer is not a SEC reporting company), and may be required to comply with “volume limitations” when selling.
- 29 Correspondence between legal representatives of acquirers and antitrust regulators, which are publicly disclosed on the FTC website, reveals that acquirers actively consider the impact of contingency payments on deal price. Such correspondence frequently requests confirmation from the FTC on acquirers’ ability to unilaterally choose discount rates and probabilities of payoff, for example, when estimating the fair market value of earnouts, and on whether acquirers’ valuation methods would exempt a deal from pre-merger review.
- 30 In subsequent tests we focus on this subsample of 640 near-threshold mergers. Variation in sample sizes is attributed to tests that (i) use only private targets; or (ii) use only public acquirers; or (iii) data limitations due to a lack of disclosure.
- 31 In Section III.D.1, we provide estimates of the value to the target of D&O insurance.
- 32 We provide details on our data collection procedure in Section I of the Internet Appendix. Although targets provide D&O coverage during the course of the acquisition, such coverage ceases after the transaction closes. However, because target-firm executives and directors can still be held liable for their firm's pre-acquisition activities after the deal closes, targets and acquirers typically negotiate run-off policies that extend this insurance coverage well beyond the effective date of the deal. Private discussions with M&A lawyers indicate that extended D&O premiums are economically meaningful to the acquirer and can be used as leverage to negotiate a lower upfront deal price. Similarly, escrow arrangements that facilitate post-closing clawbacks of the deal price should the target be sued for events that occurred prior to the merger are subject to a deductible threshold. Higher thresholds are more desirable to targets but allocate higher risk to acquirers (i.e., inability to recover losses below the deductible threshold). In exchange for accepting a high deductible threshold, M&A lawyers suggest that acquirers can negotiate a lower upfront deal price.
- 33 Our findings also help rule out the possibility that the unusually high level of merger activity just below the threshold is being driven by acquisitions involving better targets that are already below the threshold. Such targets would likely command higher deal premiums. We find the opposite for deals just below the threshold, which is further consistent with a detectable mass of stealth acquisitions involving manipulated deal values.
- 34 We also examine, in a smaller sample of deals, market reactions to the acquirer's stock price in deals involving private targets. We find that horizontal deals with positive cumulative abnormal returns (using the three-day cumulative abnormal return centered on the announcement date) are more likely to be just below the threshold (although the result is marginally insignificant).
- 35 The Hoberg and Phillips (2010b) measure aims to capture industry concentration for both public and private firms, and thus is a suitable measure for our setting, given we focus on both public and private firms. To construct their measure, the authors use publicly available Department of Commerce Herfindahl-Hirschman Index (HHI) calculated for a smaller group of industries to estimate coefficients for a set of predictors of HHI. The authors then use the regression coefficients to compute fitted HHIs for all industries. We obtain these fitted values from the authors’ data library located on their website.
- 36 Our use of the Hoberg and Phillips (2010b) measure of industry concentration likely does not perfectly capture concentrations for the specific products markets that are impacted by the merger. As highlighted in Shapiro (2018), it is difficult to measure market concentration across many industries, and thus the concentration measures we employ may not accurately reflect the actual concentrations computed by regulators.
- 37 We also examine the level of HHI for horizontal mergers in near-threshold deals. Antitrust regulators consider an HHI of 1,800 or more to be indicative of a highly concentrated industry. We find that horizontal deals just below the threshold have a mean (median) industry HHI of 2,111.5 (1,624.6), whereas deals just above the threshold have a mean (median) industry HHI of 1,673.5 (1,317.4). Due to data limitations (e.g., we do not have sales data for private firms), we cannot calculate the change in HHI due to mergers. For example, antitrust regulators state that an increase in HHI of 50 or more (in a highly concentrated market) potentially raises significant competitive concerns.
- 38 This $1 million to $1.8 million range comes from taking the threshold in 2001 (i.e., $50 million) to the threshold in 2019 (e.g., $90 million) and multiplying each by 2%.
- 39 We estimate this range by assuming that, in any given year, the average stealth acquisition shifts from the midpoint between 0% and 4% above threshold to the midpoint between 0% and 2% below the threshold. In 2001 (2019), this would be equivalent to reducing deal value by $1.5 million ($2.7 million).
- 40 Our focus on these deal enhancement techniques in particular is further supported by our finding in Section III.F.4 that use of these techniques persists across different bin width assumptions (e.g., 10% to 5%).
- 41 We calculate this amount by multiplying the midpoint values of the D&O premium ($55,000), the ratio of the post-merger premium to regular D&O insurance premium (3), and the post-merger coverage value in millions (7.5), that is $55,000 × 3 × 7.5 = $1,237,500.
- 42 Consistent with this intuition, in Table IA.III in the Internet Appendix, we find a negative correlation between deductible thresholds and deal premiums in our sample of near-threshold deals.
- 43 See www.sec.gov/Archives/edgar/data/742550/000110465910010132/a09-36350_1def14a.htm.
- 44 The Thomson Securities Data Company (SDC) Mergers and Acquisitions database includes data, that is, binary indicator variable, on whether the deal includes an earnout provision, allowing us to conduct the just-above and further-below comparison. For our manually collected data (e.g., the inclusion of extended D&O insurance), we limit our analysis to only near-threshold deals (i.e., those within ±10% of the deal-size threshold).
- 45 Overall, our search yielded data for 545 of the 640 deals in our sample (or 313/366 = 85.5% of our below-threshold sample and 232/274 = 84.7% of our above-threshold sample) for which that we could identify whether a deal would be exempt from pre-merger review on the basis of the size-of-person test.
- 46 We collect all “Annual Reports to Congress Pursuant to the Hart-Scott-Rodino Antitrust Improvements Act of 1976” from the FTC Annual Competition Reports page located here: https://www.ftc.gov/policy/reports/policy-reports/annual-competition-reports. Annual Reports include data on the total number of pre-merger filings during the year, number of Second Requests (including the number of Second Requests within a range of deal values, for example, in 2001 there were 70 Second Requests, eight of which were for deals with a value in the range of $50 to $100 million), and the number of challenges from the FTC and DOJ. We use these data to calculate, for example, the probability of a Second Request for deals within $50 million of the deal-size threshold; and to calculate the probability of an FTC or DOJ challenge, conditional on a Second Request.
- 47 We also examine the use of acquirer (or “reverse”) termination fees in deals around the threshold. Such fees are paid by acquirers to targets in the event that a deal is terminated, including if a deal fails to receive regulatory approval, and are intended to compensate the target for business disruption during the pre-merger review process. However, if targets are able to transfer regulatory risk to acquirers in the form of higher termination fees, then targets are less likely to have incentives to avoid compliance costs. Consistent with targets transferring risk in deals that are just above the threshold, we find that acquirer termination fees are roughly $0.7 million higher ($3.1 million vs. $2.4 million) in deals just above relative to just below the threshold, suggesting that acquirers are willing to compensate targets for regulatory risk. In addition, in Table IA.IV of the Internet Appendix, we find that deals with higher acquirer termination fees are less likely to be just below the threshold.
- 48 These tests rely on the presence of within-industry-year variation, which we sometimes lack, particularly in tests using small samples. Moreover, it could be the case that, even if two mergers (in the same industry-year) are manipulating the deal price—for example, by extending D&O insurance—if both mergers are below the threshold and no other mergers in that industry-year are announced, the effect would be subsumed by the industry × year fixed effects that we include in the model.
- 49 More specifically, of the 19 results that are statistically significant in our main tests, nine remain significant after the inclusion of industry × year fixed effects, of which eight are significant at the 5% level or better. In one test, we do not have enough observations to estimate a model; in three other tests the results are marginally insignificant (e.g., p-value = 0.14).
- 50 Data limitations on deal premiums reduce our return sample by nearly 50%, similar to deal premium tests in Table VII.
- 51 We cannot apply the Hoberg and Phillips (2016) text-based methodology in our setting, since it uses the 10-K disclosures of public firms, which we do not have for private firms.
- 52 To verify that that this new measure is not perfectly capturing the current binary measure, we find that the correlation between the two measures is approximately 0.64. We also find that, in the deals that were previously classified as horizontal based on our binary measure, the average product market overlap is roughly 0.83. Interestingly, for deals that were previously categorized as 0 (i.e., not horizontal), we find an average product overlap of about 0.24.
- 53 By comparison, our original four-digit SIC measure and the Hoberg and Phillips (2016) measure have a positive correlation of 0.09.
- 54 Agreements with Nielsen Consumer LLC preclude us from disclosing the names of the firms or the specific products.
- 55 In the just-below-threshold merger, we are not able to investigate changes in the pricing of the acquirer's focal products because of a lack of product pricing data for the private target's products during the pre-merger period.
- 56 For example, Chevalier (1995b) shows that supermarket prices begin increasing in the first quarter following a leveraged buyout.
- 57 We follow Sheen (2014) and define a product as “common” based on interviews with marketing experts and discussions in firms’ public SEC filings, which we discuss further in Section II of the Internet Appendix.
- 58 This documented increase in product prices helps mitigate the concern that our earlier finding of a positive stock price reaction for rivals following such deals is due to a general improvement in product quality, since it is unlikely that all rivals would improve their product quality within a few months of the stealth acquisition being completed.
- 59 We define geographic fixed effects using Nielsen's Designated Market Area (DMA) codes, which represent standardized regions for local television marketing. In addition, because our mergers occur in different years, our week fixed effects are standardized, that is, the week is given relative to the effective date of the merger, to control for seasonality.
- 60 We first assume that our below-threshold merger analyzed in this section is representative of the typical anticompetitive merger in our just-below-threshold sample of 366 deals. We next calculate the cost to consumers, in dollars, of the post-merger price increase for this single merger by multiplying the 205,000 units sold in the first year after the merger by the 5.5% price increase, resulting in a $128,330 increased cost to consumers in the first year. Since rivals also tend to benefit from the price increase, we next extrapolate this effect across the industry. To do so, we use the FTC and DOJ's benchmark for highly concentrated industries, namely an HHI of 1,800 or above. Specifically, if we assume that five firms have equal market share in an industry, then the implied HHI would be 2,000, which is just above the regulators’ threshold level of concern. In our sample of just-below-threshold deals, we find that approximately one-quarter of the deals have five industry rivals or less. We therefore use as a lower bound a two-firm industry (i.e., a duopoly) and as an upper-bound a five-firm industry for our estimates of affected rivals. In other words, if the price increase we observe in our single merger was extrapolated across two to five rivals, then the cost to consumers in that industry would be estimated to be between $256,000 and $641,000 in the first year. If we further interpolate these amounts across the 55 more-than-expected deals bunching just below the threshold, this yields an increased cost to consumers for the first year following the merger of $14.1 million to $35.3 million. If we assume that prices grow at a similar rate (i.e., 5.5% annually), this results in turn in an increase in total cost to consumers of $182 million to $454 million over the first 10 years after these 55 mergers.
- 61 In Table IA.X in the Internet Appendix we repeat the tests for column (5) in Panels A, B, and C using normalized prices. Our results remain statistically significant.