Examination of osteoarthritis and subchondral bone alterations within the stifle joint of an ovariectomised ovine model
Abstract
The exact relationship between osteoporosis and osteoarthritis is still a matter for debate for many. The ovariectomised ewe is frequently used as a model for osteoporosis, resulting in significant alterations in bone morphometry and turnover in both trabecular and subchondral bone after 1 year. This study examines whether ovariectomy has any impact on development of osteoarthritis within the ovine stifle joint at the same time point. In addition, we investigate whether there are any significant correlations present between articular cartilage degeneration and alterations in microstructural parameters or turnover rates in the underlying bone. Twenty-two sheep were examined in this study; 10 of the sheep underwent ovariectomy and 12 were kept as controls. Five distinctive fluorochrome dyes were administered intravenously at 12-week intervals to both groups, to label sites of bone turnover. All animals were then sacrificed 12 months postoperatively. Although most specimens showed some evidence of osteoarthritis, no measurable difference between the two study groups was detected. Osteoarthritis was associated with a thinning of the subchondral plate, specifically the subchondral cortical bone; however, whereas previous studies have suggested a link between trabecular thinning and osteoarthritis, this was not confirmed. No correlation was found between osteoarthritis and bone turnover rates of either the subchondral trabecular bone or bone plate. In conclusion, despite the fact that ovariectomy results in marked morphological and structural changes in the ovine stifle joint at 1-year postoperatively, no evidence was found to suggest that it plays a direct role in the aetiology of osteoarthritis.
Introduction
Osteoarthritis is one of the most prevalent diseases known, particularly in older population groups. The WHO estimate that 190 million people suffer from this condition; some groups have estimated that the majority of adults over the age of 55 have radiographic evidence of osteoarthritis (D'Ambrosia, 2005). The disease has an enormous economic impact, due to both a reduced work-force because of disability and the need to provide specialist support and assistance to those most affected. The sums involved are considerable when it is taken into account that 80% of those with osteoarthritis will have some restriction of movement and almost a quarter cannot perform the activities of daily living (Buckwalter et al. 2004). The number of total (and revision) joint replacements for osteoarthritis is increasing rapidly; over 250 000 total knee replacements were performed in the USA alone in the year 1999, over 400 000 were performed in 2003, and projections suggest that these numbers will continue to increase (Kurtz et al. 2005, 2007).
Osteoarthritis may occur in any synovial joint, but most commonly develops in the knee, hip, spine and hand (Buckwalter et al. 2004). Traditionally it has always been described as ‘wear and tear’ arthritis, assumed to develop as a direct result of some initial biological or mechanical disruption of the joint cartilage(Kawcak et al. 2001). Destruction of the joint tissues then progresses until end stage arthritis is reached, with the classical characteristics of cartilaginous damage or denudation, subchondral bone erosion and development of osteophytic lesions (Creamer & Hochberg, 1997).
There is now considerable debate, however, as to whether the changes in the underlying subchondral bone may actually precede the damage seen within the articular cartilage (Radin & Rose, 1986; Li & Aspden, 1997; Kawcak et al. 2001; Burr, 2004; Lajeunesse, 2004). Most studies examining osteoarthritis have been performed in mid- or late-stage disease; the natural history of the degenerative process in its early stages is still not well understood. Certainly, once osteoarthritis is established, whatever the initiating cause, there is consensus that subchondral alterations do occur, which will then have a considerable effect on the stresses within the overlying cartilage (Bobinac et al. 2003; Burr, 2004). Another hypothesis, that osteoarthritis is a systemic musculoskeletal disorder with a metabolic component, is also being actively investigated; dysfunction of mesodermal-derived cells, such as myocytes, lipocytes and osteoclasts, may be central to the disease process (Aspden, 2008).
Animal models of osteoarthritis are well established in the scientific literature (Thorndike & Turner, 1998; Little & Smith, 2008). The ovine stifle joint is frequently employed in these studies as it may be considered to be a 1 : 3 scale model of the human knee joint (Osterhoff et al. 2011). Osteoarthritis is typically induced by means of an experimental injury; monoarticular studies may do this by causing an injury to an articular structure in order to destabilise the joint, or by placing the joint under abnormal mechanical loading (Pritzker, 1994; Hwa et al. 2001; Parker et al. 2003; Little & Smith, 2008). There are a number of methods by which an injury may be induced, and it has been suggested that the subchondral changes observed at 12 weeks are quite different depending on the exact type of insult used (Kuroki et al. 2011). Within the ovine model, meniscectomy has proven to be most reliable (Little et al. 1997; Hwa et al. 2001; Parker et al. 2003).
Ovariectomised (OVX) sheep are useful models for a variety of metabolic bone disorders, including bone mineral density loss, osteoporosis and alterations in trabecular bone architecture associated with oestrogen deficiency (Turner et al. 1995; Thorndike & Turner, 1998; Johnson et al. 2002; Newton et al. 2004; Brennan et al. 2009; Kennedy et al. 2009; Holland et al. 2011). The use of ovariectomy alone as a model for osteoarthritis is a recent addition to the literature, with some studies showing that it has a detrimental effect on the structural, material and biomechanical properties of ovine articular cartilage (Turner et al. 1997; Cake et al. 2005). This model is interesting but has still not been fully validated (Sniekers et al. 2008); it is likely that the local effects of osteoarthritis induced by ovariectomy and those induced by alteration of the mechanical loading of the joint (i.e. by meniscectomy) may be quite dissimilar (Pajamaki et al. 2008). In addition, osteoarthritis and osteoporosis have traditionally been viewed as being mutually exclusive (Dequeker, 1997; Stewart & Black, 2000). While some studies show that increased subchondral bone mineral density is associated with reduced joint space narrowing and osteoarthritis progression (Bruyere et al. 2003), other research suggests that periarticular osteoporosis commonly occurs with osteoarthritis (Karvonen et al. 1998; Patel et al. 2003). It has long been hypothesised that alterations observed in the subchondral bone, thinning of the plate and underlying trabeculae will change the pattern of mechanical loading on the overlying cartilage (Radin & Rose, 1986). Alterations within the subchondral bone are certainly evident in mid- and late-stage osteoarthritis (Creamer & Hochberg, 1997); whether these changes occur simultaneously with, precede or even perhaps initiate the deterioration of the articular cartilage seen in osteoarthritis is still undetermined.
The ovariectomised ewe is also a useful model for elevated bone turnover and this is increased in established osteoarthritis, as measured by scintigraphy, but few studies have performed direct evaluation of the remodelling rate by histological examination (Benske et al. 1988; Sharif et al. 1995; Hayami et al. 2004). Measurement of bone resorption markers suggests that these are elevated early in the disease process (Kwan Tat et al. 2010). In addition, whereas endochondral ossification at the interface between bone and cartilage is usually present at a physiological rate, this process is described as being accelerated in osteoarthritis, with tidemark advancement (Oegema et al. 1997; Burr, 2004).
In this paper, we examine whether ovariectomy has any impact on development of osteoarthritis within the ovine stifle joint 1 year postoperatively. In addition, we investigate whether there are any significant correlations present between articular cartilage degeneration and alterations in microstructural parameters or turnover rates in the underlying bone.
Materials and methods
Animals and study design
Twenty-two skeletally mature ewes were included in this study; approval was obtained from the ethics committee in the School of Veterinary Science in University College Dublin and an animal license, number B100/2443, was granted by the Department of Health under the Cruelty to Animals Act, 1876. The precise age of the animals was not known but the range was between 5 and 9 years. Animals were randomly allocated to ovariectomised or control groups; ovariectomy was performed on 10 of the sheep (OVX) and the remainder (n = 12) were kept as controls (CON). Five distinctive fluorochrome dyes were administered intravenously as described previously (Holland et al. 2013). One dye was initially given at surgery; the remainder were administered at 12-week intervals to coincide with the ovine bone remodelling cycle (Lee et al. 2002). Doses were individually calculated according to body mass (Kennedy et al. 2009). The sheep were kept at pasture for 12 months and then sacrificed. Bones were immediately harvested and stored at −20 °C.
Measurement of bone mineral density (BMD)
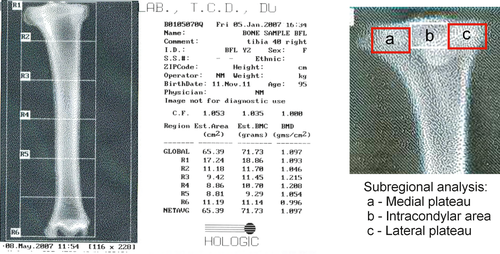
Initial dual energy X-ray absorptiometry (DEXA) scanning of the bones for quantification of BMD was performed in the tibiae; this examination is the gold standard for detection of osteoporosis in the clinical setting. A fan beam bone densitometer (Hologic QDR-4500TH Elite, Hologic, MA) was used to measure BMD. The estimated area (EA, cm2) and bone mineral content (BMC) for each of the two tests was recorded. Bone mineral density (g cm−2) was determined from these by dividing the BMC by the EA. Three DEXA readings were examined in this study: initially, the BMD of the whole bone was considered; secondly, the proximal tibia was examined (R1 in Fig. 1); lastly, subregional analysis was performed of the medal and lateral plateaux (A & C in Fig. 1).
Preparation of osteochondral specimens
Removal of the plateau from the intact ovine tibia was initially performed using a diamond saw (Struers, Minitom, Ballerup, Denmark). The intact tibia was placed in the specimen holder of the Diamond Saw, and the proximal 1.5–2 cm of the tibia removed (Holland et al. 2011). A digital photograph was obtained of each plateau upon removal from the remainder of the tibia. Further cuts were then made with the diamond saw to obtain two adjacent osteochondral specimens from the medial aspect of the plateau, from the area of maximal femoro-tibial contact and pressure (Fukubayashi & Kurosawa, 1980). The anterior osteochondral specimen (A) was used for MicroCT and to examine bone turnover and measured 7 × 5 mm (approximately 15 mm deep); the adjacent posterior specimen (B) measured 1.5 × 5 mm (approximately 2 mm deep) and was used for histological grading of osteoarthritis.
Quantification of subchondral microarchitecture
Three-dimensional analyses were performed of the anterior osteochondral specimens (A) using MicroCT to examine the microarchitecture of the subchondral trabeculae and subchondral plate as previously described (μCT40; Scanco Medical, Basserdorf, Switzerland) (Holland et al. 2011). For analysis of the subchondral trabecular bone, a volume of interest (VOI) was defined within the sample. A 3-dimensional image was then reconstructed using the Scanco software, with automated analysis of standard morphological parameters, including bone volume fraction (BV/TV), trabecular number, trabecular thickness, trabecular separation, connectivity density and hydroxyapatite concentration (Parfitt et al. 1987).
Measurement of bone turnover
Following MicroCT, specimens (A) were cleaned with a water jet and dehydrated in 70% ethanol for 5 days. Further dehydration was performed under vacuum over a period of 12 h in graded ethanol. Specimens were next infiltrated in methyl methacrylate solution (MMA), prior to final embedding in polymerised methyl methacrylate (PMMA) (O'Brien et al. 2000). Slides were prepared for microscopy as follows: histological sections with a thickness of approximately 120–150 μm were taken from PMMA-embedded osteochondral specimen using a diamond saw (Struers). Sections were reduced to approximately 100 μm by grinding in aqueous solution, rinsed in distilled water, briefly dipped in xylene and finally mounted on glass slides (using glass coverslips) with DPX.
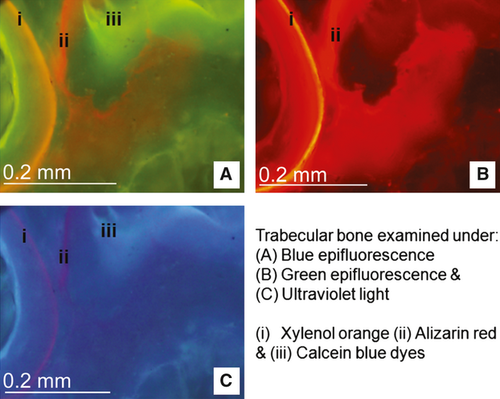
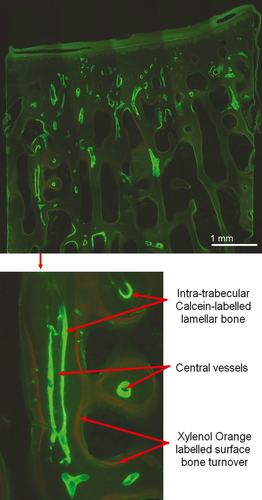
Each slide was examined using bright field microscopy (Nikon Eclipse 90i). Initial basic measurements were performed using a digital image analysis system (NIS Elements BR 3.0, Nikon). Within the trabecular bone, an area of interest measuring 4 × 7.5 mm was analysed from each specimen, lying at a depth of 2.5 mm from the calcified surface (Holland et al. 2013). The total area and area of bone was calculated for each area of interest. Each slide was then examined using a combination of ultraviolet (UV) (λ = 365 nm), blue (λ = 470 nm) and green (λ = 546 nm) epifluorescence microscopy at ×10 magnification (Fig. 2). Bone turnover was assessed by measuring both the number and length of sites with fluorochrome-labelled bone along the trabecular surfaces per measured bone area, and the number of sites of intra-trabecular labelled lamellar bone (Fig. 3) (Holland et al. 2013). These histomorphometric parameters are derived from the American Society for Bone and Mineral Research (ASBMR) nomenclature (Parfitt et al. 1987; Schorlemmer et al. 2005). The bone turnover within the subchondral bone plate was quantified by calculating the numerical density of labelled secondary osteons per unit width of the subchondral specimen (no. per mm), and per unit area (no. per mm2).
Staging and grading of osteoarthritis
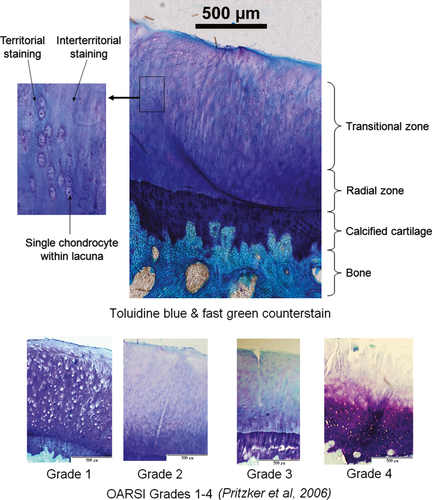
The macroscopic stage of osteoarthritis present was assessed immediately following removal of the plateau from the tibia. A digital photograph was obtained of each plateau to allow subsequent image analysis and calculation of the surface area affected by osteoarthritis, as required by the Osteoarthritis Research Society International (OARSI) scoring system (Pritzker et al. 2006). The more posterior osteochondral specimens (B) were obtained as described above, fixed in neutral buffered formalin for 24 h and then decalcified in 10% formic acid for 7 days. During decalcification, specimens were suspended in solution in a cotton mesh bag and gently agitated throughout, with the solution changed every 24 h. These specimens next underwent standard tissue processing in a Leica ASP 300 and were then paraffin-embedded in standard blocks. Blocks were then placed on a rotary Leica microtome (Leica RM2255, Leica Microsystems, Germany); serial sections were cut at 10 μm, floated in a water bath and then mounted on Polysine adhesion glass slides (Fisher). To allow quantification of the grade of osteoarthritis present, slides were then stained with toluidine blue/fast green (Getzy et al. 1982; Little et al. 1997). Slides were initially placed in an oven at 55 °C for 30 min, then a xylene bath for 10 min, followed by graded ethanol baths and rinsed in distilled de-ionized water. They were subsequently placed in 0.04% Toluidine Blue/0.1 m sodium acetate buffer pH 4.0 for 10 min, rinsed in distilled de-ionized water and counterstained in 0.1% aqueous fast green solution for 2 min. Slides were then rinsed in distilled de-ionized water, dehydrated in 100% ethanol, cleared in xylene, air-dried at room temperature and finally mounted with DPX.
Two histological methods were utilized for the quantification of the degree of osteoarthritis present in the articular cartilage (Fig. 4). The first of these is a modification of the histological/histochemical grading system first described by Mankin et al. (1971) and Little et al. (1997). The second method employed was introduced more recently by the Osteoarthritis Research Society International (OARSI), as it was felt that Mankin's system had a number of disadvantages: it was originally described for specimens with advanced osteoarthritis and so is not ideal for the description of early or mild osteoarthritis; it merely gives a grade but no indication of stage or extent of disease on the articular surface. Additionally, inter- and intra-observer variability have been described with Mankin's system (Pritzker et al. 2006; Custers et al. 2007).
Statistical analysis
PASW Statistics 18 (IBM® SPSS®) was used for data analysis. Q-Q plots were performed of all datasets to check for normal distribution. A t-test was performed if the appropriate criteria were met; otherwise a Mann–Whitney U-test was performed. Differences were considered significant for values of P < 0.05.
Results
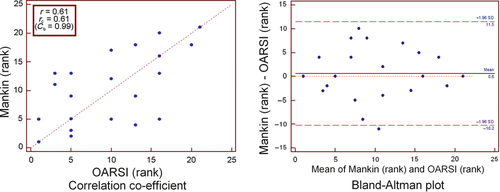
As stated, osteoarthritic changes were quantified using two methods; Mankin's histopathological scoring system and the OARSI score. As these two measures use two different scales it was more appropriate to look at how each measure ranked the changes rather than using the raw scales. As would be expected, there was evidence of a positive correlation between the ranks of these two scoring systems which was highly significant (r = 0.61, P = 0.003; Fig. 5). In this case the value for rc was 0.61, which was approximately the same value for the correlation coefficient (the correction factor Cb was 0.99), indicating no bias towards either scale. This difference is better visualised using a Bland–Altman plot (Fig. 5). The Bland–Altman plot shows a slight mean rank difference of 0.6 in favour of measurements by the Mankin scale and the 95% limits of agreement of −10.2 to 11.5 rank positions. Although the observed bias is quite low, the limits observed are extremely wide. Again, this probably reflects the fact that Mankin's score is based solely on the maximal grade of osteoarthritis observed at a single point, whereas the OARSI also accounts for what proportion of the articular surface is involved.
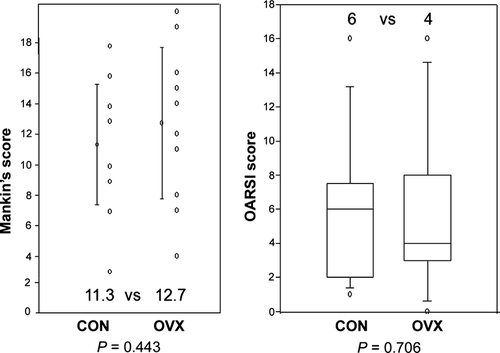
Most specimens showed some evidence of osteoarthritis. However, there was no difference in the degree of osteoarthritis observed between the OVX and Control groups using either scoring method (Fig. 6); Mankin's score (12.7 vs. 11.3, P = 0.443, t-test; 95% confidence interval for difference of means: −5.189 to 2.349), OARSI score (4 vs. 6, P = 0.706).
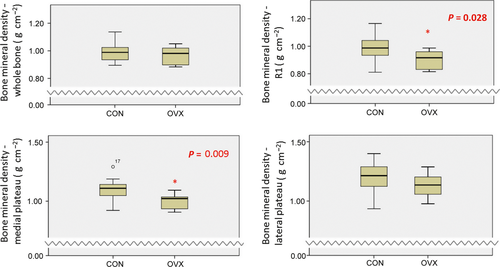
DEXA confirmed that ovariectomy induced a reduction in bone mineral density at 1 year postoperatively; interestingly, this was only present in subregional analysis of the medial tibial plateau, rather than of the whole bone (Fig. 7).
Next, correlations were performed between the histological osteoarthritis scores and bone mineral density; increasing osteoarthritis score was not associated with any detectable alteration in bone mineral density, including subregional analyses (Table 1).
| n = 22 | Bone mineral density (g cm−2) | ||||
|---|---|---|---|---|---|
| Whole tibia | Proximal tibia (R1) | Medial plateau | Lateral plateau | ||
| OARSI | r s | −0.054 | −0.105 | −0.131 | −0.205 |
| P | 0.816 | 0.0650 | 0.572 | 0.372 | |
| Mankin's | r s | −0.104 | −0.070 | −0.056 | −0.106 |
| P | 0.654 | 0.765 | 0.809 | 0.646 | |
Ovariectomy significantly alters trabecular microstructure and turnover at 1 year, as previously described (Holland et al. 2011, 2013); correlations were performed to see whether alterations in trabecular microstructure were also associated with advancing osteoarthritis. There was an inverse relationship observed between connectivity density and the OARSI score but this did not reach significance (rs = −0.364, P = 0.086; Table 2). Although there was a trend towards reduced trabecular hemi-osteonal (or surface) turnover in sheep with increasing osteoarthritis, the number of intra-trabecular osteons showed a mild elevation. However, these trends were not statistically significant.
| n = 22 | Trabecular microstructure | |||||||
|---|---|---|---|---|---|---|---|---|
| BV/TV | Tb.N | TbTh | Dens | TbSp | SMI | HA | ||
| OARSI | r s | −0.0942 | −0.115 | −0.114 | −0.364 | 0.0942 | −0.265 | 0.100 |
| P | 0.666 | 0.595 | 0.598 | 0.0868 | 0.666 | 0.219 | 0.646 | |
| Mankin's | r s | 0.0557 | −0.150 | −0.048 | −0.211 | −0.002 | −0.466 | −0.019 |
| P | 0.799 | 0.489 | 0.823 | 0.328 | 0.991 | 0.0252 | 0.926 | |
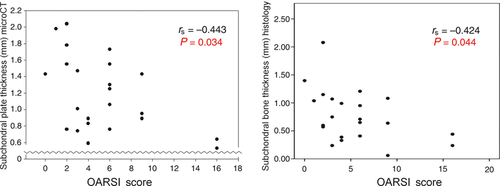
Next, correlations were performed between histological osteoarthritis and subchondral plate thickness and hydroxyapatite concentrations as measured by MicroCT. When looking at the sheep overall, there was a significant inverse relationship observed between osteoarthritis and subchondral plate thickness (rs = −0.443, P = 0.034; Fig. 8). One advantage of the microscopic measurement over MicroCT is the ability to differentiate between the bone and the calcified cartilage within the subchondral plate. On microscopic assessment, thinning was observed to be primarily within the bone of the subchondral plate, not the calcified cartilage layer (rs = −0.424, P = 0.044). Of note, surgery alone did not show any significant effect on subchondral bone thickness between OVX and Control groups (0.68 vs. 0.62 mm; P = 0.582; Mann–Whitney U-test). Correlations were then performed between osteoarthritis and the number of labelled osteons visible in the subchondral plate (Holland et al. 2013); none of these analyses was statistically significant.
Discussion
Ovariectomy is a standard animal model for osteoporosis but reviews of the literature seem conflicting when examining the relationship between osteoarthritis and osteoporosis, regardless of the method used to induce disease. Traditionally, the two diseases have often been seen as mutually exclusive (Dequeker, 1997; Stewart & Black, 2000; Zhang et al. 2010). We have previously shown that trabecular microstructure, bone turnover and bone mineral density are all significantly altered at 1 year postovariectomy (Holland et al. 2011, 2013). However, despite seeing evidence of osteoarthritis in the majority of our osteochondral specimens, no measurable difference in osteoarthritis was observed between ovariectomised and control sheep using either of the two most prevalent histological scoring methods. Previous studies in a variety of animal models have suggested a positive link between ovariectomy and osteoarthritis but this was not verified in this ovine model (Turner et al. 1997; Cake et al. 2005; Sniekers et al. 2008). In addition, no correlation was found between osteoarthritis and bone mineral density, as determined by DEXA, or alterations in subchondral trabecular histomorphometry, as measured by MicroCT. With regard to localised periarticular osteoporosis, whereas some studies show that increased subchondral bone mineral density is associated with reduced joint space narrowing and osteoarthritis progression (Bruyere et al. 2003), other research suggests that periarticular osteoporosis commonly occurs with osteoarthritis (Karvonen et al. 1998; Patel et al. 2003). A number of animal models have shown trabecular thinning and increased trabecular spacing in the early stages of the disease (Layton et al. 1988; Dedrick et al. 1993; Botter et al. 2008); additional studies suggest that bone morphometry is altered again in the mid- to late stages of osteoarthritis, with trabecular thickening and increased bone volume fraction becoming evident (Layton et al. 1988; Bobinac et al. 2003; Chappard et al. 2006; Zhang et al. 2010).
No trabecular differences were observed in this study, but osteoarthritis was associated with significant thinning of the subchondral plate and bone. Although there are few published studies examining the subchondral plate in early osteoarthritis to use for comparison, these data do confirm a thinning in the early stages of the disease (Dedrick et al. 1993; Botter et al. 2008; Kuroki et al. 2011). Again, these features change in the later stages of the disease process, when thickening of the subchondral plate is typical (Grynpas et al. 1991; Dedrick et al. 1993; Li et al. 1999; Buckland-Wright, 2004).
No correlation was found between bone turnover rates of either the subchondral trabecular bone or bone plate with osteoarthritis in this study, although studies employing scintigraphy and measuring bone resorption markers have previously suggested that bone turnover is increased in symptomatic osteoarthritis (Sharif et al. 1995; Hayami et al. 2004; Kwan Tat et al. 2010). Few have confirmed this remodelling rate by histological examination, and none within an ovine model (Benske et al. 1988). One observation regarding our data is that the 12-month endpoint used within this study is quite early; as with the trabecular and subchondral morphometric changes described above, it may be that while little evidence of elevated turnover is seen within the early stages of the disease, these associated pathological processes then change with advancement of the condition, and thus turnover eventually accelerates.
As noted previously, osteoarthritis and osteoporosis have traditionally been viewed as being mutually exclusive (Dequeker, 1997; Stewart & Black, 2000). However, diseases do not always occur in isolation; osteoarthritis is predominantly prevalent in the same epidemiological group as osteoporosis, i.e. postmenopausal women. Animal studies which initially induce osteoporosis in an experimental group by ovariectomy, and proceed to mechanically induce osteoarthritis in both control and experimental groups following this, show persuasive evidence that a synergistic relationship between the two pathologies may be present; the severity of cartilage damage has been shown to be increased in animals who had both osteoporosis and osteoarthritis induced, as compared with those with osteoarthritis alone (Calvo et al. 2007; Bellido et al. 2010). The role of bisphosphonates is also being queried in relation to osteoarthritis, with at least one animal study suggesting a chondroprotective effect (Hayami et al. 2004). Again, perhaps this is due to the fact that treatment of an underlying osteopenia will result in a less florid form of any accompanying or subsequent osteoarthritis.
This study had a number of limitations. Mixed breeds of sheep were used in this experiment, which may have different natural metabolic states and also different metabolic responses to ovariectomy. Additionally, although all animals were skeletally mature (with an age range of between 5 and 9 years) the precise age of each sheep was undocumented and unobtainable. Although seasonal variations in ovine bone turnover do occur, due to the longer oestrous cycles present in these animals during the summer months, all animals were sacrificed on the same autumn day, so any effects from this physiological variable should be minimised (Kennedy et al. 2009; Holland et al. 2011). Another limitation is that the osteoarthritis grade may have been underestimated in some sheep using this model. To perform standardised analysis of the subchondral bone morphometry and turnover, Specimen A was taken from the same point of maximal femoro-tibial contact and pressure in all sheep (Fukubayashi & Kurosawa, 1980; Holland et al. 2011). Specimen B was taken just posterior to this; however, this may not always have been the site of maximal osteoarthritis, as would be the usual procedure when taking a specimen for grading. For this reason, we feel that the OARSI score is probably more reliable than Mankin's, given that the former system also stages the macroscopic area of affected cartilage, rather than relying on a disease grade from one isolated piece of cartilage; this is a view supported by other studies (Custers et al. 2007). While the 12-month endpoint used within this study is quite early, we know from previously reported data that significant structural and turnover alterations are evident between ovariectomised and control sheep at 1 year postoperatively (Holland et al. 2011, 2013).
In conclusion, we found no evidence that osteoarthritis is increased in ewes at 1 year postovariectomy. Osteoarthritis was associated with a thinning of the subchondral bone plate but there was no evidence of alterations in bone mineral density or trabecular morphometry. However, although ovariectomy may not increase the risk of osteoarthritis per se, it will cause osteopenia; if osteoarthritis then occurs, the synergy between these two disease processes may mean that the osteoarthritis in the ovariectomised group will be more severe.
Acknowledgements
The authors thank Peter O'Reilly for technical assistance with MicroCT. They also thank Brian Cloak and the staff at the Lyons Research Facility, UCD, for animal care and handling.
Funding
This project was funded by the Higher Education Authority in Ireland under the PRTLI Cycle III and by a Research Committee grant from the Royal College of Surgeons in Ireland. The funding agencies had no role in the study design, collection, analysis and interpretation of data, writing of the manuscript, or decision to submit the manuscript for publication.
Conflict of interest
None of the authors has any conflict of interest to report.


