Out-of-Sequence Nucleation in a Blueschist From Syros, Greece
Funding: This work was supported by the National Science Foundation (2147526) and funds from the Edward P. Hamilton Chair (at Rensselaer).
ABSTRACT
Two samples of garnet + glaucophane + chloritoid + phengite + paragonite + quartz + epidote + rutile schist from the Cycladic Blueschist Unit of Syros, Greece, have been examined in detail in order to constrain the paragenetic sequence and to infer the processes and time scales for metamorphic recrystallization. Petrographic evidence clearly demonstrates the sequence of porphyroblast growth is garnet ➔ glaucophane ➔ chloritoid in contrast to the sequence predicted by equilibrium calculations that is glaucophane ➔ garnet ➔ chloritoid. Most importantly, both garnet and glaucophane do not appear in the assemblage at conditions near the equilibrium phase-in reaction boundary and require considerable overstepping before nucleation occurs. These results reveal that equilibrium thermodynamic forward modelling (e.g., pseudosections) does not accurately predict or explain the observed paragenesis. Growth of glaucophane following nucleation has been modelled using a model of local equilibrium driven by excess reaction affinity and is shown to drive additional reactions among phases not directly in contact with the glaucophane. These reactions have resulted in the consumption of garnet in some locations and the simultaneous production of garnet in other locations, which is used to explain the formation of high-Mn overgrowths on many garnet crystals in these samples. Diffusion modelling of these high-Mn overgrowths suggests very rapid cooling, which must require extremely rapid exhumation subsequent to the rocks having reached peak metamorphic conditions.
1 Introduction
A mainstay of the quantification of metamorphic paragenesis over the past 50 years is the application of equilibrium thermodynamics to the determination of metamorphic P–T conditions and P–T paths. Extraordinary progress has been made in the past 30 years or so in the development of thermodynamic databases and activity models and the software to utilize these databases for petrologic calculations (e.g., Thompson 1955, 1957; Brown and Skinner 1974; Rumble 1974; Robie et al. 1978; Holland and Powell 1985, 1998, 2011; de Capitani and Brown 1987; Berman 1988; Berman and Brown 1992; Spear 1993; Powell et al. 1998; Connolly and Petrini 2002; Connolly 2009; de Capitani and Petrakakis 2010; Lanari and Duesterhoeft 2019).
Although these approaches represent a considerable step forward, there is a growing body of observations that suggest that metamorphic parageneses are not governed entirely by equilibrium postulates but that the assemblages observed and the compositions of phases in these assemblages are controlled, in part, by kinetic factors including activation energies for nucleation and by diffusion and reaction processes for mineral growth (e.g., Waters and Lovegrove 2002; Pattison et al. 2011; Spear et al. 2014; Carlson et al. 2015; Spear and Pattison 2017; Castro and Spear 2017; Pattison and Spear 2018; Wolfe and Spear 2018; Spear and Wolfe 2019, 2022; Spear 2024a, 2025a).
This study presents new information on two samples from the Cycladic Blueschist Unit (CBU) on Syros, Greece, in which it has been observed that the expected sequence of mineral formation from equilibrium calculations does not match the observed sequence of mineral evolution. The observations can be explained if it is assumed that garnet, glaucophane and perhaps chloritoid did not nucleate until the equilibrium phase-in boundary had been overstepped by a considerable amount. Consequently, one goal of this study is to attempt to constrain the degree of overstepping required to nucleate these phases. Knowledge of the degree of overstepping is of critical importance in evaluating the P–T path that the rocks have followed as it relates directly to the P–T conditions in the CBU subduction complex. A second goal is to assess the degree to which equilibrium phase diagrams can be used to correctly infer the P–T history of a metamorphic rock. The importance of the P–T evolution of rocks in subduction complexes cannot be overemphasized because of its direct impact on the rates and amounts of fluid migration; the subsequent history of these fluids in the subduction channel directly impacts the triggering of earthquakes, partial melting of the overlying mantle and the generation of arc volcanism.
2 Geologic Setting and Sample Descriptions
The two samples selected for this study come from the CBU on the island of Syros, Greece (Figures 1 and 2). There are numerous published studies of the metamorphism of the CBU (e.g., Dixon 1976; van der Maar and Jansen 1983; Schliestedt 1986; Ridley 1984; Dixon and Ridley 1987; Dixon et al. 1987; Avigad 1993; Lister and Raouzaios 1996; Höpfer and Schumacher 1997; Forster and Lister 1999a, 1999b, 2005; Bröcker and Enders 1999, 2001; Tomaschek et al. 2003; Ring and Layer 2003; Schumacher et al. 2008; Huet et al. 2009; Trotet, Jolivet, et al. 2001; Trotet, Vidal, et al. 2001; Putlitz et al. 2005; Spear et al. 2006; Bröcker and Franz 2000; Thomson et al. 2009; Philippon et al. 2011; Dragovic et al. 2012, 2015; Ashley et al. 2014; Laurent et al. 2016, 2018; Hamelin et al. 2018; Forster et al. 2020; Kotowski and Behr 2019; Lamont et al. 2020; Gorce et al. 2021; Kotowski et al. 2022), and the general consensus is that at least some of the units on Syros, Sifnos and Ios reached peak metamorphic conditions of around 525°C–550°C at pressures of 2.0–2.2 GPa. Many of these studies have inferred a generally clockwise prograde P–T path that follows a trajectory of around 7°C–8°C/km to the peak metamorphic conditions followed by nearly isothermal decompression during exhumation (see Spear et al. 2024, for a summary). Recent papers by Spear et al. (2023, 2024) and Wolfe et al. (2023), however, have inferred an alternative prograde P–T path for the CBU that involves early subduction along a trajectory of around 11°C/km to a depth of around 45 km followed by near isothermal loading to the metamorphic peak. These studies were based on detailed analysis of quartz-in-garnet (QuiG) barometry and zirconium-in-rutile (ZiR) thermometry on the islands of Ios (Wolfe et al. 2023), Sifnos (Spear et al. 2023) and Syros (Spear et al. 2024) which, in general constrain the nucleation of garnet in the samples under investigation to have occurred above around 1.3 GPa and 500°C. A thermal model was also presented by Spear et al. (2024) to demonstrate that either a change in subduction velocity or a change in the dip of subduction could result in the inferred P–T path. In contrast, previous studies relied largely on equilibrium phase diagrams (e.g., pseudosections) in which the major constraint on the prograde P–T path was through the so-called ‘intersecting garnet isopleth method’, which has been shown to result in erroneous prograde paths in rocks in which garnet nucleates and grows out of equilibrium (e.g., Spear et al. 2014; Spear and Wolfe 2018, 2019, 2020; Castro and Spear 2017; Wolfe and Spear 2018, 2020).
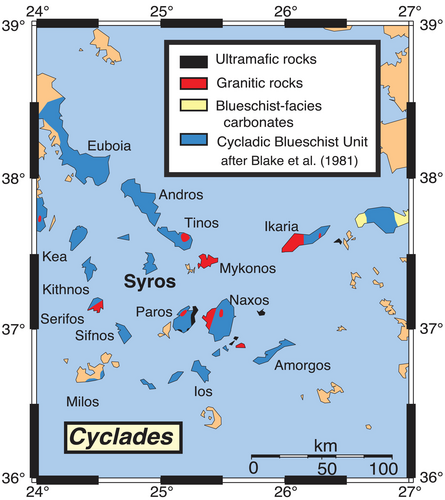
After Blake et al. (1981).
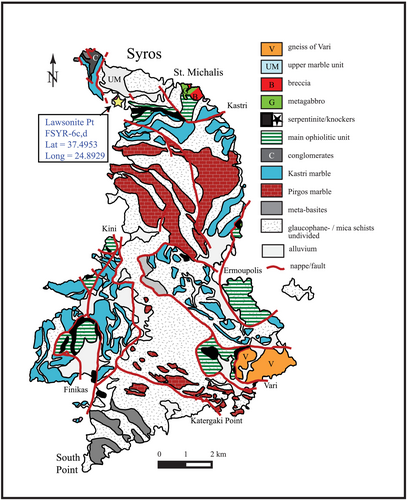
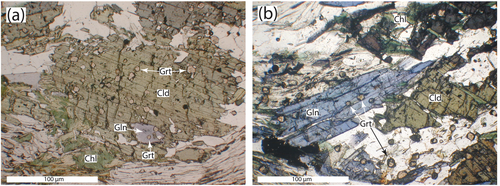
The sample locality FSYR-6 is in the northwest part of the island of Syros, Greece, in a location known colloquially as ‘Lawsonite Point’ (Figure 2 and Table 1). The rocks are schists and are composed of quartz + phengite + paragonite + glaucophane + chloritoid + chlorite + garnet + rutile + apatite + epidote with white mica defining a distinctive foliation (Figure 3). Mineral inclusion relations have been used to infer a well-constrained sequence of mineral formation. Chloritoid contains inclusions of glaucophane, garnet and chlorite, glaucophane contains inclusions of garnet and rutile inclusions are found inside of garnet, glaucophane and chloritoid as well as in the matrix. Therefore, the observed paragenetic sequence was rutile ➔ garnet ➔ glaucophane ➔ chloritoid. Chlorite is present in both samples aligned with matrix white micas and as a replacement of chloritoid. It is assumed that phengite, paragonite, chlorite and quartz were present at grades below the first appearance of garnet and persisted throughout.
| Latitude | Longitude | Phases present | |
|---|---|---|---|
| FSYR-6c,d | 37.4953 | 24.8929 | Gln-Cld-Ep-Grt-Chl-Qtz-Ph-Pg-Rt-Ap |
- Note: Abbreviations after Kretz (1983).
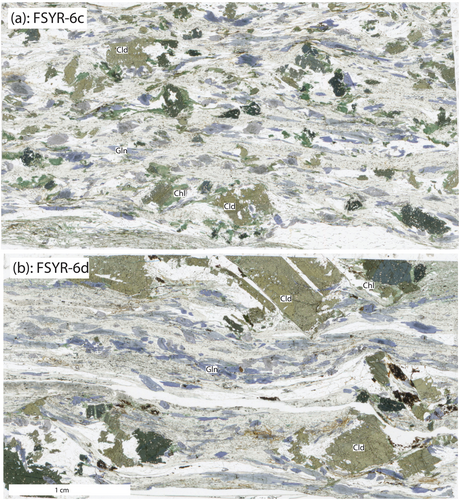
Of particular interest in these samples is the size and distribution of garnet crystals (Figure 4). In most garnet-bearing rocks from Syros, garnet crystals range in size from 1 mm to over 1 cm in diameter and crystal densities are on the order of a few crystals per cubic centimetre. In contrast, garnet from samples FSYR-6 range in size from a maximum of around 100 μm to less than 10 μm diameter, and crystal densities are in the range of 10,000–20,000 crystals per cubic centimetre. Garnet crystals are located in the matrix and as inclusions inside of both glaucophane and chloritoid (Figure 4).
3 Methods
Chemical analyses and X-ray maps were made using the Cameca SX-100 at Rensselaer Polytechnic Institute and the Cameca SX-5 at Syracuse University using natural and synthetic materials as standards. Zr analyses in rutile were made following the protocols outlined in Spear et al. (2006) and precisions ranged from 7–13 ppm, depending on the analytical protocol adopted. Calculations for the solubility of Zr-in-rutile were done using the calibration of Tomkins et al. (2007). Bulk chemical analyses were made using an EDS spectrometer at both Bucknell University and Amherst College following methods discussed by Spear and Wolfe (2022). Equilibrium mineral assemblage diagrams (MADs or pseudosections) were calculated on each sample to provide an estimate of the equilibrium phase boundaries for garnet, glaucophane and chloritoid. Calculations were performed using the thermodynamic datasets of Holland & Powell (2011: HP11; ds6.2), Holland & Powell (1998: HP98; ds 5.5) and Spear & Pyle (2010: SPaC) in order to compare results. All calculations were done using program Gibbs (Spear and Wolfe 2022, supplemental material; Spear 2024b).
Grain boundary reaction modelling was performed using Program Gibbs6MDF developed specifically for the purpose of exploring the textural ramifications of grain boundary diffusion on phase evolution subsequent to the nucleation of a new phase that is out of equilibrium with the existing assemblage (i.e., nucleation after considerable overstepping). The theoretical basis for the reaction and diffusion modelling in the program are discussed in detail by Spear (2024a, 2025a), and the program and notes are included in Spear (2025b, 2025c).
Diffusion modelling to constrain the sample residence time at near peak temperature was done using program GarDiff (Spear et al. 2024; Spear 2024c) using the Mn diffusivities of Chakraborty and Ganguly (1992) following methods outlined in Spear et al. (2012) and Spear (2014, 2017).
4 Mineral Compositions
Analyses of major mineral phases are presented in Table 2. The compositional zoning of garnet (Figure 5) is typical of garnet from pelitic bulk compositions with Mn enriched in the cores and progressively decreasing towards the rim (Figure 5c). Spessartine core compositions are on the order of 0.50–0.55, near rim compositions are 0.06–0.12, and high spessartine overgrowths that appear on some garnets are on the order of 0.25. Fe zoning is generally antithetic to that of Mn (Figure 5a) and Ca zoning in garnet shows a slight decrease from core to rim (Figure 5d).
| Sample | FSYR-6c | FSYR-6c | FSYR-6c | FSYR-6d | FSYR-6d | FSYR-6c | FSYR-6c | FSYR-6d | FSYR-6d | FSYR-6c | FSYR-6d | FSYR-6c | FSYR-6d | FSYR-6c | FSYR-6d | FSYR-6c | FSYR-6d |
|---|---|---|---|---|---|---|---|---|---|---|---|---|---|---|---|---|---|
| Mineral | Grt | Grt | Grt | Grt | Grt | Gln | Gln | Gln | Gln | Ctd | Ctd | Chl | Chl | Phengite | Phengite | Pg | Pg |
| Location | Core | Near rim | Overgrowth | Core | Rim | Core | Rim | Core | Rim | Core | Core | Core | Core | ||||
| Weight % oxide | |||||||||||||||||
| SiO2 | 36.18 | 37.62 | 37.22 | 36.38 | 37.09 | 56.45 | 57.49 | 56.67 | 57.36 | 25.18 | 25.05 | 25.61 | 27.19 | 51.79 | 51.35 | 48.53 | 47.92 |
| Al2O3 | 19.83 | 21.07 | 21.14 | 19.95 | 20.85 | 8.67 | 9.94 | 9.19 | 9.47 | 40.40 | 40.50 | 20.38 | 20.29 | 29.10 | 29.07 | 41.14 | 41.05 |
| TiO2 | 0.23 | 0.04 | 0.03 | 0.20 | 0.05 | 0.10 | 0.03 | 0.06 | 0.02 | 0.01 | 0.01 | 0.06 | 0.04 | 0.18 | 0.18 | 0.02 | 0.05 |
| MgO | 0.45 | 3.25 | 1.51 | 0.64 | 2.47 | 10.74 | 11.08 | 10.84 | 11.05 | 6.41 | 6.42 | 14.22 | 18.61 | 3.38 | 3.22 | 0.13 | 0.11 |
| FeO | 11.67 | 29.90 | 23.73 | 13.35 | 28.37 | 13.10 | 11.02 | 12.86 | 11.91 | 20.50 | 20.98 | 27.30 | 21.72 | 3.80 | 3.93 | 1.38 | 1.19 |
| Fe2O3 | |||||||||||||||||
| MnO | 25.31 | 2.74 | 11.30 | 23.28 | 5.44 | 0.18 | 0.09 | 0.16 | 0.13 | 0.47 | 0.28 | 1.09 | 0.50 | 0.02 | 0.02 | 0.02 | 0.02 |
| CaO | 6.48 | 5.66 | 5.48 | 6.32 | 5.95 | 1.10 | 0.87 | 1.14 | 1.06 | 0.00 | 0.02 | 0.01 | 0.01 | 0.00 | 0.01 | 0.07 | 0.11 |
| Na2O | 6.86 | 6.98 | 6.90 | 6.94 | 0.02 | 0.01 | 0.03 | 0.01 | 0.40 | 0.51 | 5.49 | 5.83 | |||||
| K2O | 0.02 | 0.02 | 0.03 | 0.02 | 0.00 | 0.01 | 0.02 | 0.04 | 8.58 | 8.75 | 0.34 | 0.37 | |||||
| Cr2O3 | 0.01 | 0.04 | 0.03 | 0.04 | 0.02 | ||||||||||||
| Total | 100.16 | 100.32 | 100.43 | 100.17 | 100.23 | 97.22 | 97.52 | 97.86 | 97.97 | 93.01 | 93.27 | 88.72 | 88.41 | 97.27 | 97.02 | 97.12 | 96.65 |
| FeO | 8.25 | 7.79 | 8.11 | 7.83 | |||||||||||||
| Fe2O3 | 5.39 | 3.59 | 5.28 | 4.53 | |||||||||||||
| Cations (apfu) | |||||||||||||||||
| Si | 2.962 | 2.993 | 2.989 | 2.970 | 2.977 | 7.852 | 7.896 | 7.820 | 7.871 | 2.029 | 2.016 | 5.409 | 5.566 | 3.363 | 3.352 | 3.019 | 3.001 |
| Al | 1.914 | 1.976 | 2.001 | 1.920 | 1.972 | 1.420 | 1.609 | 1.495 | 1.532 | 3.837 | 3.842 | 5.073 | 4.896 | 2.227 | 2.236 | 3.016 | 3.029 |
| Ti | 0.014 | 0.002 | 0.002 | 0.013 | 0.002 | 0.010 | 0.003 | 0.007 | 0.003 | 0.000 | 0.000 | 0.010 | 0.006 | 0.009 | 0.009 | 0.001 | 0.002 |
| Mg | 0.054 | 0.386 | 0.181 | 0.078 | 0.296 | 2.227 | 2.268 | 2.231 | 2.260 | 0.770 | 0.770 | 4.477 | 5.679 | 0.327 | 0.314 | 0.012 | 0.010 |
| Fe2+ | 0.799 | 1.989 | 1.594 | 0.911 | 1.904 | 0.960 | 0.895 | 0.936 | 0.898 | 1.382 | 1.413 | 4.862 | 3.701 | 0.207 | 0.214 | 0.072 | 0.062 |
| Fe3+ | 0.564 | 0.371 | 0.548 | 0.468 | 0.000 | 0.000 | 0.000 | 0.018 | |||||||||
| Mn | 1.755 | 0.184 | 0.768 | 1.610 | 0.369 | 0.021 | 0.010 | 0.019 | 0.015 | 0.032 | 0.019 | 0.195 | 0.087 | 0.001 | 0.001 | 0.001 | 0.001 |
| Ca | 0.569 | 0.482 | 0.472 | 0.553 | 0.511 | 0.164 | 0.128 | 0.169 | 0.156 | 0.000 | 0.001 | 0.002 | 0.002 | ||||
| Na | 1.849 | 1.859 | 1.845 | 1.846 | 0.002 | 0.002 | 0.025 | 0.008 | 0.051 | 0.064 | 0.663 | 0.708 | |||||
| K | 0.004 | 0.004 | 0.006 | 0.003 | 0.000 | 0.001 | 0.011 | 0.021 | 0.711 | 0.728 | 0.027 | 0.029 | |||||
| Cr | 0.001 | 0.002 | 0.002 | 0.002 | 0.002 | ||||||||||||
| Total | 8.070 | 8.015 | 8.008 | 8.056 | 8.033 | 15.072 | 15.042 | 15.077 | 15.052 | 8.053 | 8.064 | 20.063 | 19.985 | 6.896 | 6.918 | 6.811 | 6.842 |
| End member compositions | |||||||||||||||||
| Alm | 0.25 | 0.65 | 0.53 | 0.29 | 0.62 | ||||||||||||
| Pyr | 0.02 | 0.13 | 0.06 | 0.02 | 0.10 | ||||||||||||
| Sps | 0.55 | 0.06 | 0.25 | 0.51 | 0.12 | ||||||||||||
| Grs | 0.18 | 0.16 | 0.16 | 0.18 | 0.17 | ||||||||||||
| Fe3+/(Fe3+ +AlVI) | 0.31 | 0.20 | 0.29 | 0.25 | |||||||||||||
| XGlna | 0.89 | 0.91 | 0.89 | 0.90 | |||||||||||||
| Na/(Na + K) | 0.07 | 0.08 | 0.96 | 0.96 | |||||||||||||
- Note: Values calculated following the method in Wolfe et al. (2023, supplemental material).
- a XGln calculated as Na(M4)/2.0.
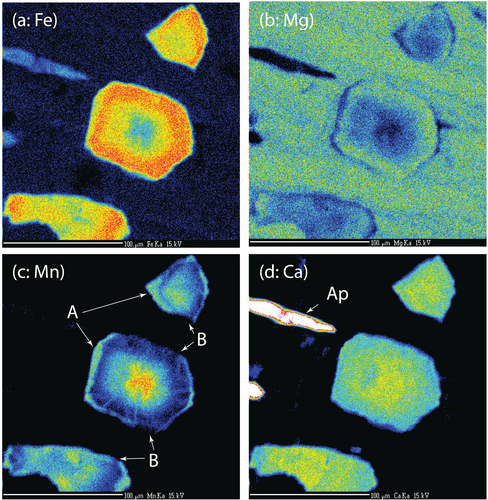
There is strong evidence that some parts of the garnet rims have been resorbed (Figures 5c and 6 arrow ‘B’). Partially resorbed garnets are found in the matrix and as inclusions in both glaucophane and chloritoid, although inclusions within glaucophane appear to show the most extensive amounts of resorption.
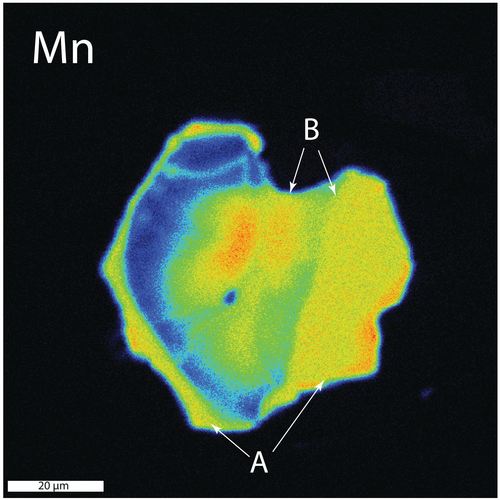
Many grains also display a rim that is enriched in Mn (Figures 5c and 6 arrow ‘A’). Higher Mn rims are found on garnets in all locations, although these rims are generally more pronounced on matrix garnets. The interface between these high-Mn rims and near the lower-Mn rim region is extremely sharp (e.g., Figure 6) and spans only around 2 μm. Inasmuch as the excitation diameter of the electron beam is on the order of 1 μm, it is possible that this boundary is, in fact, a step function. Diffusion calculations are presented below to constrain an upper limit to the time these samples could have been at near-peak temperature.
This method carries a smaller uncertainty than stoichiometric renormalization methods (e.g., Spear and Kimball 1984; Hawthorne et al. 2012) and it also does not exclude Na in the amphibole A-site. Nevertheless, both approaches give similar results with the stoichiometric approach yielding values of Fe3+/(Fe3+ + AlVI) that are only 0.05–0.07 higher than those reported here.
Chloritoid, chlorite, phengite and paragonite are unzoned within analytical uncertainty. Tetrahedral Si contents of phengite and paragonite are 3.35–3.36 and 3.02–3.00, respectively.
5 Thermodynamic Modelling
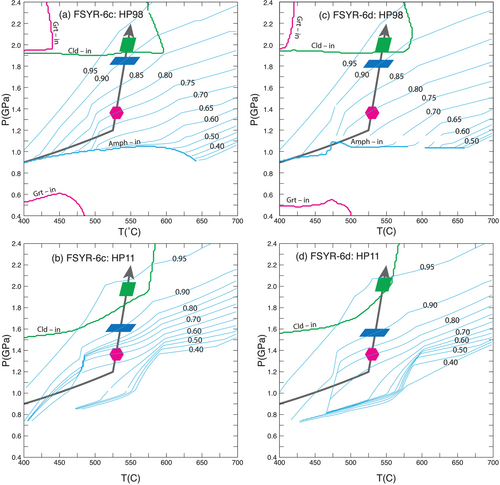
Spear et al. (2024) argue that the blueschists and eclogites of Syros followed an initial subduction P–T path of approximately 11°C/km followed by a steeper, nearly isothermal path to the peak P–T conditions of around 550°C, 2.2 GPa. This path was constrained through numerous analyses of Zr in rutile inclusions within garnet and QuiG barometry. Because both the analysed rutile and quartz were inclusions in garnet, it was argued that the calculated P–T conditions of the inclusions must place a limit on the P–T conditions of garnet formation (e.g., Spear et al. 2023, 2024). Somewhat surprisingly, numerous samples from the islands of Ios (Wolfe et al. 2023), Sifnos (Spear et al. 2023) and Syros (Spear et al. 2024) gave similar results that constrained the lowest pressure of garnet formation to around 1.3 GPa at 525°C. Other samples recorded garnet formation pressures as high as 2.2 GPa at 525°C–550°C and the simplest P–T path to accommodate these findings is the one described above and depicted in Figure 7. In order to facilitate the discussion of calculated results, it will be assumed that the rocks described in this manuscript followed a path from 0°C, 1 bar ➔ 525°C, 1.2 GPa ➔ 550°C, 2.2 GPa (Figure 7), although the results to be discussed are not particularly sensitive to the path followed so long as it is generally concave upward.
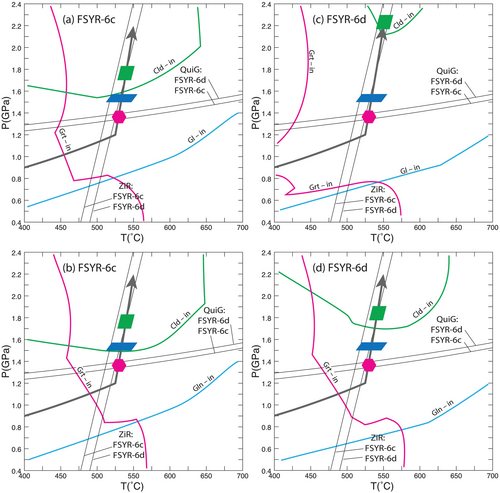
In order to calculate equilibrium phase diagrams, it is necessary to know the bulk rock composition, and there is quite a bit of ambiguity in knowing exactly the effective bulk rock composition (EBC) and how uncertainties in the EBC impact the calculated phase diagrams (e.g., Palin et al. 2016; Lanari and Engi 2017; Spear and Wolfe 2018). In the samples under consideration here, there is locally as much as one modal percent apatite. Therefore, to evaluate the consequence of uncertainty in the EBC for CaO, selected calculations were done with the reported bulk rock analyses (Table 3) as well as modified bulk rock analyses in which the CaO content was decreased to 0.25 wt%.
Figure 7 shows these results with the assumed P–T path and the results of QuiG barometry and ZiR thermometry from Spear et al. (2024). The P–T conditions of garnet formation are well-constrained to have occurred at around 525°C, 1.3 GPa by the QuiG and ZiR results (see Spear et al. 2023, 2024, for discussion). The conditions of formation of glaucophane and chloritoid are not well constrained except that glaucophane contains inclusions of garnet, and chloritoid contains inclusions of both garnet and glaucophane, requiring the crystallization sequence to be garnet ➔ glaucophane ➔ chloritoid, as discussed above.
Also shown in Figure 7 are the calculated stability boundaries for garnet, glaucophane and chloritoid using the SPaC thermodynamic dataset (Spear and Pyle 2010) and the bulk rock compositions shown in Table 3. As can be seen, the formation of garnet occurs considerably upgrade from the equilibrium garnet-in reaction. This result is similar to and consistent with the findings of Castro and Spear (2017) for rocks from Sifnos, Greece, and Wolfe et al. (2023) for rocks from Ios, Greece, as well as numerous other studies (e.g., Spear et al. 2014; Spear and Wolfe 2022; Wolfe and Spear 2018, 2020). Glaucophane, which forms after garnet, also nucleates well above its equilibrium reaction boundary. Constraints on the conditions of chloritoid formation are lacking, except that it must have occurred after the formation of glaucophane. The major impact of adjusting the CaO content (compare Figure 7a with b and Figure 7c with d) is to shift the garnet-in reaction to higher temperature with lower CaO content and to shift the chloritoid-in reaction to significantly lower pressure in sample FSYR-6d. It should be noted that these are equilibrium phase diagrams and assume no fractional crystallization or other modification of the EBC due to overstepping or other kinetic effects. Clearly the calculated affinities (discussed below) will be impacted by the choice of EBC so the values presented should be considered only indicative and not absolute.
The calculations depicted in Figure 7 were made using the SPaC thermodynamic dataset (Spear and Pyle 2010). Similar calculations were made using the dataset of Holland & Powell (1998 and 2011: HP98 and HP11) and are shown in Figure 8. The diagrams using HP98 and HP11 are broadly similar to those calculated with the SPaC dataset and with each other. A notable difference is the location of the garnet-in reaction, which is located at significantly lower temperature than with the SPaC dataset. Another difference is the stability of amphibole over a large part of the diagram using HP98 (amphibole model of Diener et al. 2007) and over the entire diagram using HP11 (amphibole model of Green et al. 2016). The diagrams have been contoured with the mole fraction of glaucophane (XGl) and reveal that the amphibole becomes nearly pure glaucophane at high pressures and low temperatures. The measured XGl in both samples is approximately 0.9, so the glaucophane icon has been placed along the P–T path on the XGl = 0.9 contour for reference. Note, however, that with both HP98 and HP11, the appearance of sodic amphibole only occurs well above the equilibrium amphibole-in reaction. The location of the chloritoid-in reaction is similar using all three datasets and the location of the garnet-in reaction is similar using the HP98 and SPaC datasets.
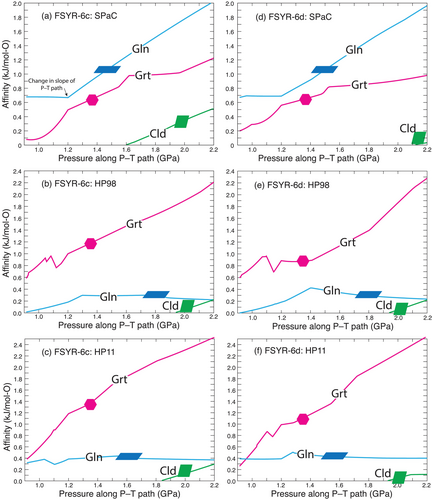
Quantification of the degree of overstepping has been achieved using the parallel tangent method (e.g., Thompson and Spaepen 1983; Gaidies et al. 2011; George and Gaidies 2017) calculated along the P–T path of interest, as shown in Figure 9 for the two samples using the three datasets. The diagram was constructed by first calculating the equilibrium assemblage at each P and T while excluding the phase of interest from the calculations and then calculating using the parallel tangent the Gibbs free energy difference between the free energy of the phase of interest and a fictive phase of the same composition as determined from the equilibrium assemblage (see Spear et al. 2014, for details). Garnet formation is fairly well constrained to have occurred at approximately 525°C, 1.3 GPa. At these conditions the affinity of garnet is around 0.6–0.7 kJ/mol-O based on the SPaC dataset (Figure 9a,d), which is similar to values reported in Spear and Wolfe (2022) and Wolfe and Spear (2018, 2020). The calculated affinity using the HP98 and HP11 datasets is somewhat larger at around 0.9–1.4 kJ/mol-O. This difference is due largely to the difference in activity models, which results in the HP98 and HP11 datasets placing the equilibrium garnet-in curve at considerably lower temperature than the SPaC dataset. The P–T conditions for glaucophane formation are not well constrained but must lie at conditions along the P–T path between garnet-in and chloritoid-in reactions. Again, there is considerable discrepancy between the results obtained from SPaC versus HP98 and HP11, which is most likely the consequence of significantly different activity models. Chloritoid is only constrained to have formed above around 1.6–1.7 GPa, and all three datasets yield similar results for the chloritoid-in nucleation affinities. However, if chloritoid nucleation requires at least several hundred J/mol-O to occur, as appears to be true for both garnet and glaucophane, then it is likely that chloritoid did not form until very near the peak pressure of 2.2 GPa.
The contrast between the calculated equilibrium model and the observed petrogenesis is further illustrated in Figure 10. The two top panels display the modal amounts of garnet, glaucophane and chloritoid based on the equilibrium calculations using the SPaC dataset similar to those shown in Figure 7. Each phase appears at its respective phase-in equilibrium reaction. The two bottom panels show the calculated modal amounts of phases where the first appearance of the phase is constrained to be that indicated by the coloured symbols in Figure 7 (magenta hexagon for garnet, blue parallelogram for glaucophane and green parallelogram for chloritoid). The final amounts of each phase at the peak P–T conditions are the same, but the paragenetic sequence is quite distinct.
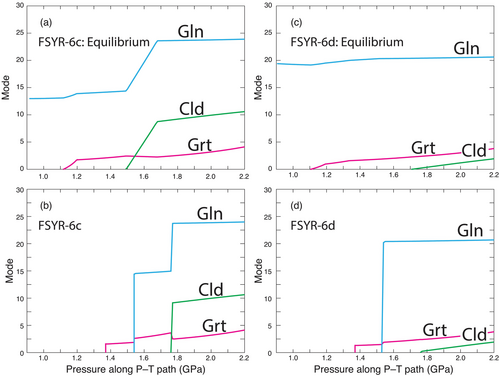
Of particular note in Figure 10 is the evolution of the modal amount of garnet. After an initial increase in amount, the mode of garnet increases but little until the incoming of glaucophane, at which point it increases slightly. The garnet mode then continues to increase in amount until in sample FSYR-6c it decreases slightly as chloritoid grows (not evident in sample FSYR-6d). This calculation is particularly noteworthy because the textural evidence clearly indicates that garnet was resorbed at some point after which it developed a high-Mn overgrowth (e.g., Figures 5 and 6). Furthermore, garnets that display resorption and overgrowths are found as inclusions inside of glaucophane. Therefore, the reactions that resorbed and grew garnet must have occurred before or during the growth of glaucophane. This apparent conundrum inspired the modelling to be discussed in the next section.
6 Modelling Garnet Resorption and Overgrowths
The resorption and overgrowth of new garnet prior to the encapsulation of garnet within glaucophane is inconsistent with whole-rock equilibrium thermodynamic calculations. Consequently, an approach has been attempted that follows on a proposition by Carmichael (1969) and further developed by Spear (2024a, 2025a) that posits that reactions are highly localized and occur only among nearly adjacent phases as dictated by the availability of chemical affinity, which sets up gradients in the grain boundary medium between different regions of the rock. These gradients drive diffusion, which alters the grain boundary composition throughout the rock and thus enables localized reactions to occur in other regions. The nucleation of a new phase far from the equilibrium phase-in boundary (i.e., greatly overstepped) triggers such a situation in that the newly formed phase is far from equilibrium with its local surroundings. In the model discussed here, the newly formed phase is glaucophane which, based on the discussions above and the estimates shown in Figure 9, has between 0.2–1.0 kJ/mol-O of affinity (depending on the dataset used) to dissipate as it reacts towards equilibrium.
The model follows the procedures described in detail by Spear (2024a, 2025a, 2025b, 2025c) in which a grid is created with appropriate phases connected along grain boundaries as shown in Figure 11a. The matrix assemblage consists of quartz + muscovite + paragonite + chlorite + garnet with two newly formed crystals of glaucophane. Each model cycle is composed of a reaction step in which phases react with adjacent phases and the grain boundary medium and grid elements are moved consistent with either the growth or consumption of adjacent phases. The reaction step results in a change in the local grain boundary composition which sets up chemical gradients along the grain boundary and drives diffusion (the diffusion step). The diffusion step changes the grain boundary composition throughout the rock, which will promote local reactions in other locations. Initially, the only phase out of equilibrium with the local assemblage is glaucophane, but as the diffusional flux changes the grain boundary composition elsewhere, additional reactions become possible. The combined reaction step and diffusion step constitutes a model cycle. An important model parameter is the rate of diffusion relative to the rate of reaction, which is accommodated by adjusting the number of diffusion iterations between each reaction step. The degree to which reaction progress is diffusion-limited is unknown, so two models are presented: one in which diffusion is rate limiting (D-L) (Figures 11b and 12a,b), and one in which diffusion is infinitely rapid, here dubbed the reaction-limited (R-L) model (Figures 11c and 12c,d).

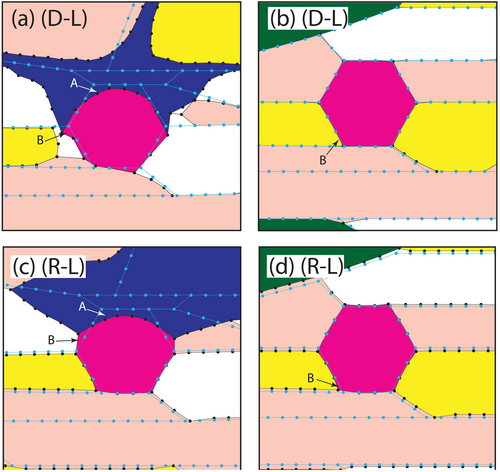
Both the diffusion-limited (Figure 11b) and the reaction-limited (Figure 11c) models resulted in substantial glaucophane growth. Growth of glaucophane occurs not only where paragonite is adjacent (the only Na-bearing reactant phase) but also where in contact with muscovite, chlorite, garnet and quartz with nutrients being supplied through the grain boundary. The primary goal of this modelling was to assess the impact of glaucophane growth on garnet and enlargements of the grid in the vicinity of the two garnets is shown in Figure 12. The final grid is shown with black lines and dots and the initial grid is overlaid with blue lines and dots. What is immediately obvious is that reactions are occurring locally and not at all in accord with the overall bulk-rock thermodynamic calculations. This is specifically because the possible reactions are restricted to the adjacent phase or phases and the composition of the grain boundary.
Examination of Figure 12a,c reveals that glaucophane has grown at the expense of paragonite, muscovite and quartz as well as garnet. That is, garnet is consumed locally by the growth of glaucophane (i.e., point A). However, in some of the garnet perimeter, it is clear that garnet has actually grown even as it is being consumed elsewhere (i.e., point B). Growth of garnet occurs largely where it is adjacent to quartz and muscovite while garnet consumption occurs where it is adjacent to glaucophane. Most importantly, this new garnet is significantly richer in Mn, consistent with the observed high-Mn rims on garnet. Figure 12b,d shows the garnet that is not close to a growing crystal of glaucophane. Although it is quite minor in extent and difficult to see, the model does reveal some localized growth of new garnet (e.g., point B).
In conclusion, it is proposed that the nucleation of glaucophane far from equilibrium triggered localized reactions that resulted in both the consumption of existing garnet and growth of new garnet and serves as a possible explanation of the observed textures (e.g., Figures 5 and 6).
7 Constraints From Diffusion Modelling
Many of the garnets from the two samples investigated have rims that are enriched in Mn (e.g., Figures 5, 6 and 13a). The preservation of these rims requires only very limited diffusion subsequent to their formation; otherwise, the steep Mn gradients would have been smoothed out.
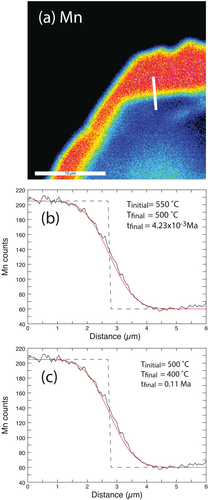
To place a limit on the amount of time the zoning could have been preserved at elevated temperatures, a series of diffusion calculations were conducted in an attempt to model the observed zoning profile. Modelling was done using program GarDiff (Spear et al. 2024; Spear 2024c), which employs an explicit finite difference approximation to solve the diffusion equations, following methods outlined in Spear (2014, 2017) and Spear et al. (2024). Manganese diffusivity in garnet was taken from Chakraborty and Ganguly (1992). The initial profile was assumed to be a step function, as shown in Figure 13b,c.
The temperature at which the Mn rim was produced is uncertain so two models were attempted, one in which the starting temperature was 550°C (the inferred peak temperature) and the second in which the starting temperature was 500°C (a point on the retrograde path). As can be seen in Figure 13, both models fit the observed zoning profile equally well. Calculations with the starting T of 550°C required a cooling rate of 12,000°C/Ma and a total time of only 4234 years to reach 500°C where diffusion effectively ceased. Calculations with the starting T of 500°C required a cooling rate of 1000°C/Ma and a total time of 0.11 Ma to reach 400°C below, which diffusion effectively ceased at this cooling rate. It should be noted that these time estimates are maxima and the cooling rates minima because the zoning profile is so short that the analytical volume of the electron probe beam (around 1 μm) smears out what could be an even steeper Mn gradient. In any case, these time scales are very short in both cases and imply that the residence time of these samples at elevated temperatures was short. That is, the samples must have cooled rapidly from the metamorphic peak. A similar result was discussed by Spear et al. (2024) for a sample from the southern part of Syros and by Lister and Raouzaios (1996) and Forster et al. (2020) based on modelling Ar retention in micas. It should also be noted that the cooling rate must have slowed down considerably to match the age of the greenschist facies overprint that is inferred to have occurred at 400°C–450°C at 20–30 Ma based on mica 40Ar/39Ar ages (Lister and Raouzaios 1996; Forster et al. 2020).
8 Discussion
The results of this study suggest that over much of their paragenesis, the assemblages in the samples under investigation were not in equilibrium. Consequently, attempts to constrain a prograde P–T path using equilibrium calculations cannot provide meaningful results. Rather, the evidence suggests that the mineralogy of the samples remained relatively constant until the amount of overstepping and affinity buildup triggered a nucleation event resulting in the formation of a new phase (e.g., garnet, glaucophane or chloritoid). This new phase was out of equilibrium with the assemblage, and local reactions ensued as the system attempted to achieve equilibrium. These local reactions modified grain boundary compositions that drove the flux of elements through the grain boundary and resulted in reactions occurring at locations distant from the newly nucleated phase. Of course, it is also possible that the resorption and regrowth of garnet could have been caused by fluctuations in pressure and temperature perhaps due to fluid overpressure caused by dehydration reactions (e.g., Zou et al. 2025), but it is not possible to account for simultaneous resorption and growth of garnet by this type of mechanism.
The sequence of mineral formation (i.e., garnet then glaucophane) is also inconsistent with equilibrium calculations, which predict that glaucophane should form before garnet. Such out-of-sequence mineral formation has also been observed in the contact aureole of the Bushveld Complex (Waters and Lovegrove 2002) and has been invoked to explain textural relations between staurolite and kyanite in Barrovian metapelites (e.g., Pattison and Spear 2018). Considerably more work is required to reveal how common this phenomenon might be.
The sharp zoning boundaries associated with the high-Mn overgrowths on garnet suggest extraordinarily rapid cooling rates. Of course, it is possible that the high-Mn overgrowths did not form at 500°C–550°C but rather when the rock was at a lower temperature. This possibility is not consistent, however, with the observation that some garnets included inside of glaucophane display high-Mn over growths nor with the grain boundary modelling discussed above. If these cooling rates are taken at face value, the question then arises as to how to achieve such rapid cooling rates in rocks in a subduction complex. It is possible to rapidly cool packages of rocks by exhumation back up the subduction channel, but the rate of cooling depends very strongly on the thickness of the package. For example, given a thermal diffusivity of 𝛫 = 10−6 m2/s, the thermal decay constant (t = x2/𝛫) for a slab 1-km thick is on the order of 31,700 years, which is well within the range of calculated cooling times discussed above. The required rate of exhumation can be estimated by assuming, for example, that exhumation began at the peak pressure of around 2.2 GPa at either 550°C or 500°C, and the Mn zoning profile was frozen in when the rock reached 1.2 GPa at either 500°C or 400°C. This would require a change in pressure of around 1 GPa (i.e., around 33 km) over the diffusional time scale discussed above. That is, if the cause of the rapid cooling is rapid exhumation, then the rate must have been on the order of 300–7800 mm/year.
Similar rapid cooling has been documented by diffusion modelling in rocks from the Nestos Thrust Zone in Rhodope, Greece, by Burg and Moulas (2022), where extreme cooling rates were interpreted to result following episodes of shear heating along major structures rather than fast exhumation. Friction-induced shear heating has been proposed to be an important factor in the total heat flow budget of subduction zones (e.g., Kohn et al. 2018), ultimately contributing to the temperatures experienced by rocks near the slab interface, but we do not observe evidence of a transient thermal anomaly like that proposed by Burg and Moulas (2022) in these HP/LT rocks. Although the possibility exists that these extremely rapid cooling rates could be derived from localized shear heating, this interpretation must be reconciled with the inclusion relationships in these rocks, where high-spessartine overgrowths on garnet are found within glaucophane and chloritoid. This indicates that fast cooling had to occur after the growth of chloritoid, which likely grew at near peak pressures (~2.0–2.2 GPa). We hypothesize that fast exhumation is still required to preserve these sharp Mn zoning profiles in garnet rims.
9 Conclusions
The results of this study reveal that nucleation and growth of new minerals in blueschists from Syros, Greece, do not follow the sequence predicted by phase equilibrium calculations. This illustrates yet another natural example of a metamorphic paragenesis where considerable overstepping is required for the formation of a new phase; additionally, this study demonstrates that the amount of overstepping required for specific phases may be significantly different. Similar conclusions have been drawn regarding the formation of garnet in blueschists (Spear et al. 2014; Castro and Spear 2017), in metapelites from Barrovian terranes (e.g., Pattison and Spear 2018; Wolfe and Spear 2018), and in metapelites from the Bushveld contact aureole (Waters and Lovegrove 2002). It will require the results of considerable future work to ascertain the degree to which this type of overstepped and out of sequence mineral formation occurs in other locales and, most importantly, the conditions under which it is permissible to use equilibrium phase diagrams to constrain the P–T conditions of metamorphism. It should also be pointed out that the magnitude of overstepping or, more accurately, affinity required to nucleate a new phase is highly uncertain and is very sensitive to the assumed effective bulk composition and the thermodynamic dataset used for the calculations. However, it is clear that progress in our ability to utilize parageneses observed in metamorphic rocks to constrain tectonic processes will undoubtedly require significantly greater understanding of the kinetics of metamorphic recrystallization.
Acknowledgements
This work was funded in part by grant 2147526 from the National Science Foundation (to Spear) and funds from the Edward P. Hamilton Chair (at Rensselaer). Koch thanks J. Thomas and Z. Osbourne for assistance with electron microprobe analyses at Syracuse University. The authors are grateful to Chris Daniel (Bucknell University) for providing the bulk rock chemical analyses. Insightful reviews by Richard White and Simon Schorn greatly improved the presentation and interpretations.
Conflicts of Interest
The authors declare no conflicts of interest.
Open Research
Data Availability Statement
Data are available in the tables in the manuscript.


