A New UHP-HP Tectono-Metamorphic Architecture for the Southern Dora-Maira Massif Nappe Stack (Western Alps) Based on Petrological and Microstructural Evidence
Funding: Laboratory work was funded by the Italian Ministry of Universities and Research (PRIN2022, Project No. 2022HA8XCS) and by the University of Turin (Ricerca Locale, ex-60% funds: ROLF_RILO_22_01, FERS_RILO_22_03, GROC_RILO_23_01 and TURF_RILO_23_01).
ABSTRACT
The southern Dora-Maira Massif, where coesite was first discovered 40 years ago, is among the most studied and better known example of high/ultra-high-pressure (HP/UHP) terranes. Previous to this study, the Polymetamorphic Basement Complex of the southern Dora-Maira Massif has been defined as a nappe stack consisting of three juxtaposed tectono-metamorphic units: the HP San Chiaffredo Unit at the bottom, the UHP Brossasco-Isasca Unit in the middle and the HP Rocca Solei Unit at the top. The origin of UHP metamorphism in the Brossasco-Isasca Unit is still controversial, due to the difficulties in reconciling the abrupt difference between the UHP conditions recorded by the Brossasco-Isasca Unit (i.e., 700°C–730°C, 4.0–4.3 GPa) and the HP conditions (i.e., ~500°C–520°C, 2.0–2.2 GPa) registered by the adjacent units. Here, we report new petrologic and microstructural evidence supporting the existence of a previously unrecognised UHP unit in the southern Dora-Maira Massif. Our data demonstrate that the tectonic unit overlying the Brossasco-Isasca Unit (i.e., the former Rocca Solei Unit), so far considered a HP unit, is actually divided in two units, one of which (the lowermost Rocca Solei Unit sensu stricto) experienced UHP conditions and the other (the uppermost Grimbassa Unit) reached HP conditions. The newly defined Rocca Solei Unit experienced UHP metamorphism at significantly different P–T conditions (520°C–550°C, 2.7–2.9 GPa) compared to the underlying Brossasco-Isasca Unit, but along a similar ‘cold’ T/P ratio (< 200°C/GPa), markedly lower than that defined in the neighbouring Grimbassa Unit and San Chiaffredo Unit (> 230°C/GPa). After more than 30 years of petrologic investigations, the tectono-metamorphic architecture of the southern Dora-Maira Massif is thus redefined, bridging the gap between the UHP Brossasco-Isasca Unit and the adjacent HP units and opening to new scenarios on its HP–UHP architecture. The results of this study have both regional and petrologic implications: (i) Similarities emerge in the structural position, thickness and metamorphic evolution of the new UHP Rocca Solei Unit in the southern Dora-Maira Massif and those of the Chasterain Unit recently discovered in the northern Dora-Maira Massif, suggesting a common architecture throughout the whole Dora-Maira Massif; (ii) the peculiar quartz microstructure in the metagranites described below represents an exceptional documentation of a ‘frozen’ quartz-to-coesite polymorphic reaction caught in the act and suggests that the availability of fluids was the most crucial factor controlling the progress of the reaction. The metastable persistence of quartz in H2O-undersaturated lithologies makes even more challenging the identification of UHP units that have only slightly exceeded the quartz–coesite transition and justifies why the newly defined UHP Rocca Solei Unit has remained ‘hidden’ for more than 30 years.
1 Introduction
The first discovery of coesite (Chopin 1984) in the continental crust of the small Brossasco-Isasca Unit (BIU) of southern Dora-Maira Massif (DMM), Western Alps, marked a turning point in the geological thinking of subduction zone processes, suggesting that even the relatively light continental crustal rocks can reach mantle depths. Since that discovery, the BIU has been the subject of a high number of studies, aimed at determining its extension and boundaries (e.g., Chopin et al. 1991; Henry et al. 1993; Michard et al. 1993; Compagnoni et al. 2004, 2012), its lithostratigraphy and internal coherence (e.g., Chopin et al. 1991; Compagnoni and Rolfo 2003), its Alpine and pre-Alpine metamorphic evolution (e.g., Hermann 2003; Groppo et al. 2006; Castelli et al. 2007; Groppo et al., 2007b,b) and the age of ultra-high-pressure (UHP) Alpine metamorphism (e.g., Rubatto and Hermann 2001). In a short time, the BIU has become the archetype of continental subducted terranes (Chopin 2003). The peculiar pyrope-bearing whiteschists in which coesite was first discovered have been (and still are) investigated overwhelmingly, with most studies aimed at understanding their microstructures (e.g., Schertl et al. 1991; Lenze and Stockert 2008; Bidgood et al. 2021) and genesis (e.g., Compagnoni and Hirajima 2001; Ferrando et al. 2009; Schertl and Schreyer 2008; Gauthiez-Putallaz et al. 2016; Chen et al. 2017; Harris et al. 2023). Petrological studies also focused on the other lithologies exposed in the BIU, all of which show very peculiar microstructures and record a coherent UHP metamorphic evolution (Kienast et al. 1991; Biino and Compagnoni 1992; Nowlan et al. 2000; Compagnoni and Hirajima 2001; Bruno et al. 2001; Compagnoni and Rolfo 2003; Groppo et al. 2007a). Currently, most geodynamic models that seek to explain the continental subduction processes and the exhumation of crustal rocks from mantle depths are calibrated against this tectonic unit. However, despite all these studies, the interpretation of the BIU in the tectonic framework of the southern DMM and, more generally, of the Western Alps, remains controversial. Two end-member models explaining the origin of UHP metamorphism are invoked (Tajčmanová et al. 2021 and references therein): (i) a purely lithostatic model, which considers the maximum pressures as exclusively dependent on depth, and (ii) an overpressure model, which relates, at least partially, the UHP metamorphism to significant deviations from lithostatic pressures, either at a local or a regional scale. Therefore, understanding the UHP metamorphism in the BIU also inevitably depends on the metamorphic evolution recorded by the adjacent units, which—together with the BIU—define the nappe stack of the southern DMM. In this context, more than 30 years after the seminal papers by Chopin et al. (1991) and Michard et al. (1993), a new impetus in this direction has been given by the recent studies of Groppo et al. (2019), Balestro et al. (2020), Bonnet et al. (2022) and Michard et al. (2022), who have extensively reconstructed the lithostratigraphic and tectonic setting, the metamorphic evolution and the ages of Alpine metamorphism for all the units in the DMM tectonic ‘sandwich’. However, detailed microstructural analysis of rocks even sampled from the best-known areas can still reserve surprises.
Here, we report several petrological evidences that the tectonic unit overlying the BIU (formerly known as Rocca Solei Unit), so far considered as a HP unit, cannot be considered a single unit anymore. Actually, it should be divided in two distinct units, one of which (the lowermost Rocca Solei Unit sensu stricto; RSU) experienced UHP metamorphism at significantly different P–T conditions compared to the underlying BIU and the other (the uppermost unit, hereafter named Grimbassa Unit; GU) reached HP conditions. This study thus unveils a ‘hidden’ UHP slice within the southern DMM nappe stack. The implications of these results on the structural architecture of the whole DMM and on UHP petrology are further discussed.
2 Geological Setting and Samples Location
The DMM is a portion of European crust belonging to the distal sector of the Briançonnais palaeomargin (Schmid et al. 2004; Ballèvre et al. 2020; Michard et al. 2022). The geological setting of the southern portion of the DMM, exposed between the Po and Maira valleys (~20 km south-west from Saluzzo), is described in detail by the recent review of Michard et al. (2022, and references therein), and it is only briefly summarised here. The DMM is a composite nappe stack consisting of several imbricated tectonic units separated by thrust sheets and slivers of Mesozoic metasediments and ophiolites (e.g., Vialon 1966; Michard 1967; Chopin et al. 1991; Compagnoni et al. 1995; Michard et al. 1995; Balestro et al. 2020) (Figure 1). The structurally lowermost unit of the nappe pile, exposed in a tectonic window, is the monometamorphic Pinerolo Unit (PU, or Sanfront-Pinerolo Unit), mostly consisting of Carboniferous graphite-rich metaconglomerates and schists (Manzotti et al. 2016; Nosenzo et al. 2024) metamorphosed under HP blueschist- to eclogite- facies conditions during the Alpine metamorphic cycle (e.g., Avigad et al. 2003; Groppo et al. 2019; Nerone et al. 2023).
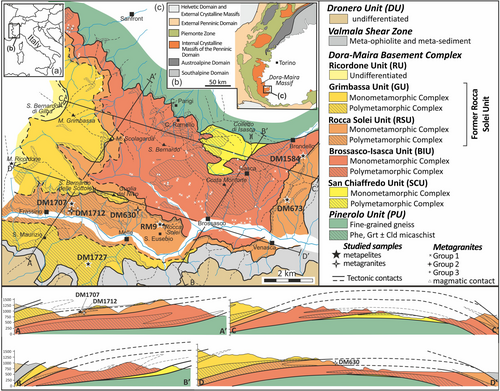
The PU is overlaid by the polymetamorphic Dora-Maira Basement Complex (Michard et al. 2022), which is a portion of Variscan continental crust intruded by Permian igneous bodies, and subducted to eclogite-facies conditions during the Alpine orogenic cycle. Evidence of both amphibolite-facies Variscan metamorphism and Permian contact metamorphism are locally still preserved (e.g., Biino and Compagnoni 1992; Compagnoni et al. 1995; Compagnoni et al. 2012; Compagnoni and Rolfo 2003). The Dora-Maira Basement Complex is further subdivided in a number of tectonic units, which show a similar lithological association but differ for the pressure (P) and temperature (T) conditions experienced during Alpine metamorphism. Before this study, these units were known as (from the bottom to the top): San Chiaffredo Unit (SCU), BIU, RSU and Ricordone Unit (RU) (Figure 1). The BIU experienced UHP peak metamorphic conditions at 700°C–730°C and 4.0–4.3 GPa; these P–T conditions have been independently constrained by different authors (e.g., Hermann 2003; Groppo et al. 2007b, 2019; Castelli et al. 2007; Bonnet et al. 2022) over the years, based on different lithologies (i.e., whiteschists, metapelites, eclogites and marbles) and using different methods (e.g., conventional thermobarometry, experimentally calibrated thermobarometers, multi-equilibrium thermobarometry, forward thermodynamic modelling and trace element thermometry), with results that converged and confirmed the reliability of each individual estimate. Peak conditions of 500°C–520°C, 2.0–2.2 GPa have been estimated for the SCU and RSU units by Groppo et al. (2019) using the forward thermodynamic modelling approach on one sample for each unit; the temperature estimates have been independently confirmed by Bonnet et al. (2022) using the Zr-in-rutile thermometer applied on a larger number of samples (i.e., from 478°C ± 67°C to 567°C ± 23°C using the Tomkins et al. 2007 calibration). Slightly lower peak temperature conditions have been inferred for the RU by the latter authors. Although the tectonic contact between the RSU and RU is easily identifiable in the field being marked by thin and discontinuous slivers of quartzites and marbles, already reported by Henry et al. (1993) and interpreted as slivers of the Mesozoic cover by Michard et al. (2022), the tectonic contacts between the SCU and the BIU and between the BIU and the RSU are poorly recognisable in the field and have been traced based on petrographic and petrological evidence (Chopin et al. 1991; Compagnoni et al. 2004, 2012).
The Dronero Unit (DU) is the uppermost unit of the southern DMM nappe stack; it tectonically overlies the eclogitic units of the Dora-Maira Basement Complex from which it is separated by the hundreds of metres thick Valmala Shear Zone system (Balestro et al. 2020), consisting of tectonically juxtaposed meta-ophiolite and metasediment slices (i.e., the ‘ophiolitiferous band’ of Henry et al. 1993, or Valmala-Piasco Shear Zone of Michard et al. 2022). The DU is characterised by a composite lithostratigraphic succession, consisting of a polymetamorphic basement and of monometamorphic metaintrusives and metasediments (Balestro et al. 2020), and experienced Alpine peak metamorphism under blueschist-facies conditions (Groppo et al. 2019).
In this study, two metagranite and five metapelite samples collected from the eclogitic unit overlying the BIU, and formerly known as RSU, have been investigated in detail. Sample locations are reported in Figure 1; Figure S1 shows the location of other samples from the literature used for the discussion. The two metagranite samples (samples DM630 and DM1712) come from two distinct undeformed bodies, few metres in size, hosting several cm-sized elongated xenoliths and containing large euhedral crystals of K-feldspar, up to few centimetres in length (Figure S2). The contact between the metagranite bodies and the surrounding rocks is not directly visible because it is covered by debris. However, the first outcrop (DM630: Meira Pantoisa, N44°34′23.14″; E7°19′30.58″) is surrounded by pervasively deformed, locally mylonitic augen orthogneisses, whereas the second one (DM1712: Brancia, N44°34′21.86″; E7°17′26.34″) is surrounded by polymetamorphic micaschists hosting small eclogite and marbles lenses and locally preserving the evidence of contact metamorphism (i.e., meta-cornubianites). The five metapelite samples have been collected from small outcrops exposed either along road cuts or along paths in the wood. Two samples come from the southern slope of the Varaita Valley (DM1707: south of S. Claudio, N44°34′26.15″; E7°17′32.06″; RM9: ridge between San Michele and Rocca Solei, N44°34′04.60″; E7°20′11.44″), one comes from the northern slope of the Bronda Valley (DM1584: Cresta dei Fassi ridge, N44°35′41.51″; E7°24′39.48″), one comes from the left side of the Isasca Valley (DM673: C.le Cuniglia, N44°34′35.68″; E7°24′13.91″), and the last sample comes from the northern slope of the Varaita Valley (DM1727: Norastra, N44°33′8.53″; E7°17′59.78″). All these outcrops are characterised by the presence of pluri-mm garnet porphyroblasts, already evident at the hand sample scale; the garnet size appears homogeneous in most of these outcrops, except at C.le Cuniglia (DM673), where garnets occur in two distinct dimensional classes. Chloritoid is evident at the hand sample scale in most of these outcrops, except for Cresta dei Fassi (DM1584). Chloritoid is generally fine-grained, except at Norastra (DM1727), where it is more abundant and coarser grained than garnet. Small, metre-sized, lenses or layers of metabasites (retrogressed eclogites) and marbles are commonly associated with these micaschists.
3 Methods
3.1 Microstructures, Mineral Chemistry and Bulk Rock Compositions
Two metagranites (samples DM1712 and DM630) and five metapelites (samples DM1707, RM9, DM673, DM1584 and DM1727) were studied with both optical microscope and electron microscope. High-resolution multispectral maps were acquired on the whole thin sections (~3 × 1.5 cm) to highlight their main microstructural features. These X-ray maps were obtained using a JEOL IT300LV scanning electron microscope (SEM) at the Department of Earth Sciences, University of Torino, Italy. The instrument is equipped with an Energy 200 energy-dispersive spectrometry (EDS) and an X-Act3 silicon drift detector (Oxford Inca Energy). The operating conditions used for mapping are 15 kV acceleration voltage, process time 1 and 500 ms dwell time. Raw data were processed using MultiSpec software (Purdue Research Foundation) to obtain the modal compositions (Table 1).
| DM1707 | RM9 | DM673 | DM1584 | DM1727 | |
|---|---|---|---|---|---|
| Qz | 28.1 | 32.2 | 14.0 | 67.2 | 49.1 |
| Phe/Ms | 39.6 | 39.1 | 48.1 | 18.3 | 20.1 |
| Pg | 11.3 | 3.6 | 11.9 | 3.7 | 6.1 |
| Grt | 9.6 | 10.0 | 11.7a | 7.1 | 8.3 |
| Cld | 4.8 | 9.0 | 2.5 | 0.1 | 7.7 |
| Ky | — | — | — | < 0.1 | — |
| Chl | 2.9 | 4.3 | 10.0 | 0.5 | 2.9 |
| Bt | 2.7 | — | — | 0.4 | — |
| Ab | — | — | 0.6 | 2.2 | — |
| Ep | — | — | 4.3 | ||
| Rt | 0.3 | 0.7 | 0.3 | 0.3 | 0.5 |
| Ilm | 0.7 | 1.0 | 0.5 | < 0.1 | 0.8 |
| Ttn | — | — | — | — | < 0.1 |
- a GrtPA not included.
The same SEM-EDS instrument was used to perform chemical mapping of representative garnet porphyroblasts and point analyses of the rock-forming minerals in all the samples. The operating conditions for garnet X-ray maps are 15 kV acceleration voltage, process time 1 and 900 ms dwell time. The operating conditions for spot analysis are 15 kV acceleration voltage, 10 mm working distance, process time 2 and 20 s counting time. Quantitative SEM-EDS data were acquired and processed using the Microanalysis Suite Issue 12, INCA Suite version 4.01 (Oxford Inca Energy, UK); natural oxides and silicates standards from Astimex Scientific Limited were used to calibrate the raw data; the ΦρZ correction (Pouchou and Pichoir 1988) was applied. Most analyses were recalculated using NORM computer software (Ulmer 1986); structural formulae were calculated based on 12 oxygens for garnet, 11 oxygens for white mica and biotite, 14 oxygens for chloritoid, 8 oxygens for plagioclase and 28 oxygens for chlorite. Fe3+ in garnet and chloritoid was estimated by stoichiometry. Amphibole group minerals were normalised according to Hawthorne et al. (2012). Mineral chemical analyses of selected minerals for all the samples are reported in Data S1–S7. XMg in chloritoid and biotite is defined as Mg/(Mg + Fe2+). XPrp in garnet is defined as Mg/(Mg + Fe2+ + Mn + Ca), and XSps, XAlm are defined accordingly; XAdr is defined as Fe3+/Al, and XGrs as Ca/(Mg + Fe2+ + Mn + Ca)-XAdr. XAb in feldspars is defined as Na/(Na + K + Ca), and XAn and XOr are defined accordingly. For practical purposes, the term phengite is used in the following to indicate potassic white mica with Si > 3.20 a.p.f.u. (on the basis of 11 oxygens), whereas muscovite is used for potassic white mica with Si < 3.20 a.p.f.u. Mineral abbreviations in the text, figures and tables are from Warr (2021) (with Phe = phengite). For zoned minerals, C, M, R and OR, respectively, refer to core, mantle, rim and outermost rim domains.
Because incomplete mineral equilibration is recorded, the bulk compositions of the five metapelite samples (measured bulk composition, MBC = Bulk 1 in Table 2) used for thermodynamic modelling were calculated at the thin section scale by combining the estimated mineral modes (Table 1) with mineral chemistry and considering the molar volumes of each phase. This procedure allows modelling changes of effective bulk composition (Stüwe 1997) due to mineral fractionation (Evans 2004), particularly when the investigated assemblages include minerals with slow cation diffusion kinetics during growth, such as garnet (e.g., Faryad and Ježek 2019 and references therein).
| DM1707 | RM9 | DM1584 | DM673 | DM1727 | |||||||||||||||||||
|---|---|---|---|---|---|---|---|---|---|---|---|---|---|---|---|---|---|---|---|---|---|---|---|
| Bulk 1 | Bulk 2 | Bulk 3 | Bulk 4 | Bulk 1 | Bulk 2 | Bulk 3 | Bulk 4 | Bulk 1 | Bulk 2 | Bulk 3 | Bulk 4 | Bulk 1 | Bulk 2 | Bulk 3 | Bulk 4 | Bulk 1 | Bulk 2 | Bulk 3 | |||||
| SiO2 | 67.05 | 67.94 | 69.75 | 70.44 | SiO2 | 66.79 | 67.33 | 69.38 | 70.46 | SiO2 | 85.60 | 86.44 | 87.83 | 90.18 | SiO2 | 60.60 | 61.18 | 62.47 | 62.97 | SiO2 | 73.75 | 73.96 | 75.21 |
| TiO2 | 0.92 | 0.95 | 1.02 | 1.05 | TiO2 | 1.59 | 1.62 | 1.76 | 1.83 | TiO2 | 0.37 | 0.38 | 0.39 | 0.41 | TiO2 | 1.21 | 1.24 | 1.33 | 1.37 | TiO2 | 1.15 | 1.16 | 1.21 |
| Al2O3 | 14.31 | 14.32 | 14.32 | 14.32 | Al2O3 | 13.77 | 13.76 | 13.71 | 13.69 | Al2O3 | 6.32 | 6.16 | 5.90 | 5.46 | Al2O3 | 16.58 | 16.66 | 16.83 | 16.89 | Al2O3 | 10.54 | 10.52 | 10.37 |
| Fe2O3 | — | — | — | — | Fe2O3 | — | — | — | — | Fe2O3 | 0.19 | 0.17 | 0.12 | 0.03 | Fe2O3 | — | — | — | — | Fe2O3 | 0.41 | 0.40 | 0.37 |
| FeO | 8.41 | 7.44 | 5.40 | 4.68 | FeO | 10.07 | 9.49 | 7.24 | 6.11 | FeO | 3.70 | 3.15 | 2.20 | 0.58 | FeO | 9.85 | 9.02 | 7.18 | 6.55 | FeO | 7.80 | 7.67 | 6.99 |
| MnO | 0.16 | 0.07 | 0.01 | 0.00 | MnO | 0.09 | 0.05 | 0.00 | 0.00 | MnO | 0.13 | 0.06 | 0.02 | 0.001 | MnO | 0.11 | 0.06 | 0.00 | 0.00 | MnO | 0.16 | 0.14 | 0.09 |
| MgO | 4.39 | 4.44 | 4.42 | 4.37 | MgO | 3.85 | 3.87 | 3.88 | 3.81 | MgO | 1.34 | 1.30 | 1.24 | 0.99 | MgO | 5.92 | 6.00 | 6.06 | 6.11 | MgO | 1.23 | 1.23 | 1.23 |
| CaO | 0.30 | 0.23 | 0.12 | 0.06 | CaO | 0.29 | 0.24 | 0.10 | 0.02 | CaO | 0.30 | 0.23 | 0.13 | 0.07 | CaO | 0.39 | 0.32 | 0.22 | 0.04 | CaO | 2.78 | 2.75 | 2.27 |
| Na2O | 1.13 | 1.17 | 1.26 | 1.29 | Na2O | 0.56 | 0.57 | 0.62 | 0.64 | Na2O | 0.72 | 0.73 | 0.76 | 0.80 | Na2O | 1.18 | 1.22 | 1.31 | 1.34 | Na2O | 0.53 | 0.53 | 0.55 |
| K2O | 3.33 | 3.45 | 3.70 | 3.80 | K2O | 2.99 | 3.05 | 3.31 | 3.44 | K2O | 1.35 | 1.38 | 1.42 | 1.49 | K2O | 4.16 | 4.30 | 4.60 | 4.72 | K2O | 1.64 | 1.65 | 1.72 |
| H2O | — | — | — | 14.50 | H2O | — | — | — | 14.00 | H2O | — | — | — | 4.80 | H2O | — | — | 17.00 | 17.00 | H2O | — | — | — |
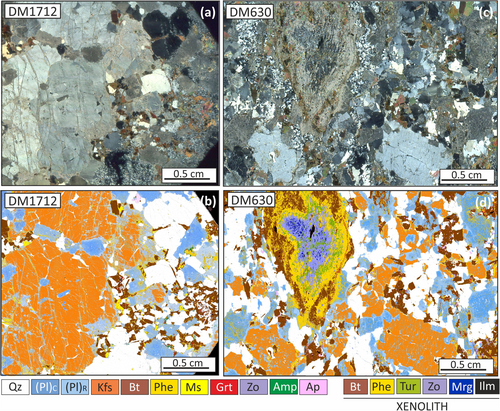
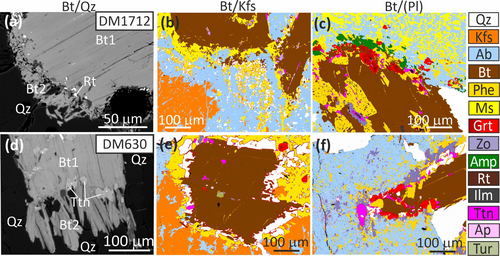
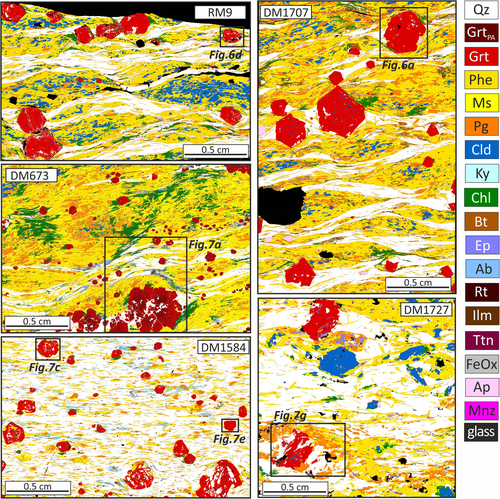
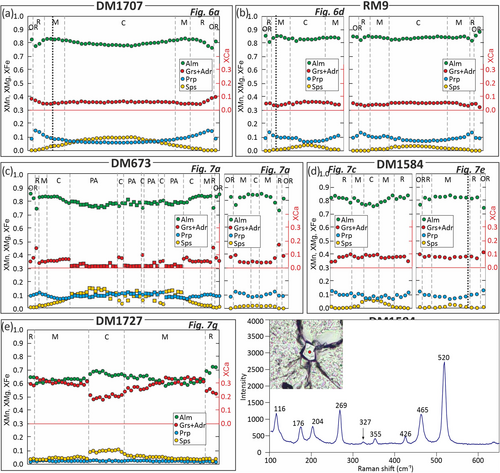
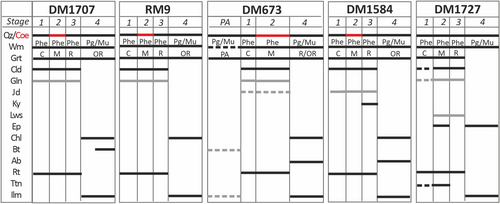
An overview of the metagranite samples at the thin section scale is given in Figure 2; representative microstructures are shown in Figures 3 and 4 and Figures S3 and S4 and mineral chemical results are summarised in Figure S5. For the metapelite samples, the overview at the thin section scale is shown in Figure 5; Figures 6-8 document garnet microstructures and zoning and Figures S6 and S7 report additional microstructural features. Blastesis-deformation diagrams reconstructed for metapelites are shown on Figure 9. Relevant bulk and mineral chemical projection diagrams for studied metapelites are summarised in Figures S8 and S9.
3.2 Raman Micro-Spectroscopy
Raman spectra were acquired using a confocal integrated micro/macro-Raman spectrometer ‘Labram HR800’ (HORIBA Jobin Yvon) of the Interdepartmental Center ‘G. Scansetti’ (Department of Earth Sciences, University of Torino, Italy) with excitation line at 532 nm (solid-state Nd laser) and edge filter. Operating conditions were 80 mW of emission power, slit at 100 μm, hole at 200 μm, grating of 600 grooves/mm, 100× objective, exposure times of 5 × 10 s, D1 attenuation filter at time. The daily calibration has been performed using the 522 cm−1 silicon band.
3.3 Forward Thermodynamic Modelling
The P–T mineral assemblage diagrams (pseudosections) for the five metapelite samples were calculated using Perple_X (Connolly 1990, 2009), Version 7.1.5, and the internally consistent thermodynamic data set from Holland and Powell (2011) (ds6.2). The following solution models have been used: garnet, white mica, biotite, chlorite, chloritoid and staurolite (White et al. 2014); omphacite/jadeite and clino-amphibole (Green et al. 2007, modified as described by Green et al. 2016); epidote (Holland and Powell 2011); carpholite (Smye et al. 2010); ilmenite (White et al. 2000, modified as described by White et al. 2014); and feldspar (Fuhrman and Lindsley 1988). Quartz/coesite, kyanite, rutile and titanite were considered as pure phases. The P–T pseudosections were calculated either in the MnO–Na2O–K2O–CaO–FeO–MgO–Al2O3–SiO2–TiO2–Fe2O3–H2O (MnNKCFMASTOH) system (samples DM1584 and DM1727), as well as in the MnNKCFMASTH system (samples DM1707, RM9 and DM673), according to the observed mineral assemblages and compositions. More specifically, Fe2O3 was included to model samples containing white mica enriched in Fe3+ (i.e., spot analyses plotting above the line of ideal celadonitic substitution in the Si vs. (Fe + Mg) diagrams; Figure S9b) and/or epidote. For these samples, an arbitrary low value of X(Fe3+) = 0.05 was used [X(Fe3+) = Fe3+/Fetotal], which is consistent with metapelites lacking Fe oxides (e.g., White et al. 2014). Fractionation effects on the bulk composition due to the growth of zoned garnet porphyroblasts were considered by calculating four different phase assemblage diagrams for each metapelite sample. Each diagram was used to model the P–T conditions for the growth of (i) garnet core (Bulk 1 = MBC in Table 2), (ii) garnet mantle (Bulk 2 = MBC − GrtC in Table 2), (iii) garnet rim (Bulk 3 = MBC − GrtC − GrtM in Table 2) and (iv) garnet outer rim (Bulk 4 = MBC − GrtC − GrtM − GrtR in Table 2). Details on how the bulk compositions (both unfractionated, Bulk 1 and fractionated, Bulks 2–4) were obtained for all the samples are provided in Data S8–S12.
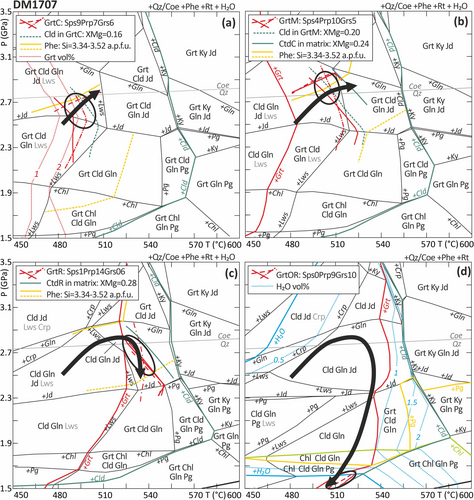
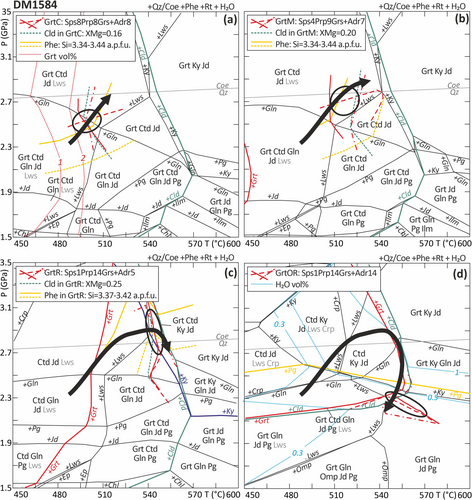
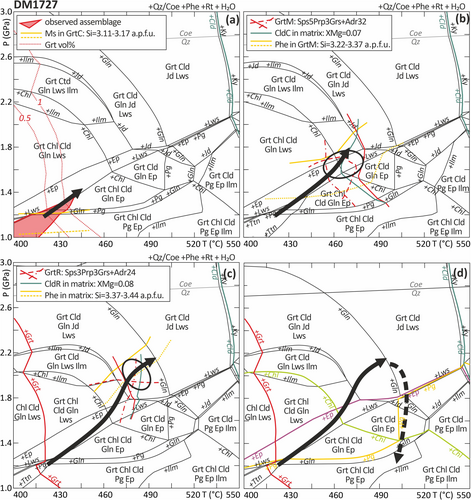
Fluid saturation (pure H2O, EoS of Holland and Powell 1998) was assumed to model the prograde stages of garnet growth (i.e., GrtC, GrtM and GrtR in most samples; GrtC and GrtM for sample DM673; see Figure 9). A fixed H2O amount was, instead, used to model the growth of garnet during exhumation, that is, GrtOR for most samples, GrtR + GrtOR for sample DM673, because rocks are typically H2O undersaturated during exhumation and cooling (e.g., Guiraud et al. 2001; Manzotti et al. 2018, 2022). This fixed amount of H2O was determined such that the proportion of the fluid phase in the system does not exceed 1 vol% at peak T (Thompson and Connolly 1990). The P–T evolution of the modelled samples was constrained by comparing the observed mineral assemblages and compositions with the modelled ones. The phase assemblage diagrams modelled for samples DM1707, DM1584 and DM1727 are reported in Figures 10-12, whereas those modelled for samples RM9 and DM673 are presented in Figures S10 and S11. The whole sets of compositional isopleths modelled for garnet, chloritoid and phengite in samples DM1707, RM9, DM673, DM1584 and DM1727 are reported in Figures S12–S16.
4 Results
4.1 Metagranites
4.1.1 Microstructures and Mineral Chemistry
The two metagranite samples preserve the hypidiomorphic porphyritic fabric of the magmatic protolith, with K-feldspar crystals up to 1–2 cm in size (Figure 2 and Figure S2). The magmatic assemblage consisted of quartz, plagioclase, K-feldspar and biotite in both samples; cordierite was likely present in sample DM1712. Both samples can be classified as monzogranite in the QAPF diagram (sample DM1712: Q = 30, A = 38, p = 32; sample DM630: Q = 41, A = 24, p = 35). Among the magmatic phases, K-feldspar, biotite and quartz are, at least partially, still preserved, whereas plagioclase and cordierite have been completely replaced during the Alpine metamorphism. Coronitic microstructures systematically occur at the contacts biotite-quartz, biotite-K-feldspar and biotite-plagioclase (i.e., the former igneous plagioclase domains).
4.1.1.1 Sample DM1712
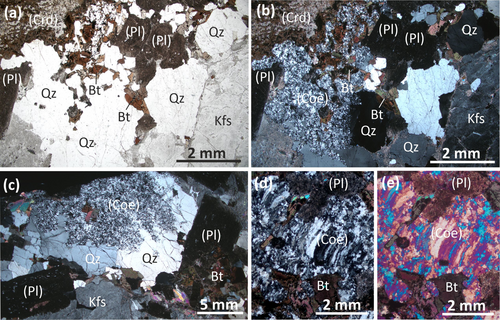
In this sample, K-feldspar forms well-preserved, large (up to 1–2 cm) subhedral perthitic crystals (Or89-94Ab6–11; Figure S4), partially replaced by albite (Ab89-90An6-9Or1–5) at the rim and along fractures (Figure 2b). The original euhedral crystals of plagioclase are completely substituted by fine-grained aggregates of albite/oligoclase (Ab70-97An3-25Or0–10) + muscovite/phengite (Si = 3.18–3.35 a.p.f.u.) ± zoisite; zoisite is generally concentrated in the core of plagioclase crystals, which appear dark and dusty under the microscope (Figure 3a,b and Figure S3a,b). The coarse-grained magmatic quartz is still preserved in some domains, but in others it is replaced by fine-grained polycrystalline aggregates of polygonal quartz (Figures 2a and 3a–c and Figure S3a,b), locally forming palisade microstructures (Figure 3d,e and Figure S3c), similar to those described in UHP metagranites (e.g., BIU: Biino and Compagnoni 1992; Bruno et al. 2001; Tso Morari: Bidgood et al. 2021) and interpreted as derived from the inversion of coesite to quartz. The transition between the two types of quartz (coarse-grained vs. palisade/polygonal) is either inter-granular (Figure 3b and Figure S3e) or intra-granular (Figure 3c and Figure S3d,e). The fine-grained euhedral magmatic biotite is mostly preserved (Figures 2b and 3a and Figure S3a) and only partially replaced by phengite ± very fine-grained rutile (Figure 4c and Figure S4c). Magmatic biotite (Bt1) is strongly zoned, with Ti decreasing and Cl increasing from core (Ti = 0.16–0.21 a.p.f.u.; Cl = 0.00–0.12 a.p.f.u.) to rim (Ti = 0.13–0.17 a.p.f.u.; Cl = 0.10–0.18 a.p.f.u.) (Figure S5), whereas XMg does not show a clear trend (XMg = 0.33–0.37). Phengite replacing Bt1 is generally quite enriched in celadonitic component, with Si = 3.41–3.54 a.p.f.u. (few values lower than Si = 3.40 a.p.f.u.) (Figure S5). Cordierite is pseudomorphically replaced by a fine-grained aggregate of muscovite (Si = 3.12–3.22 a.p.f.u.) and garnet (Figure 3a,b) (see Bidgood et al. 2023 for a similar replacement texture). In these pseudomorphs, garnet is zoned, with XMn decreasing and XMg and XFe increasing from core (GrtC) to rim (GrtR) (GrtC: Alm75-82Sps16–8Prp4-10Grs + Adr1–8; GrtR: Alm78-89Sps9-2Prp8-12Grs + Adr0–5) (Figure S5).
Coronitic microstructures at the contact Bt1-quartz consist of fine-grained biotite (Bt2) ± titanite (Figure 4a and Figure S4a) and are mostly developed along (hk0) faces, where they can reach 30–50 μm in thickness, whereas they are thinner or absent along (100) faces. Bt2 is quite enriched in Cl (Cl = 0.13–0.32 a.p.f.u.) and depleted in Mg (XMg = 0.29–0.37) compared to Bt1, whereas its Ti content is similar to that measured at the rim of Bt1 (Ti = 0.13–0.16 a.p.f.u.) (Figure S5). A composite corona is developed at the contact Bt1-K-feldspar, which is, however, partly obliterated by the static overgrowth of phengite towards Bt1 and of albite towards K-feldspar (Figure 4b). From inside (next to Bt1) to outside (next to K-feldspar), this composite corona consists of (i) a 20–50 μm thick layer of Bt2 + quartz symplectite (Figure S4b) and (ii) a 50–100 μm thick layer of phengite + quartz symplectite (Figure 4b and Figure S4b). Bt2 has the same composition of that developed at the contact Bt1-quartz, whereas phengite has Si = 3.17–3.22 a.p.f.u. (Figure S5). A double-layer composite corona also occurs at the contact Bt1-plagioclase (Figure 4c and Figure S4c), consisting of (i) an inner discontinuous layer of garnet, less than 100 μm thick, and (ii) an outer, more continuous, layer of amphibole, 50–100 μm thick. Garnet is strongly zoned, with XMn and XFe decreasing and XCa increasing from core to rim (GrtC: Alm77-54Sps14-9Prp4-7Grs + Adr6–19; GrtR: Alm72-39Sps8-3Prp3-6Grs + Adr17–51) (Figure S5). Amphibole is a Cl-rich potassic-ferro-pargasite, with Cl in the range 0.88–1.38 a.p.f.u. and relatively high K contents (K = 0.65–0.83 a.p.f.u.).
4.1.1.2 Sample DM630
In this metagranite the porphyritic perthitic K-feldspar (Or92-94Ab6–8; Figure S5) rarely exceeds 1 cm in size and is locally partially replaced by albite at the rim (Figure 2d). The euhedral magmatic plagioclase is completely replaced by a fine-grained aggregate of albite (Ab92-98An2–8) + zoisite + minor phengite (Si = 3.29–3.34 a.p.f.u.; Figure S5) in the core and of albite in the rim, suggesting that the original magmatic crystals were zoned, with a Ca-richer core and a Ca-poorer rim. Most of the coarse-grained magmatic quartz is still preserved, except for quartz surrounding a small elongated xenolith (described below) over a distance of 2 mm from its border. In this domain, the magmatic quartz is replaced by a fine-grained polycrystalline aggregate of polygonal quartz (Figure 2c), whose grain-size is slightly coarser than that described for sample DM1712, but nevertheless orders of magnitude lower than the size of magmatic quartz. The magmatic biotite (Bt1) is mostly preserved (Figure 2d and Figure S3f–i) and slightly zoned, with Ti decreasing from core (Ti = 0.10–0.16 a.p.f.u.) to rim (Ti = 0.08–0.10 a.p.f.u.), whereas XMg and Cl contents are quite homogeneous (XMg = 0.28–0.31; Cl = 0.02–0.04 a.p.f.u.) (Figure S5).
Coronitic microstructures at the contact Bt1-quartz are similar to those described for sample DM1712, that is, they consist of biotite (Bt2) + titanite (Figure 4d and Figure S4d) and are more developed along the (hk0) faces (up to 100–150 μm thick) than along the (001) faces. Bt2 has XMg = 0.30–0.32, Ti = 0.07–0.10 a.p.f.u. and Cl = 0.03–0.04 a.p.f.u. (Figure S5). A double-layer corona occurs at the contact Bt1-K-feldspar (Figure 4e and Figure S4e), up to 100–150 μm-thick, consisting of (i) a Bt2 + quartz symplectite in the inner layer and (ii) a phengite + quartz symplectite in the outer layer. The Bt2 in these microstructures has the same composition as that described for the coronas developed at the contact Bt1-quartz, whereas phengite has Si = 3.24–3.34 a.p.f.u. (Figure S5). Also the contact Bt1-plagioclase is marked by a double-layer corona (Figure 4f and Figure S4f) consisting of (i) a discontinuous, 20–50 μm thick garnet layer towards Bt1 and (ii) a discontinuous, 50–100 μm thick zoisite layer towards plagioclase. Garnet is zoned, with XMn and XFe decreasing and XCa increasing from core to rim (GrtC: Alm75-50Sps12-7Prp4-0Grs + Ad13–43; GrtR: Alm59-44Sps7-3Prp2-0Grs + Adr35–51) (Figure S5).
The small elongated xenolith, few centimetres long, has a concentric layered structure (Figure 2d). The inner portion consists of idioblastic zoisite, tourmaline, ilmenite and interstitial margarite, the latter likely replacing former corundum (e.g., Rosing et al. 1987), which is locally still preserved as relict inclusions within tourmaline. Tourmaline and muscovite (Si = 3.02–3.15 a.p.f.u.) are predominant in the intermediate layer, whereas phengite (Si = 3.26–3.32 a.p.f.u.), biotite and garnet (Alm46-63Sps7-1Prp2-5Grs + Adr31–49) occur in the outer layer.
4.2 Metapelites
4.2.1 Bulk Compositions, Microstructures and Mineral Chemistry
The five metapelite samples are garnet + chloritoid-bearing phengitic micaschists or quartzitic micaschists, which show similar assemblages but different grain size, modal compositions and blastesis-deformation relationships (Figures 5 and 9). Based on the bulk compositions retrieved, all the investigated samples can be classified as high-Al metapelites, plotting in the AFM diagram at A values in the range 20 < A < 40 when projected from muscovite (Figure S8). However, they differ for the amount of CaO, defining two distinct groups (Figure S8): (1) CaO-poor metapelites, plotting in the ACF diagram at C values systematically lower than 3 (C ≤ 3), and (2) CaO-rich metapelites, with C > 5. By converting the bulk compositions in the approximate protolith's mineral modes following the approach described in Groppo et al. (2021) and Tamang et al. (2024) (see Data S13–S17 for details), it emerges that CaO-poor metapelites (Group 1) derive from pure pelites, dominated by quartz, clays, chlorite and detrital feldspars, whereas CaO-rich metapelites (Group 2) derive from calcareous pelites, containing low amounts of carbonates (< 5 vol%) in addition to the other minerals. Samples DM1707, RM9, DM673 and DM1584 belong to Group 1, whereas sample DM1727 belongs to Group 2. Indeed, these apparently slight difference in the bulk compositions and protolith's mineral assemblages significantly influence both the observed mineral assemblages and compositions (e.g., absence vs. presence of lawsonite in the peak assemblages, garnet composition and zoning), as discussed below. Independently from the bulk composition, in all the samples the main schistosity (Sm) is defined by phengite, which is generally concentrated in pluri-mm-thick and continuous layers alternating with continuous mm-thick quartzitic layers; sample DM1584 differs from the others because the phengite is less abundant and forms millimetres thick more or less continuous layers in a quartz-rich matrix (Figure 5), that is, this sample derives from a pelitic protolith enriched in quartz compared to the other samples. Late shear planes occur in samples DM1707, RM9 and DM673, along which muscovite ± chlorite are aligned.
4.2.1.1 Sample DM1707
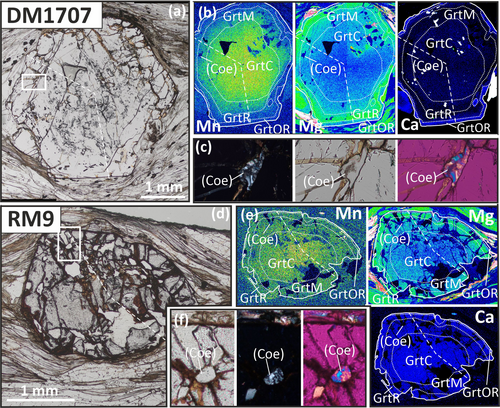
This sample consists of quartz (28.1%), phengite/muscovite (39.6%), paragonite (11.3%), garnet (9.6%), chloritoid (4.8%), minor chlorite (2.9%) and biotite (2.7%) and accessory rutile (0.3%), ilmenite (0.7%), apatite and zircon (Figure 5 and Table 1). Large idioblastic garnet porphyroblasts, up to 5 mm in diameter (Figures 5 and 6a and Figure S6a), are mostly pre-Sm, except for their outermost rims, ~50 μm thick, which appears in equilibrium with Sm. Garnet shows a strong prograde zoning (Figures 6b and 8a), with Sps decreasing and Prp increasing from core (GrtC) to rim (GrtR), except for the outermost rim (GrtOR) where Prp drops down. The Grs + Adr components show a different behaviour, decreasing from GrtC towards garnet mantle (GrtM) and then increasing from GrtR to GrtOR (Figure 8a and Figure S9a). Average compositions of each garnet domain are as follows (whole compositional ranges are reported in Table S1): GrtC: Alm78Sps9Prp7Grs + Adr6, GrtM: Alm81Sps4Prp10Grs + Adr5, GrtR: Alm79Sps1Prp14Grs + Adr6, GrtOR: Alm81Sps0Prp9Grs + Adr10. GrtC and GrtM mostly include quartz, chloritoid, glaucophane (pseudomorphically replaced by fine-grained muscovite and paragonite; Figure S6c), rutile, apatite and zircon, whereas GrtR and GrtOR are generally free of inclusions. Chloritoid inclusions have different compositions in different garnet domains: Chloritoid included in GrtC is Fe-richer (Cld in GrtC: XMg = 0.16–0.17) than that included in GrtM and GrtR (Cld in GrtM: XMg = 0.17–0.20; Cld in GrtR: XMg = 0.20–0.21) (Figure S9c). Polycrystalline inclusions of quartz, ranging in size from 50 μm to 400 μm, and surrounded by radial cracks, locally occur in GrtM (Figure 6c and Figure S6d–f). Generally, the smaller polycrystalline inclusions of quartz have a dusty domain in the centre, surrounded by fine-grained palisade quartz; the dusty domain apparently has a slightly higher relief than the surrounding quartz, but micro-Raman analyses do not show any diagnostic peak of coesite, although 15 thin sections from the same sample have been made in order to accurately search for its relict presence. Nevertheless, these polycrystalline quartz inclusions have been interpreted as pseudomorphs after former coesite.
In the matrix, chloritoid occurs as mm-sized blasts aligned with the Sm (Figure 5 and Figure S6b); it is slightly zoned, with XMg increasing towards the rim (CldC: XMg = 0.22–0.28; CldR: XMg = 0.26–0.29). (Figure S9c). A thin and discontinuous outer rim with XMg = 0.22–0.23 is locally observed. Phengite defines the Sm; it is zoned, with Si contents varying from 3.52 a.p.f.u. in the core to 3.34 a.p.f.u. in the rim (Figure S9b). Prismatic to lozenge-shaped pseudomorphs after mm-sized glaucophane (Figure S6b) are quite abundant and are aligned with the Sm; they consist of a fine-grained aggregate of muscovite (Si = 3.09–3.18 a.p.f.u.; Figure S9b), biotite, chlorite and quartz. Paragonite and chlorite are post-kinematic, forming large flakes that statically overgrow the Sm (Figure 5). Finally, biotite also partly overgrows the chlorite rim along the Sm.
4.2.1.2 Sample RM9
This micaschist consists of quartz (32.2%), phengite/muscovite (39.1%), garnet (10.0%), chloritoid (9.0%), paragonite (3.6%), chlorite (4.3%) and accessory rutile (0.7%), ilmenite (1.0%) and apatite (Figure 5 and Table 1). Idioblastic garnet porphyroblasts, up to 3–4 mm large, are mostly pre-kinematic with respect to Sm, with the garnet outermost rim that is in equilibrium with phengite defining the Sm (Figures 5 and 6d and Figure S6g). Garnet is zoned (Figures 6e and 8b), with a prograde zoning pattern similar to that described for sample DM1707, but with different absolute values (Figure 8b and Figure S9a); the outermost garnet rim (GrtOR) is very thin (< 10 μm) and discontinuous. Average compositions of each garnet domain are as follows (whole compositional ranges are reported in Table S1): GrtC: Alm84Sps3Prp7Grs + Adr6, GrtM: Alm84Sps1Prp10Grs + Adr5, GrtR: Alm83Sps0Prp13Grs + Adr4, GrtOR: Alm86Sps0Prp10Grs + Adr4. Quartz, chloritoid and rutile are the most abundant inclusions in GrtC, GrtM and GrtR, where they mostly form monomineralic inclusions; minor pseudomorphs after glaucophane now consisting of fine-grained muscovite + paragonite (Figure S6h) are included in GrtC and GrtM. Chloritoid included in GrtC is Fe-richer (Cld in GrtC: XMg = 0.14) than that included in GrtM (Cld in GrtM: XMg = 0.15–0.20) and GrtR (Cld in GrtR: XMg = 0.19–0.22) (Figure S9c). Small polycrystalline inclusions of quartz with the same features described for sample DM1707 locally occur in the GrtM domain (Figure 6f and Figure S6i) and have been interpreted as pseudomorphs after coesite.
In the matrix, chloritoid is concentrated in the micaceous layers and occurs as slightly zoned mm-sized blast (Figure 5 and Figure S6g), with XMg increasing towards the rim (CldC: XMg = 0.18–0.23; CldR: XMg = 0.21–0.24) (Figure S9c). Phengite defining the Sm is zoned, with Si = 3.59–3.40 a.p.f.u., decreasing from core to rim (Figure S9b), paragonite occurs as flakes statically overgrowing the Sm (Figure 5), and muscovite (Si = 3.00–3.12 a.p.f.u.) is a retrograde phase mostly developed along the late shear bands. Chlorite forms post-kinematic flakes, and replaces garnet preferentially along fractures. Fe-oxides also develop along garnet fractures (Figure 5).
4.2.1.3 Sample DM673
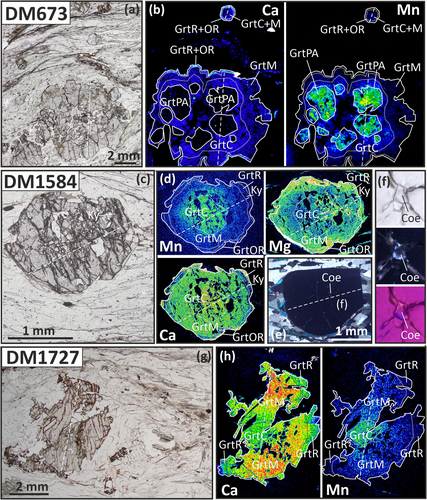
This sample consists of quartz (14.0%), phengite/muscovite (48.1%), paragonite (11.9%), garnet (11.7%), chloritoid (2.5%), chlorite (10.0%), minor albite (0.6%) and accessory rutile (0.3%), ilmenite (0.5%) and apatite (Figure 5 and Table 1). It differs from the other samples for the presence of two distinct garnet generations (i.e., pre-Alpine vs. Alpine garnets). The pre-Alpine garnet (GrtPA) is preserved as corroded millimetric relics within large porphyroblasts of Alpine garnets, up to 7–8 mm in diameter, which possibly derive from the aggregation and coalescence of several small idioblasts, up to 1 mm in size (Figures 5 and 7a and Figure S7a). The Alpine garnet is also found as small (up to 500 μm in diameter) idioblasts isolated in the matrix (Figure 7a), whose rim and outermost rim grew statically after the Sm. The GrtPA is slightly zoned, with Sps and Prp decreasing and Alm increasing towards the rim (GrtPA: Alm76–79Sps12–8Prp8-10Grs + Adr2–4), whereas Alpine garnet is strongly zoned, with abrupt transition from the (GrtC + GrtM) domain to the (GrtR + GrtOR) domain, marked by pronounced increasing of the Grs + Adr component (Figure 7b) and decreasing Alm (Figure 8c and Figure S9a). Average compositions of each Alpine garnet domain are as follows (whole compositional ranges are reported in Table S1): GrtC: Alm81Sps5Prp8Grs + Adr6, GrtM: Alm82Sps2Prp11Grs + Adr5, GrtR: Alm74Sps0Prp9Grs + Adr17, GrtOR: Alm85Sps0Prp9Grs + Adr6. GrtPA mostly includes quartz and elongated aggregates of rutile likely pseudomorphs after former ilmenite. Chloritoid, quartz and rutile are the most frequent inclusions in the Alpine GrtC and GrtM, with XMg of chloritoid increasing from GrtC (Cld in GrtC: XMg = 0.17–0.18) to GrtM (Cld in GrtM: XMg = 0.20) (Figure S9c). Few phengite flakes (Si = 3.50–3.54 a.p.f.u.; Figure S9b) and fine-grained aggregates of albite ± paragonite likely pseudomorphs after jadeite and/or glaucophane are locally included in GrtM. Few small inclusions of polycrystalline quartz interpreted as pseudomorphous after coesite are included in GrtM (Figure S7c).
In the matrix, chloritoid forms up to few millimetres long (Figure 5 and Figure S7b), slightly zoned porphyroblasts (CldC: XMg = 0.22–0.24; CldR: XMg = 0.20–0.21) (Figure S9c), partially replaced by paragonite and muscovite at their rims. Zoned phengite with Si = 3.55–3.41 a.p.f.u. decreasing from core to rim defines the Sm (Figure S9b), whereas muscovite is concentrated along late shear bands, together with chlorite and albite. Paragonite and chlorite occur as sub-mm flakes statically overgrowing the Sm (Figure 5).
4.2.1.4 Sample DM1584
This sample is a quartzitic micaschist consisting of quartz (67.2%), phengite/muscovite (18.3%), garnet (7.1%), paragonite (3.7%), minor chloritoid (0.1%), chlorite (0.5%), biotite (0.4%) and albite (2.2%), very rare kyanite (< 0.1%) and accessory rutile (0.3%), ilmenite (< 0.1%) and apatite (Figure 5 and Table 1). Garnet is very variable in size, with the largest poikiloblasts reaching 3–4 mm in diameter (Figure S7d) and the smallest ones barely exceeding 1 mm (Figure 7c and Figure S7d). Independently from the size, garnet shows marked prograde zoning (Figures 7d and 8d), with Sps decreasing and Prp increasing from GrtC to GrtR; a thin (25–50 μm) and discontinuous GrtOR is characterised by an abrupt increase in Grs + Adr (Figure 7d), counterbalanced by a decrease in Alm (Figure 8d and Figure S9a). Average compositions of each garnet domain are as follows (whole compositional ranges are reported in Table S1): GrtC: Alm76Sps8Prp8Grs + Adr8, GrtM: Alm80Sps4Prp9Grs + Adr7, GrtR: Alm80Sps1Prp14Grs + Adr5, GrtOR: Alm71Sps1Prp14Grs + Adr14. GrtC and GrtM mostly include quartz, chloritoid (Cld in GrtC: XMg = 0.14–0.17; Cld in GrtM: XMg = 0.17–0.22; Figure S9c), rutile and minor fine-grained aggregates of muscovite + paragonite ± pyrophyllite likely pseudomorphous after jadeite (Figure S7e). Although most of the quartz included in GrtM is monomineralic and coarse grained, few polycrystalline inclusions of quartz surrounded by radial cracks locally occur within this garnet domain (Figure 7e and Figure S7f); in the middle of one of such inclusions, a coesite relict—confirmed through micro-Raman spectroscopy (Figure 8f)—surrounded by palisade quartz has been observed (Figure 7f). Garnet rim includes chloritoid (Cld in GrtR: XMg = 0.24–0.25), pseudomorphs after jadeite, minor phengite (Si = 3.37–3.42 a.p.f.u.; Figure S9b), rutile and very rare kyanite (Figure 7c), whereas the thin GrtOR is almost free of inclusions.
Both chloritoid and kyanite are absent from the matrix. Phengite defining the Sm is zoned with Si = 3.44 a.p.f.u. in the core and Si = 3.34 a.p.f.u. in the rim (Figure S9b); paragonite occurs as large flakes overgrowing the Sm (Figure 5) and, together with muscovite (Si = 3.06–3.13 a.p.f.u.) and albite ± pyrophyllite also forms large (up to 1–2 mm in length) fine-grained pseudomorphic aggregates after former jadeite (Figure S7g). Chlorite is scarce and mostly replaces garnet along fractures.
4.2.1.5 Sample DM1727
This micaschist consists of quartz (49.1%), phengite/muscovite (20.1%), garnet (8.3%), chloritoid (7.7%), paragonite (6.1%), epidote (4.3%), minor chlorite (2.9%) and accessory rutile (0.5%), ilmenite (0.8%), titanite (< 0.1%) and apatite (Figure 5 and Table 1). Garnet porphyroblasts, up to 5 mm in diameter, are mostly syn-kinematic with respect to the Sm (Figures 5 and 7g) and are strongly zoned, with a zoning pattern significantly different from that of the other samples (Figures 7h and 8e). Sps decreases towards the rim defining a pronounced bell shape, whereas Prp is almost flat; Grs + Adr increases from core to mantle and then decreases towards the rim (Figure 8e and Figure S9a). Average compositions of each garnet domain are as follows (whole compositional ranges are reported in Table S1): GrtC: Alm67Sps11Prp2Grs + Adr20, GrtM: Alm61Sps5Prp3Grs + Adr32, GrtR: Alm70Sps3Prp3Grs + Adr24. The volumetrically minor GrtC is almost free of inclusions except for few muscovite flakes (Si = 3.11–3.17 a.p.f.u.; Figure S9b). GrtM includes monocrystalline inclusions of quartz, chloritoid (Cld in GrtM: XMg = 0.07–0.08), elongated epidote, phengite (Si = 3.22–3.37 a.p.f.u.; Figure S9b), rutile and rare titanite, as well as different types of polycrystalline inclusions consisting of fine-grained aggregates of (i) epidote + paragonite ± muscovite and (ii) paragonite ± albite ± chlorite. These polycrystalline inclusions can be interpreted as pseudomorphs after lawsonite and glaucophane, respectively. GrtR mostly includes quartz and rutile.
The main foliation Sm, defined by phengite (Si = 3.44–3.37 a.p.f.u., decreasing from core to rim; Figure S9b), wraps around large porphyroblasts of Fe-rich chloritoid up to 3–4 mm in size (Figure 5 and Figure S7h) with a relatively homogeneous composition (XMg = 0.07–0.08; Figure S9c) and pluri-mm pseudomorphs after lawsonite consisting of a fine-grained aggregate of paragonite, epidote and minor phengite (Figure 5 and Figure S7i). Prismatic or lozenge-shaped pseudomorphs after glaucophane, up to 1 mm in size, are aligned with Sm and consist of fine-grained chlorite, muscovite and quartz (Figure S7j).
4.2.2 Thermodynamic Modelling
The P–T evolution of the five metapelites has been reconstructed using the forward thermodynamic modelling approach. For most samples, three prograde stages have been recognised (i.e., stages 1, 2 and 3; Figure 9), corresponding to the growth of GrtC, GrtM and GrtR domains; a later exhumation stage (i.e., stage 4) is further testified by the static, syn- to post-Sm, growth of GrtOR, paragonite, muscovite and chlorite. Sample DM673 differs from the others because both GrtR and GrtOR are related to the exhumation stage (i.e., stage 4; Figure 9), whereas in sample DM1727 garnet did not grow after decompression (i.e., the GrtOR domain is absent; Figure 9). The P–T conditions of each metamorphic stage have been constrained based on (i) the predicted stability field of the observed mineral assemblages and (ii) the intersection of compositional isopleths modelled for garnet, chloritoid and phengite and corresponding to the measured average compositions for garnet and chloritoid and to the observed whole compositional range for phengite. The fractionation effects on the bulk rock compositions due to the growth of the strongly zoned garnet porphyroblasts are significant in all the samples.
The phase assemblage diagrams modelled for Group 1 (i.e., CaO-poor) samples show similar topologies (Figures 10 and 11 and Figures S10 and S11). Among the Al-rich phases, chlorite is stable at p < 2.0 GPa, whereas garnet is stable over a large P–T interval; the stability of chloritoid and kyanite is temperature dependent, with the first predicted at T < 540°C–570°C and the second at T > 540°C–570°C. Paragonite, glaucophane and jadeite are the Na-bearing phases stable at low, medium and high pressure, respectively. Ca is mostly stored in lawsonite at low temperatures and in garnet at higher temperatures; however, given the very low amount of CaO in the bulk composition, the predicted mode of lawsonite is always negligible (i.e., < 1 vol%). The phase assemblage diagram calculated for sample DM1727—which belongs to Group 2 (i.e., CaO-rich sample)—shows a significantly different topology (Figure 11), mostly related to the stability of Ca-rich phases. Lawsonite and epidote are, in fact, predicted to be stable over almost the entire P–T range of interest, with lawsonite stable at higher P compared to epidote. Chloritoid is stable at T < 540°C–570°C, whereas kyanite appears at higher temperatures. Na-bearing phases show the same distribution as described for Group 1 samples. For all the samples, the Grt-in curve modelled for the unfractionated bulk composition is predicted at T slightly lower than 450°C, that is, 30°C–50°C lower than the P–T conditions estimated for the growth of GrtC (see below). This discrepancy can be related to temperature overstepping of garnet nucleation, that is, to a delayed nucleation of garnet due to kinetic factors. However, it is to be noted that—for all the samples—the growth of GrtC is predicted at P–T conditions roughly overlapping with the modelled 1 vol% isomode, suggesting the alternative explanation that the apparently delayed garnet nucleation could reflect the attainment of the 1 vol% threshold of garnet abundance, below which garnet is not readily detected in thin section (Nagurney et al. 2021; Tamang et al. 2023).
The results of the modelling are here described in detail only for samples DM1707 and DM1584 from Group 1 and DM1727 from Group 2, whereas those of the other samples from Group 1 (RM9 and DM673) are presented in the Supplementary Material, because they display a P–T evolution very similar to that of sample DM1707.
4.2.2.1 Sample DM1707
This sample records first equilibration during stage 1 at 480°C–500°C, 2.5–2.8 GPa, within the Qz + Phe + Grt + Cld + Gln ± Jd ( + Lws) + Rt + H2O assemblage field (Figure 10a), as testified by the compositions of GrtC (Alm78Sps9Prp7Grs + Adr6) and of its inclusions of chloritoid (Cld in GrtC: XMg = 0.16). Stage 2 equilibration is recorded at 500°C–515°C, 2.7–3.0 GPa, within the Qz/Coe + Phe + Grt + Cld + Gln + Jd (+ Lws) + Rt + H2O assemblage field (Figure 10b), using compositions of GrtM (Alm81Sps4Prp10Grs + Adr5) and chloritoid (Cld in GrtM: XMg = 0.21; CldC in matrix: XMg = 0.24). Afterwards, stage 3 equilibration occurred at 520°C–540°C, 2.5–2.8 GPa, within the Qz/Coe + Phe + Grt + Cld + Gln + Jd + Rt + H2O assemblage field (Figure 10c), considering compositions of GrtR (Alm79Sps1Prp14Grs + Adr6) and chloritoid (CldR in matrix: XMg = 0.28). The modelled assemblages are consistent with those observed; notably, GrtM is predicted to grow close to the quartz-coesite transition, consistently with the occurrence of coesite pseudomorphs in that garnet domain. A very low amount (< 3 vol%) of jadeite is predicted to be stable during the prograde stages although it was not observed in the studied sample. The modelled phengite isopleths corresponding to the whole range of measured compositions (Si = 3.34–3.52 a.p.f.u.) are fully consistent with the inferred P–T conditions.
P–T conditions for the exhumation stage 4 have been constrained using composition of GrtOR (Alm81Sps0Prp9Grs + Adr10) at 500°C–520°C, 1.5–1.6 GPa, within the Qz + Phe + Grt + Chl + Gln + Pg assemblage field (Figure 10d), that is, at slightly H2O-undersaturated conditions. The first appearance of chlorite, paragonite and garnet during exhumation is predicted at 1.8, 1.7 and 1.6 GPa, respectively, in agreement with their static growth over Sm.
4.2.2.2 Sample DM1584
The P–T trajectory reconstructed for this sample has the same shape as those of the previous samples but it is shifted towards slightly higher temperatures. Prograde stages 1–3 are respectively constrained at (1) 490°C–500°C, 2.4–2.6 GPa, within the Qz + Phe + Grt + Cld + Gln + Jd (+ Lws) + Rt + H2O assemblage field (Figure 11a), using compositions of GrtC (Alm76Sps8Prp8Grs + Adr8) and of its inclusions of chloritoid (Cld in GrtC: XMg = 0.16); (2) 510°C–525°C, 2.6–2.8 GPa, within the Qz/Coe + Phe + Grt + Cld + Jd ( + Lws) + Rt + H2O assemblage field (Figure 11b), using compositions of GrtM (Alm80Sps4Prp9Grs + Adr7) and chloritoid (Cld in GrtM: XMg = 0.20); and, (3) 540°C–550°C, 2.7–3.1 GPa, within the Qz/Coe + Phe + Grt + Cld + Ky + Jd + Rt + H2O assemblage field (Figure 11c), using compositions of GrtR (Alm80Sps1Prp14Grs + Adr5) and chloritoid (Cld in GrtR: XMg = 0.25). The results of the modelling are consistent with the occurrence of (i) coesite in GrtM, which is predicted to be stable in the coesite stability field, and (ii) kyanite in GrtR. The modelled phengite isopleths suggest that phengite with the highest Si contents (i.e., up to Si = 3.44 a.p.f.u.) grew during the early prograde stages 1 and 2, whereas that with lower Si contents grew during stage 3.
The modelled composition of GrtOR (Alm71Sps1Prp14Grs + Adr14) allows constraining the P–T conditions for the exhumation stage 4 at 540°C–570°C, 2.1–2.3 GPa, within the Qz + Phe + Grt + Gln + Jd + Pg + Rt + H2O assemblage field (Figure 11d). These conditions almost coincide with the first appearance of paragonite and garnet during exhumation, in agreement with their static growth over Sm.
4.2.2.3 Sample DM1727
P–T conditions for the prograde stages 1 to 3 are respectively constrained at (1) 400°C–440°C, 1.0–1.4 GPa, within the Qz + Phe + Grt + Chl + Cld + Pg + Ep + Ttn + Rt + H2O assemblage field (Figure 12a), which corresponds to the observed assemblage in equilibrium with GrtC; (2) 450°C–470°C, 1.5–1.8 GPa, within the Qz + Phe + Grt + Chl + Cld + Gln + Lws + Rt + H2O assemblage field (Figure 12b), using compositions of GrtM (Alm61Sps5Prp3Grs + Adr32) and chloritoid (CldC in matrix: XMg = 0.07); and (3) 470°C–490°C, 1.9–2.1 GPa, within the Qz + Phe + Grt + Cld + Gln + Jd + Lws + Rt + H2O assemblage field (Figure 12c), using compositions of GrtR (Alm70Sps3Prp3Grs + Adr24) and chloritoid (CldR in matrix: XMg = 0.08). Compositional isopleths modelled for GrtC do not perfectly match with the measured composition (i.e., the modelled GrtC is richer in Mn and poorer in Ca with respect to the observed one); however, the observed assemblage in equilibrium with GrtC (i.e., chloritoid + epidote + titanite + rutile) is well reproduced by the modelling. The modelled assemblages in equilibrium with GrtM and GrtR are consistent with those observed and the modelled phengite isopleths corresponding to the whole range of measured compositions (Si = 3.22–3.37 a.p.f.u.) are fully consistent with the inferred P–T conditions.
P–T conditions for the exhumation stage 4 are poorly constrained (Figure 12d), as GrtOR is apparently missing in this sample. Replacement of lawsonite by epidote + paragonite is predicted to occur during decompression at ~1.8 GPa.
5 Discussion
5.1 A New UHP Unit in the Southern DMM
- A preserved coesite relic, surrounded by fine-grained palisade quartz, is included in GrtM from sample DM1584 (Figures 7e,f and 8f), providing direct evidence that GrtM grew in the coesite stability field.
- Polygonal/palisade inclusions of quartz surrounded by radial cracks occur in the other metapelite samples (DM673, DM1707 and RM9; Figure 6c,f, Figure S6d,e,f and Figure S7c,fl) in the same microstructural position as in the sample DM1584 (i.e., in GrtM domains). These inclusions have been interpreted as derived from the coesite to quartz inversion, in line with previous interpretations (e.g., Mosenfelder and Bohlen 1997; Lenze and Stockert 2008; Bidgood et al. 2021).
- The fine-grained polycrystalline aggregates of polygonal quartz, locally with palisade microstructure, developed at the expenses of coarse-grained magmatic quartz in the metagranites' matrix (Figure 3 and Figure S3) resemble those described in UHP metagranites from the adjacent BIU (Biino and Compagnoni 1992; Compagnoni et al. 1995; Bruno et al. 2001; Compagnoni and Rolfo 2003), as well as from other UHP terranes (e.g., Tso Morari; Bidgood et al. 2021), and interpreted as derived from the inversion of former coesite. The lack of deformation of the metagranites allows excluding that the fine-grained aggregates of polygonal/palisade quartz derive from deformation-induced recrystallisation of the coarse-grained magmatic quartz. A quantitative crystallographic investigation was out of the scope of this work, but the observation of palisade quartz using the first-order red plate allows recognising different sub-domains in which the palisade quartz grains have single crystal orientation (Figure 3d,e); adjacent sub-domains are misorientated with respect to each other by an un-quantified, yet qualitatively appreciable, angle. These features have been recently recognised as reliable criteria to identify coesite to quartz transition (Bidgood et al. 2021). For these reasons, the observed microstructures have been interpreted as indirect evidence of the former occurrence of coesite in the metagranites' matrix.
- The results of the forward thermodynamic modelling applied on metapelite samples DM1707, RM9, DM673 and DM1584 all agree in predicting the growth of GrtM domains within the coesite stability field, confirming the petrographic observations, that is, the occurrence of coesite and/or its pseudomorphs in that garnet domain.
Among the investigated metapelites, sample DM1727 differs from the others because it does not show any petrographic or petrologic evidence of having reached UHP conditions during its metamorphic evolution. Neither coesite nor polygonal/palisade quartz inclusions have been observed within garnet porphyroblasts; and the thermodynamic modelling results constrain peak metamorphism at P–T conditions well below the quartz to coesite transition.
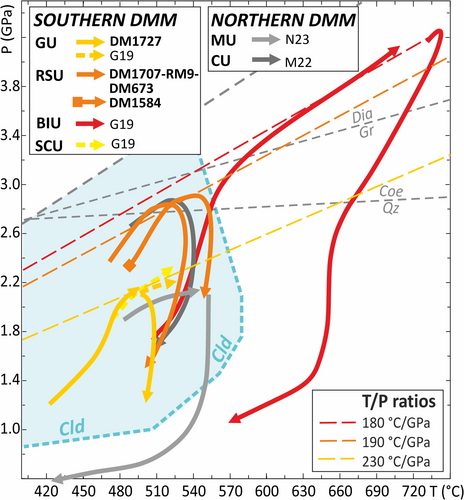
- The P–T evolution reconstructed for the structurally lowermost unit (samples DM1707, RM9 and DM673) consists of a prograde increase in both P and T from 480°C–500°C, 2.4–2.6 GPa to UHP peak-P conditions of 500°C–520°C, 2.7–2.9 GPa, followed by an early heating decompression up to peak-T conditions of 520°C–540°C, 2.5–2.9 GPa and then by cooling decompression to 520°C–530°C, 1.5–1.6 GPa (Figure 13). Slightly higher peak-T conditions (540°C–550°C, 2.7–3.1 GPa) are registered by sample DM1584 (Figure 13), which crops out at the base of this unit, very close to the tectonic contact with the lowermost BIU. This slight difference in peak-T conditions could be related to different physical and compositional/chemical factors, such as (i) thermal perturbation caused by shear heating next to tectonic contacts (e.g., Mako and Caddick 2018) or (ii) aH2O < 1 that may shift mineral equilibria in the P–T space (e.g., Guiraud et al. 2001; Tursi et al. 2021; Schorn 2022; Nerone et al. 2023). The importance of these factors is difficult to quantify and goes behind the scope of this paper. Because the top of the modest relief called Rocca Solei is located within this unit, the name Rocca Solei Unit sensu stricto (RSU) is here applied to designate this ‘new’ UHP unit. It should be noted that, although the name remains the same, the newly defined RSU differs from that mentioned in the previous literature for the P–T conditions of the metamorphic peak, which are actually at UHP conditions and not at HP conditions as previously estimated.
- The structurally uppermost unit (sample DM1727) followed a P–T trajectory which is similar in shape to that reconstructed for the underlying (re-defined) RSU, but shifted towards lower T and P conditions (Figure 13), with a prograde increase in both P and T from 400°C–440°C, 1.0–1.4 GPa up to peak conditions of 470°C–480°C, 1.9–2.0 GPa. This P–T evolution is consistent with that reconstructed by Groppo et al. (2019) for the metapelite sample DM1504 (peak conditions at 510°C–520°C, 2.0–2.3 GPa). Actually, the sample DM1504 crops out at the base of the newly defined HP unit, ~5 km northwards. This HP unit is named Grimbassa Unit (GU), after the name of its highest peak (i.e., Monte Grimbassa, 1619 m a.s.l.).
5.2 Defining the Boundaries of the New UHP RSU
Lithological features do not help to separate the new UHP RSU from the overlying GU; both these units, in fact, are part of the polymetamorphic Dora-Maira Basement Complex and, and therefore consist of polymetamorphic lithologies (i.e., the Polymetamorphic Complex; Figure 1) intruded by granitoids (i.e., the Monometamorphic Complex; Figure 1). Petrographic and chemical features suggest that, in both units, the Polymetamorphic Complex derives from a sedimentary succession originally composed of pure pelites with interleaved calcareous pelites and minor marls and calcareous rocks, now respectively transformed into Ca-poor metapelites, Ca-rich metapelites, mica-rich metabasites and impure marbles. In both units, the Monometamorphic Complex mostly consists of variably deformed orthogneisses hosting scattered bodied of undeformed metagranites. The relationships between the metagranites and the orthogneisses are the same described for the well-known Brossasco metagranite of the UHP BIU (Biino and Compagnoni 1992; Michard et al. 1995), that is, due to the strain partitioning, the undeformed metagranite bodies escaped the Alpine deformation, which was instead pervasive and/or locally concentrated into discrete shear zones in the surrounding orthogneisses. Due to the striking similarities in the lithological associations of these units, defining the boundaries of the newly defined UHP RSU is not straightforward, as it relies on the recognition of quite ephemeral microstructures that are rarely preserved either as inclusions in garnet porphyroblasts of the metapelites or in the small volumes of undeformed metagranites. In addition to the new data presented in this study, the following information from the literature has been used to pinpoint the lowermost and uppermost boundaries of the RSU, respectively separating it from the BIU below and from the GU above: (i) thermobarometric constraints, (ii) the occurrence of the garnet + chloritoid + kyanite assemblage in metapelites and (iii) the microstructures of quartz in metagranites. These three points are summarised in Tables S2 and S3 and discussed below; locations of the corresponding samples are reported in Figures S1.
5.2.1 Thermobarometric Constraints
A selection of peak P–T conditions estimated for the tectono-metamorphic units forming the nappe stack of the Dora-Maira Basement Complex in the southern DMM (i.e., SCU, BIU, RSU and GU) is reported in Table S2 and Figure S1. The data have been selected according to the following strategy: (i) estimates obtained using modern thermobarometric approaches (e.g., forward thermodynamic modelling, multi-equilibrium thermobarometry and trace elements thermometry) have been preferred over those inferred from conventional thermobarometry; (ii) if available, data from different lithologies have been selected.
For the UHP BIU, peak P–T conditions have been defined in the last decades using a large variety of lithologies, including pyrope-bearing whiteschists, eclogites, marbles and garnet + kyanite-bearing phengitic micaschists. Whereas peak-T have been constrained at T ≈ 730°C since the early studies, peak-P conditions were initially estimated at ~3.0–3.5 GPa (e.g. Compagnoni and Rolfo 2003; Compagnoni et al. 2004) and were successively refined at 4.0–4.3 GPa (Ferrando et al. 2017; Groppo et al. 2019 and reference therein) following the progressive improvement of thermobarometric approaches that are able to overcome the limits of conventional thermobarometry. Overall, these peak P–T conditions define a thermobaric ratio (Brown 2023) in the range of 170°C–183°C/GPa.
Modern petrologic studies on the tectono-metamorphic units adjacent to the BIU are substantially limited to Groppo et al. (2019) and Bonnet et al. (2022). In both these studies, the unit overlying the BIU was considered as a HP unit and its peak P–T conditions were defined at 500°C–520°C, 2.0–2.4 GPa by Groppo et al. (2019) based on only one sample (DM1504); as these P–T conditions are comparable with those estimated in this study for the GU, we locate sample DM1504 in this unit. Bonnet et al. (2022) provided Zr-in-Rt temperatures for five samples (four metapelites and one eclogite), obtained using two different calibrations (Kohn 2020; Tomkins et al. 2007). The calibration by Kohn (2020) yielded temperatures systematically lower than that of Tomkins et al. (2007) and less consistent with literature data; therefore, the authors themselves suggested that values obtained with the earlier calibration are more reliable. Out of the five samples investigated by Bonnet et al. (2022), the four metapelites gave average peak-T lower than ~530°C (i.e., from 478°C ± 67°C to 534°C ± 34°C). Notably, one of these samples (DM19b-42), which comes from the same locality of sample DM1504, returned T = 527°C ± 23°C, which is equivalent, within the uncertainties, to the estimate of Groppo et al. (2019), whereas the two samples yielding the lowest temperatures do not contain garnet. Instead, the fifth sample studied by Bonnet et al. (2022), that is, the eclogite DM-19-34a1, gave a slightly higher peak-T of 567°C ± 23°C, which is in line with the temperatures here estimated for the newly defined RSU. Bonnet et al. (2022) considered their results as a proxy of the peak T, although the Zr-in-Rt thermometry does not necessarily provides the maximum T reached by a sample. However, aware of the limitations of this approach, we have used their Zr-in-Rt data to help drawing the boundary between the RSU and the overlying GU, being other thermobarometric constraints not available at this stage. Accordingly, the four metapelite samples returning average Zr-in-Rt temperatures ≤ 530°C have been located in the GU, whereas the eclogite sample giving T > 560°C has been placed in the new UHP RSU unit. Based on these and our new data, the thermobaric ratios defined by the two units are, respectively, in the range of 188°C–189°C/GPa for the RSU and 229°C–232°C/GPa for the GU (Table S2).
5.2.2 The Assemblage Garnet + Chloritoid + Kyanite in Metapelites
The occurrence of kyanite vs. chloritoid in garnet-bearing phengitic micaschists has been traditionally considered an additional petrologic criterion to distinguish the metapelites of the UHP BIU from those of the adjacent HP units, respectively (e.g., Chopin et al. 1991; Compagnoni and Rolfo 2003; Compagnoni et al. 2012). The garnet + chloritoid association, in fact, is stable at T < 540°C–600°C, whereas at higher temperatures, this assemblage is replaced by garnet + kyanite; at the transition between the stability fields of the two assemblages, garnet, chloritoid and kyanite can coexist in a narrow temperature interval (T = 540°C–600°C; Vuichard and Ballèvre 1988; Proyer 2003; Wei and Powell 2006; Smye et al. 2010). Although this criterion is still valid for locating the boundary between the newly defined UHP RSU and the underlying BIU, it is much less helpful for defining the contact between the new RSU and the overlying GU, because chloritoid is widespread in the peak assemblages of both units. Instead, although not common, the garnet + chloritoid + kyanite assemblage is diagnostic for discriminating between the new RSU and the GU, because its stability field is compatible with the peak-T conditions estimated for the new RSU (520°C–550°C), but not with those inferred for the GU (470°C–520°C). Beside sample DM1584 investigated in this study, this assemblage was reported by Henry (1990) in two metapelites from the left side of the Varaita Valley (Figure S1; samples 87DM248b and 87DM260), providing additional useful clues for placing the contact between the new RSU and the GU.
5.2.3 Quartz Microstructure in Metagranites
- In Group 1, all the igneous quartz is pseudomorphically replaced by polygonal quartz after coesite (Figure S17a); metagranites from this group are additionally characterised by the systematic occurrence of garnet-bearing coronitic structures developed at the contact between the former magmatic biotite and the original quartz, plagioclase and K-feldspar (Biino and Compagnoni 1992; Bruno et al. 2001). These metagranites belong to the UHP BIU.
- In Group 2, the original magmatic quartz is preserved in some domains, whereas in others it is replaced by polygonal or palisade quartz, especially around biotite-bearing xenoliths (Figure S17b); in these metagranites, coronitic microstructures are less developed, and they do not systematically contain garnet (see above). Metagranites from this group belong to the newly defined UHP RSU;
- In metagranites from Group 3, the original coarse-grained magmatic quartz is always preserved, even in the proximity of biotite-bearing xenoliths (Figure S17c); these metagranites lack coronitic microstructures and belong to the HP GU or SCU.
5.3 Regional Implications
Based on the results discussed above, the tectono-metamorphic architecture of the southern DMM needs to be revised, adding a UHP unit (i.e., the newly defined RSU) to the nappe stack of the Dora-Maira Basement Complex. This new UHP unit, tectonically interposed between the BIU below and the GU above, experienced peak metamorphism at P–T conditions significantly different from those of the BIU (ΔT > 150 °C; ΔP > 1.5 GPa), although the thermobaric ratios (T/P) of the two units are consistently lower than 200°C/GPa (170°C–190°C/GPa for the BIU; ~190°C/GPa for the new RSU; Figure 12). On the opposite, the difference in peak-T registered by the new RSU and the GU is less pronounced (ΔT ≈ 50°C), and the two units mostly differ for the peak-P (ΔP ≈ 0.7 GPa), and consequently for the thermobaric ratio, which is systematically higher than 200 °C/GPa in the GU (i.e., ~230°C/GPa; Figure 12). A T/P ratio similar to that of the GU also characterises the lowermost unit of the nappe stack, that is, the SCU (Table S2). The several cross sections reconstructed in the studied area (Figure S1) allow defining a lens-shaped geometry for all the units, with maximum thickness ranging from about 1 km in the BIU and the GU to less than 500 m for the new RSU and the SCU.
The structural architecture here re-defined for the southern DMM shows striking similarities with that recently described in the northern portion of the Massif. There, Manzotti et al. (2022) discovered a new UHP Unit, the Chasterain Unit (CU), whose structural position and P–T evolution appear very similar to those of the newly defined RSU. The CU, which is few tens of metre thick, is structurally sandwiched between the PU below and the Muret Unit (MU) above. Peak P–T conditions for the CU and the MU have been respectively estimated at 510°C–530°C, 2.7–2.8 GPa (i.e., T/P ratio of 190°C/GPa; Manzotti et al. 2022; Figure 12) and 530°C–560°C, 2.1–2.2 GPa (i.e., T/P ratio of 250°C/GPa; Nosenzo et al. 2023; Figure 12), thus suggesting that the CU and the MU could be the northern equivalents of the new RSU and GU, respectively.
The overall picture emerging from the comparison between the northern and the southern sectors of the DMM is that the Dora-Maira Basement Complex, derived from a lithologically heterogeneous Variscan basement intruded by granitoids, now consists of several juxtaposed lens-shaped slices that experienced different Alpine peak P–T conditions. The P–T evolution recorded by these slices reflect subduction at different T/P ratios, with the UHP units (BIU, CU and RSU) subducted along colder T/P ratios (i.e., ≤ 200°C/GPa) compared to the HP units (i.e., ≥ 230°C/GPa). From a geodynamic perspective, these results suggest that the subduction regime responsible for the re-equilibration of the BIU at UHP, once considered as an exception in the framework of the DMM, could have been, instead, a more common feature than previously supposed.
The consistent alignment along the same T/P ratio of different fragments of the subducted crust is generally mentioned as a strong reason supporting a pure lithostatic model vs. the overpressure model (e.g., Agard 2021 and references therein). The discovery of two new UHP units (i.e., the CU and the new RSU) aligned along a T/P ratio similar to that of the BIU, thus seems to exclude a significant contribution of tectonic overpressure to the origin of UHP metamorphism in the DMM. A further evidence is that, in both the BIU and the new RSU, the UHP conditions are homogeneously recorded by different rocks types with contrasting rheological behaviour, that is, weak, phyllosilicate-rich (micaschists) and strong, quartz–feldsphatic (metagranites) lithologies (Froitzheim 2020). On the other hand, the small volumes of the UHP slices and the very high exhumation rates so far determined at least for the BIU (Rubatto and Hermann 2001) are still difficult to reconcile with a pure lithostatic model.
5.4 Petrologic Implications: The Quartz-to-Coesite Transition Caught in the Act
In the southern DMM, the occurrence of granoblastic polygonal quartz aggregates pseudomorphous after the former igneous quartz crystals has been traditionally considered as robust petrologic criterion to distinguish metagranites belonging to the UHP BIU from those of the adjacent HP units (e.g., Compagnoni and Rolfo 2003; Compagnoni et al. 2012). In the metagranites investigated in this study, the observed microstructures are transitional between those described for the UHP metagranites (i.e., all the magmatic quartz is replaced by polycrystalline aggregates of quartz) and those described for the HP ones (i.e., all the magmatic quartz is still preserved). In fact, the coarse-grained igneous quartz is preserved in some domains, but in others it is replaced by fine-grained aggregates of polygonal and/or palisade quartz interpreted as derived from the inversion of former coesite (see before; Figure 3 and Figure S3). This interpretation implies that, during UHP metamorphism, the replacement of magmatic quartz by coesite was not complete and stimulates further discussion about the factor(s) that can either favour or inhibit the prograde coesite nucleation and growth.
Previous studies demonstrated that the kinetic of the polymorphic quartz-coesite transition is very fast (e.g., Mosenfelder and Bohlen 1997; Zinn, Hinze, et al. 1997; Zinn, Lauterjung, et al. 1997) and that the prograde quartz-to-coesite transformation is one order of magnitude faster than the retrograde coesite-to-quartz transformation, with experimentally determined growth rates of about 2.1 × 10⁻¹⁶ m/s at 550°C, 3.1 GPa (Perrillat et al. 2003). Therefore, one should expect that the prograde quartz-to-coesite transformation is rapidly achieved once suitable P–T conditions are reached; instead, the observed microstructures show that this was not the case. The following microstructural features suggest that the availability of fluids could have been the most crucial factor controlling the progress of the reaction: (i) The polygonal/palisade quartz aggregates systematically occur around biotite-bearing xenoliths, over a distance of few millimetres from their borders, and (ii) the transition between the two types of quartz (magmatic coarse-grained vs. palisade/polycrystalline replacing former coesite) resembles a reaction front, being independent from the location of the grain boundaries, that is, it is both inter- and intra-granular. These evidences thus suggest that the driving-force for the quartz-to-coesite transition could have been the presence of fluids, derived from prograde devolatilisation reactions within the xenoliths; the progress of the quartz-to-coesite reaction was controlled by the distance over which fluids were able to penetrate within the surrounding metagranite and, in the absence of fluids, the magmatic quartz remained metastable. To our knowledge, the peculiar microstructures, here described for the studied metagranites, have never been reported so far and represent an exceptional documentation of a ‘frozen’ polymorphic reaction caught in the act. Further quantitative microstructural and crystallographic studies could provide additional constraints on the nature of the quartz-to-coesite transition.
6 Conclusions
This study redefines the tectono-metamorphic architecture of the Polymetamorphic Basement Complex of the southern DMM. The existence of a ‘new’ UHP slice, that is, the Rocca Solei Unit sensu stricto (RSU)—tectonically interposed between the BIU below and the GU above—is testified by the following microstructural and petrologic evidences: (i) In the micaschists, the garnet mantle domains include either preserved coesite relics or polygonal/palisade inclusions of quartz surrounded by radial cracks, interpreted as derived from the coesite to quartz inversion; (ii) the results of the forward thermodynamic modelling applied on these micaschists consistently predict the growth of the garnet mantle domain within the coesite stability field; (iii) the metagranites contain fine-grained polycrystalline aggregates of polygonal quartz, locally with palisade microstructure, interpreted as indirect evidence of the former occurrence of coesite in the metagranites' matrix.
The newly defined RSU experienced UHP metamorphism at significantly different P–T conditions (520°C–550°C, 2.7–3.1 GPa) compared to the underlying BIU, but along a similar T/P ratio (< 200°C/GPa), markedly lower than that defined in the neighbouring GU (> 230°C/GPa). The similarities between the structural position, thickness and metamorphic evolution of the newly defined UHP RSU with those of the recently discovered CU in the northern DMM suggest that the structural architecture is similar in the whole DMM.
Further petrologic implications of this study arise from the peculiar quartz microstructure observed in the metagranites, which testifies that the prograde quartz-to-coesite polymorphic transformation was not completely achieved. Based on microstructural evidence, we suggest that the availability of fluids was the most crucial factor controlling the progress of the reaction and that, in the absence of fluids, the magmatic quartz remained metastable.
Acknowledgements
The samples investigated in this study have been collected by Serena Botta (DM1712, DM1707, DM1727), Roberto Montani (RM9), Robertino Turello (DM630, DM673) and Chiara Groppo (DM1584) in the framework of their MSc Thesis. We gratefully acknowledge Roberto Compagnoni, Takao Hirajima, Robertino Turello, Christian Chopin, Caroline Henry, André Michard, Hans-Peter Schertl and many others for their valuable contribution to the field mapping and petrologic investigation of the southern DMM over the years. Christian Chopin generously provided a copy of the mineral chemical data from the Henry's PhD thesis; he also provided the precise location of samples 87DM248b and 87DM260, which was fundamental for placing the boundaries of the new UHP RSU. Paola Manzotti and Michel Ballèvre shared with us their ideas on the geology of the DMM in the course of inspiring discussions. We thank P. Manzotti for her inspiring and constructive comments, an anonymous reviewer for the very detailed review, as well as B. Cesare and R.W. White for editorial handling, all of which significantly improved this work. Open access publishing facilitated by Universita degli Studi di Torino, as part of the Wiley - CRUI-CARE agreement.
Open Research
Data Availability Statement
The data that support the findings of this study are available in the Supporting Information of this article.


