UHP metamorphism recorded by phengite eclogite from the Caledonides of northern Sweden: P–T path and tectonic implications
Abstract
The Seve Nappe Complex (SNC) of the Scandinavian Caledonides records a well-documented history of high pressure (HP) and ultra-high pressure (UHP) metamorphism. Eclogites of the SNC occur in two areas in Sweden, namely Jämtland and Norrbotten. The Jämtland eclogites and associated rocks are well-studied and provide evidence for late Ordovician UHP metamorphism, whereas the Norrbotten eclogites, formed during the late Cambrian (Furongian)/Early Ordovician, have not been studied in such detail, especially in terms of the P–T conditions of their formation. Within the studied eclogite, clinopyroxene contains a high-Na core and two rims: inner, medium-Na and outer, low-Na. Garnet consists of a high-Ca euhedral core, low-Ca inner rim and medium-Ca outer rim. A similar pattern occurs within phengite, where high-Si cores are enveloped by medium and low-Si rims. The compositions of the mineral cores, inner rims and outer rims reflect three stages in the metamorphic evolution of the eclogite. Applied Quartz-in-Garnet geobarometry, coupled with Zr-in-rutile geothermometry reveal that garnet nucleation (E0 stage) took place at 1.5–1.6 GPa and 620–660°C. The eclogite peak-pressure assemblage developed during the E1 stage, it consists of garnet+omphacite+phengite+rutile+coesite? and yields P–T conditions of 2.8–3.1 GPa and 660–780°C as constrained by conventional geothermobarometry and thermodynamic modelling in the NCKFMMnASHT system. Later, lower-pressure stages E2 and E3 record conditions of 2.2–2.8 GPa, 680–780°C and 2.1 GPa, 735°C, respectively. The prograde metamorphic evolution of the eclogite is inferred from inclusions of epidote, amphibole and clinopyroxene within garnet. The presence of amphibole–quartz–plagioclase symplectites, secondary epidote/zoisite and titanite replacing rutile record the later retrograde changes taking place at <1.5 GPa (referred as E4 stage). The obtained P–T conditions indicate that the Norrbotten eclogites underwent a metamorphic evolution characterized by a clockwise P–T path with peak metamorphism reaching up to coesite stability field within a relatively cold subduction regime (7.8°C/km). The obtained results provide the first evidence for UHP metamorphism in the SNC above the Arctic Circle and document cold subduction regime and multistage exhumation of the deeply subducted Baltican margin at early stage of the Caledonian Orogeny.
1 INTRODUCTION
Subduction zone dynamics and exhumation mechanisms have been a recurring matter of discussion since evidence for ultra-deep subduction of a continental crust (e.g. discoveries of coesite and microdiamond) has been reported from an increasing number of localities within different orogenic belts (Gilotti, 2013 and references therein). Eclogites, despite the fact that they are a minor constituent of high pressure (HP) and ultra-high pressure (UHP) terranes in orogenic belts, provide insight into the evolution of deeply and ultra-deeply subducted rock units. The specific mineralogy of these rocks provides ideal conditions for preserving information about their burial to depths greater than 100–150 km, whereas the record of deep subduction in the surrounding country rocks is commonly obliterated during exhumation or was never achieved due to impeded equilibration beyond ~high-P amphibolite facies (e.g. Young & Kylander-Clark, 2015).
Within the Scandinavian Caledonides, eclogite occurrence was first reported by Eskola (1921) in the Western Gneiss Region i.e. an area consisting of deeply subducted Baltica basement and incorporated allochthons (e.g. Cuthbert, Carswell, Krogh Ravna, & Wain, 2000). There the record of UHP metamorphism has been undoubtedly demonstrated via discoveries of coesite (e.g. Smith, 1984), microdiamond (e.g. Dobrzhinetskaya et al., 1995), majoritic garnet (e.g. van Roermund & Drury, 1998) and extensive geothermobarometric calculations (e.g. Terry, Robinson, & Krogh Ravna, 2000). Eclogites have been also found within the Seve Nappe Complex (SNC; e.g. van Roermund, 1985; Zwart, 1974) belonging to the upper part of the Middle Allochthon, representing the subducted outermost passive margin (e.g. Gee, Janák, Majka, Robinson, & van Roermund, 2013). Recent studies which have revealed the UHP metamorphism within the SNC have been focused on Jämtland localities (Figure 1) but no recent work has been conducted to constrain P–T conditions farther north in Norrbotten.
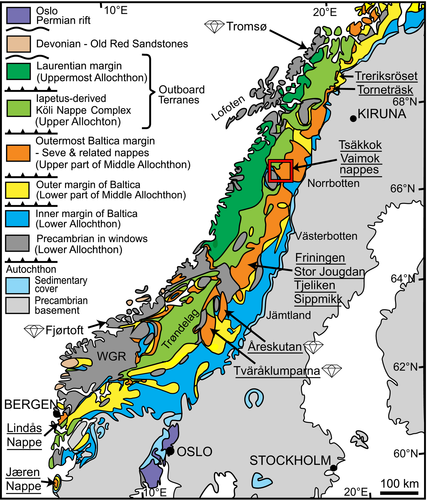
The main goal of our study was to define maximum P–T conditions of the Norrbotten's SNC eclogites and to corroborate previously speculated UHP conditions of their formation (e.g. Albrecht, 2000 and references therein). Outcome of the estimated P–T (1) provides insight for regional-scale reconstructions of the subduction regime along the orogen, (2) helps to answer the question if the Baltica passive margin, presently represented by SNC thrust sheets, underwent metamorphism under similar metamorphic conditions (e.g. Klonowska, Janák, Majka, Froitzheim, & Kośmińska, 2016), (3) constrain the thermal regime of the subduction zone at early stages of the Iapetus Ocean closure, and (4) unravels the issue of multistage exhumation recorded by the Vaimok eclogites.
Here, we present P–T estimates obtained using a multi-method approach combining (1) conventional geothermobarometry, (2) elastic geobarometry (QuiG, Quartz-in-Garnet; Kohn, 2014), (3) trace-element geothermometry (Zr-in-rutile; e.g. Tomkins, Powell, & Ellis, 2007) and (4) phase equilibrium thermodynamic modelling. Thanks to such approach, it was possible to unravel the complex P–T evolution of the Norrbotten eclogites, including garnet nucleation, peak metamorphism and multi-stage exhumation. Additionally, we report for the first time evidence for UHP metamorphism within the Vaimok lens of the SNC, verifying previous speculations in this matter.
2 GEOLOGICAL SETTING
The NE-SW trending Scandinavian Caledonides represent a Himalayan-type collisional orogen which resulted from the closure of the Iapetus Ocean in the Ordovician and subsequent collision between Laurentia and Baltica in the Silurian (e.g. Gee, 1975a; Gee et al., 2013; Dallmeyer & Gee, 1986). The Caledonides exposed in Scandinavia are built of far-travelled allochthonous units (e.g. Gee, 1978) that were thrust onto the autochthonous Baltic Shield and represent a complete succession containing Baltica, Iapetus and Laurentia-derived terranes (Gee, 1975b; Gee et al., 2013; Stephens & Gee, 1985; Figure 1). In particular, the SNC of the Middle Allochthon represents the outer rifted passive margin of Baltica (Andréasson, 1994; Andréasson, Svenningsen, & Albrecht, 1998; Gee, 1975a; van Roermund, 1982), which formed during opening of the Iapetus Ocean (Svenningsen, 2001).
The SNC is exposed over ~1,000 km along the strike of the Scandinavian Caledonides (Andréasson, 1994; Zachrisson, 1973). Gee (1975a), and Dallmeyer and Gee (1986), based on the eclogite discovery by Zwart (1974), concluded that subduction of the Baltica rifted outer margin to mantle depths operated beneath an outboard volcanic arc termed the Virisen Island Arc (now a part of the Köli Nappe Complex of the Upper Allochton).
While multiple studies have documented HP conditions within the SNC (e.g. Albrecht, 2000; Kullerud, Stephens, & Zachrisson, 1990; Nicholson, 1984; Santallier, 1988; Stephens & van Roermund, 1984) it was only recently discovered that the SNC experienced UHP metamorphism. The latter was documented in eclogites and ultramafic rocks of northern Jämtland (Brueckner, van Roermund, & Pearson, 2004; Gilio, Clos, & van Romermund, 2015; Janák, van Roermund, Majka, & Gee, 2013; Klonowska et al., 2016; Majka, Janák, et al., 2014) and in metasedimentary rocks of west-central Jämtland (Klonowska, Majka, Janák, Gee, & Ladenberger, 2014; Klonowska et al., 2017; Majka, Rosén, et al., 2014). UHP metamorphism was constrained in west-central Jämtland to >445 Ma via Th–U–Pb monazite geochronology (Klonowska et al., 2017; Majka et al., 2012). These geochronological results are comparable to those constraining the timing of peak metamorphism in northern Jämtland to c. 460–458 Ma via Sm–Nd and Lu–Hf garnet geochronometers applied to eclogites and ultramafic rocks and via ion microprobe U–Pb dating of zircon from eclogite host-rocks (Andersson, 2015; Brueckner & van Roermund, 2007; Fassmer, Klonowska, et al., 2017). A slightly younger estimate of peak metamorphism at c. 446 Ma was provided by U–Pb zircon TIMS method (Root & Corfu, 2012).
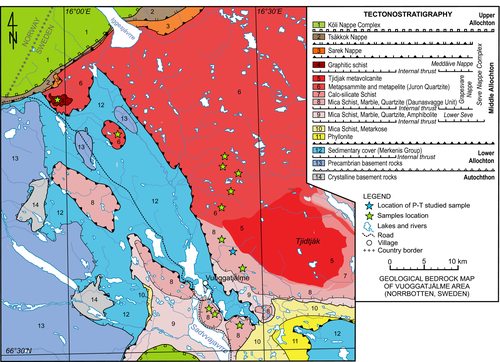
Some 200 km north of northern Jämtland, in Norrbotten, the SNC is subdivided into three tectonic lenses, namely Vaimok, Sarek and Tsäkkok (from bottom to top, respectively; Figure 2). The Vaimok lens (area discussed in this paper) is subsequently divided to the eclogite-absent Lower Seve Nappe, and the eclogite-bearing Grapesvare and Maddåive nappes (Figure 2). Eclogites have been described from both the Grapesvare and Maddåive nappes (A. Wikström pers. comm. to D. Gee in Andréasson, Gee, & Sukotji, 1985; Nordgren, 1987) and P–T conditions of their formation were constrained approximately to 1.5 GPa and 610°C in the Tsäkkok lens (Stephens & van Roermund, 1984) and to 1.85–1.95 GPa (Santallier, 1988) and 2.0–2.7 GPa (Albrecht, 2000) at 690–730°C in the Vaimok lens. While these results indicate the potential for metamorphism nearing the coesite stability field, these pressure estimates could not be confirmed with confidence due to the large temperature dependence of the Fe–Mg garnet–omphacite thermometry which was utilized for the calculations. Since the comprehensive study of Albrecht (2000), no work has been done in this region to more accurately constrain the P–T evolution of the Grapesvare and Maddåive nappes. Instead, studies investigating the timing rather than conditions of metamorphism in Norrbotten (in particular the Grapesvare Nappe) have been the subject of debate. Dallmeyer and Gee (1986) reported 491 ± 8 Ma 40Ar/39Ar cooling ages of hornblende from retrogressed eclogite boudins, which were corroborated by a 503 ± 14 Ma peak metamorphic age obtained using Sm–Nd geochronology on garnet from eclogite (Mørk, Kullerud, & Stabel, 1988). However, Essex, Gromet, Andreasson, and Albrecht (1997) published c. 500–475 Ma U–Pb dates of titanite from calc-silicate rocks hosting eclogite, and interpreted these dates to represent prograde metamorphism. Most recent TIMS U–Pb zircon dating of fresh eclogite yielded a date of 482 ± 1 Ma (Root & Corfu, 2012), which was concluded to reflect the peak metamorphism age. Also, the latter authors suggested that the previous Sm–Nd results were overestimated due to incomplete equilibration of two garnet growth events. Nonetheless, the youngest age estimates of eclogite-facies metamorphism in Norrbotten are still considerably older than the age of peak metamorphism in Jämtland.
In summary, the P–T–t evolution of the SNC in Norrbotten is significantly understudied, in contrast to the detailed work that has been conducted in recent years in the SNC exposures farther to the southwest. Undoubtedly, constraining the P–T–t evolution is crucial to our understanding of subduction dynamics of the SNC along the entire length of the Scandinavian Caledonides.
3 SAMPLE DESCRIPTIONS
3.1 Petrography
For this study, 56 eclogite samples were collected from both the Maddåive and Grapesvare nappes (Figure 2) of which 19 samples were chosen for further petrological studies. These metamafic rocks were obtained from numerous lenses (former dolerite dykes) concordant to the main foliation of highly deformed metasedimentary host rocks that recorded exhumation of the SNC from eclogite-facies conditions (see also Albrecht, 2000). These lenses preserve a broad range of lithological varieties, from amphibolite facies metagabbros and metadolerites to eclogites that are usually highly altered due to retrogressive recrystallization (e.g. Albrecht, 2000). Rare, fresh eclogites occur within large boudins (>5 m in diameter) and display only minor alteration limited to the scarce veinlets composed of amphibole-rich assemblage. The peak metamorphic assemblage consists of garnet+omphacite+phengite+rutile+quartz/coesite. Common accessory minerals recognized within both fresh and altered parts of eclogites are apatite, zircon and rarely ilmenite. The least altered sample CB16-NB-16, collected from the lowermost part of the Grapesvare Nappe i.e. Daunasvagge Unit (dominated by garnet-bearing mica schists, quartzites and marbles), NW of Vuoggatjålme village and SW of Tjidtjak Mountain (66.60452N, 16.39169E; Figure 2), was chosen for the P–T estimates.
3.2 Methods
Mineral chemistry was determined using WDS analyses performed in two laboratories: (1) Jeol JXA8530F Hyperprobe Field Emission Electron Probe Microanalyser at the Department of Earth Sciences, Uppsala University, Sweden, and (2) Jeol Superprobe electron microprobe at the Faculty of Geology, Geophysics and Environment Protection, AGH—University of Science and Technology (AGH-UST) in Kraków, Poland. The Hyperprobe instrument at Uppsala University was used to collect X-ray concentration maps of Na, Al, K, Fe, Mg, Mn, Ca, Si, Ti, Ba, P, Cr of garnet and phengite, whereas the Superprobe machine at AGH-UST was also used for mapping of Al, K, Ca, Fe, Mg, Si, Mn, Ti abundance in garnet and phengite.
μRaman spectroscopy was used to analyse quartz inclusions in garnet. Analyses were performed using a Horiba spectrometer LabRAM HR 800 with an Olympus BX41 light microscope at the Department of Geological Sciences, Stockholm University, Sweden and at the Earth Science Institute, Slovak Academy of Sciences, Banská Bystrica, Slovakia.
The bulk composition of the eclogite was analysed with a LiBO2/Li2B4O7 fusion followed by XRF at the Bureau Veritas Mineral Laboratories in Canada. More detailed information about the analytical conditions is provided in Appendix S1.
All mineral abbreviations correspond to those in Whitney and Evans (2010).
3.3 Mineral chemistry
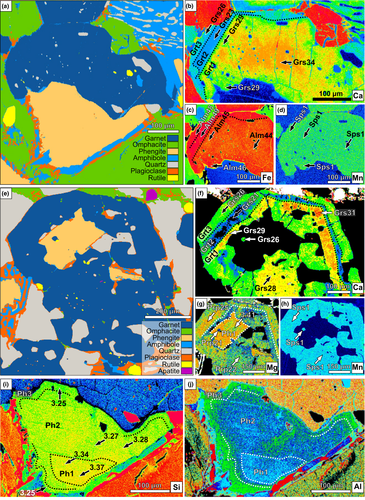
Garnet is the most abundant mineral in the eclogite (~42 vol.%) forming three different textural types. The predominant textural type, hereafter referred to as “regular garnet”, forms euhedral to subhedral porphyroblasts containing numerous inclusions. Small (<30 μm) quartz and less frequently omphacite, amphibole, zoisite, zircon and plagioclase inclusions are limited to the inner parts of grains, whereas rutile and apatite inclusions occur within whole garnet volume (Figure 3a). This garnet displays zoning from Alm41-45Grs29-34Prp20-23Sps1 (Grt1—representing metamorphic stage E1; see Section 5) in the core to Alm49-50Grs22-23Prp26-27Sps1 (Grt2—reflecting metamorphic stage E2) in the inner rim to Alm47-49Grs25-26Prp25-26Sps1 (Grt3—referring to metamorphic stage E3) in the outer rim (Figure 3b). Chemical zoning of regular garnet is well-marked by Ca and Fe distributions (Figure 3b,c), whereas the Mn is constant throughout the entire grain (Figure 3d). Some grains texturally exhibit a lobe-like outermost rim with extreme Ca-enrichment, up to 61 mol.% of grossular (referred to E4 stage; Table 1; Figure 4a,b). Subhedral healed atoll garnet, containing large phengite and quartz inclusions (Figure 3e), belongs to the second textural variety. Less frequently, it contains inclusions of omphacite, amphibole, phengite, apatite, plagioclase and rutile (Figure 4c). Similar to regular garnet, inclusions are concentrated in the core, whereas inner and outer rims are inclusions-free. The atoll garnet also reveals distinctive chemical zoning patters (Figure 3f–h). The core (Grt1—representing E1 stage) composition varies from Alm49-51Grs26-28Prp22-24Sps1 to Alm47Grs31Prp21Sps1. The inner rim (Grt2—reflecting E2 stage) has a composition of Alm51-52Grs21-22Prp24-25Sps1 and the outer rim (Grt3—referring to E3 stage) is characterized by Alm49-50Grs24-25Prp23-24Sps1. Tiny (<20 μm), subhedral garnet inclusions hosted by phengite and omphacite represent the third textural type. These grains are compositionally fairly uniform, i.e. Alm52-53Grs25-26Prp21-22Sps1 (Figure 3f–h).
| Mineral | Grt | GrtE1 | Grt | Grt | Grt | Grt | GrtE2 | Grt | GrtE3 | Grt | Grt | Grt | Grt | Grt |
|---|---|---|---|---|---|---|---|---|---|---|---|---|---|---|
| Position | Core Grt1 | Core Grt1 | Core-atoll Grt1 | Core-atoll Grt1 | Inner rim Grt2 | Inner rim Grt2 | Inner rim Grt2 | Outer rim Grt3 | Outer rim Grt3 | Inclusion | Inclusion | Inclusion | Outer-most rim | Outer-most rim |
| SiO2 | 39.30 | 37.07 | 38.91 | 39.08 | 38.86 | 38.89 | 39.06 | 38.60 | 38.70 | 38.75 | 39.16 | 39.15 | 37.45 | 38.28 |
| TiO2 | 0.10 | 0.04 | 0.10 | 0.06 | 0.03 | 0.04 | 0.01 | 0.04 | 0.06 | 0.13 | 0.04 | 0.04 | 0.02 | 0.08 |
| Al2O3 | 22.51 | 23.09 | 21.87 | 21.90 | 21.84 | 21.92 | 21.71 | 21.42 | 21.58 | 21.77 | 22.02 | 21.97 | 20.55 | 21.09 |
| Cr2O3 | 0.00 | 0.00 | 0.04 | 0.02 | 0.02 | 0.03 | 0.01 | 0.06 | 0.01 | 0.02 | 0.02 | 0.00 | 0.00 | 0.00 |
| FeO | 19.95 | 20.54 | 22.86 | 21.70 | 24.42 | 24.06 | 22.84 | 22.47 | 23.19 | 24.14 | 23.41 | 23.96 | 17.80 | 14.19 |
| MnO | 0.52 | 0.47 | 0.58 | 0.53 | 0.54 | 0.51 | 0.61 | 0.49 | 0.59 | 0.54 | 0.54 | 0.63 | 1.51 | 2.85 |
| MgO | 5.81 | 6.92 | 5.73 | 5.53 | 6.68 | 6.77 | 6.96 | 6.46 | 6.35 | 5.42 | 5.89 | 5.18 | 2.25 | 0.77 |
| CaO | 12.32 | 10.64 | 10.42 | 11.27 | 7.68 | 7.89 | 8.38 | 9.52 | 9.44 | 9.38 | 9.40 | 9.75 | 18.13 | 23.09 |
| Total | 100.56 | 99.10 | 100.54 | 100.14 | 100.09 | 100.11 | 99.61 | 99.09 | 99.98 | 100.22 | 100.51 | 100.71 | 98.72 | 100.68 |
| O | 12.00 | 12.00 | 12.00 | 12.00 | 12.00 | 12.00 | 12.00 | 12.00 | 12.00 | 12.00 | 12.00 | 12.00 | 12.00 | 12.00 |
| Si | 2.99 | 2.85 | 2.99 | 3.01 | 3.00 | 2.99 | 3.01 | 3.00 | 2.98 | 3.00 | 3.01 | 3.02 | 2.92 | 2.94 |
| Ti | 0.01 | 0.00 | 0.01 | 0.00 | 0.00 | 0.00 | 0.00 | 0.00 | 0.00 | 0.01 | 0.00 | 0.00 | 0.00 | 0.00 |
| Al | 2.02 | 2.09 | 1.98 | 1.99 | 1.99 | 1.99 | 1.98 | 1.96 | 1.96 | 1.99 | 1.99 | 2.00 | 1.89 | 1.91 |
| Cr | 0.00 | 0.00 | 0.00 | 0.00 | 0.00 | 0.00 | 0.00 | 0.00 | 0.00 | 0.00 | 0.00 | 0.00 | 0.00 | 0.00 |
| Fe2+ | 1.27 | 1.32 | 1.47 | 1.40 | 1.57 | 1.55 | 1.47 | 1.46 | 1.50 | 1.56 | 1.50 | 1.54 | 1.16 | 0.91 |
| Mn | 0.03 | 0.03 | 0.04 | 0.03 | 0.04 | 0.03 | 0.04 | 0.03 | 0.04 | 0.04 | 0.03 | 0.04 | 0.10 | 0.19 |
| Mg | 0.66 | 0.79 | 0.66 | 0.63 | 0.77 | 0.78 | 0.80 | 0.75 | 0.73 | 0.63 | 0.67 | 0.59 | 0.26 | 0.09 |
| Ca | 1.01 | 0.88 | 0.86 | 0.93 | 0.63 | 0.65 | 0.69 | 0.79 | 0.78 | 0.78 | 0.77 | 0.80 | 1.52 | 1.90 |
| Total | 8.00 | 8.00 | 8.00 | 8.00 | 8.00 | 8.00 | 8.00 | 8.00 | 8.00 | 8.00 | 8.00 | 8.00 | 8.00 | 8.00 |
| X Alm | 42.79 | 43.69 | 48.62 | 46.63 | 52.28 | 51.45 | 49.00 | 48.15 | 49.12 | 52.05 | 50.34 | 51.72 | 38.22 | 29.56 |
| X Sps | 1.11 | 1.03 | 1.26 | 1.14 | 1.16 | 1.11 | 1.33 | 1.07 | 1.27 | 1.18 | 1.17 | 1.37 | 3.29 | 6.01 |
| X Prp | 22.28 | 26.27 | 21.73 | 21.19 | 25.48 | 25.82 | 26.63 | 24.65 | 23.98 | 20.84 | 22.57 | 19.94 | 8.61 | 2.84 |
| X Grs | 33.86 | 29.01 | 28.39 | 31.04 | 21.07 | 21.62 | 23.03 | 26.13 | 25.63 | 25.92 | 25.91 | 26.97 | 49.88 | 61.59 |
- XAlm = 100 × Fe/(Fe+Mg+Ca+Mn); XSps = 100 × Mn/(Fe+Mg+Ca+Mn); XPrp = 100 × Mg/(Fe+Mg+Ca+Mn); XGrs = 100 × Ca/(Fe+Mg+Ca+Mn).
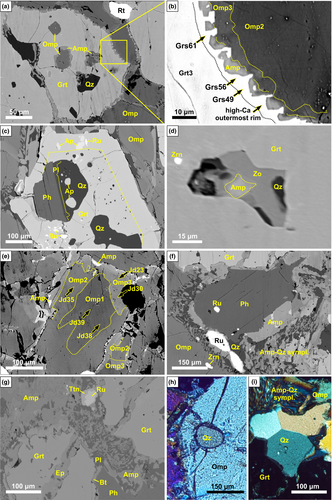
Clinopyroxene (~37 vol.%) occurs mainly as large, subhedral matrix grains and less commonly as anhedral inclusions in garnet. Both textural types have an omphacitic composition. The matrix omphacite exhibits distinctive zoning, where a high-Na core (Omp1; Jd >36 mol.%—representing E1 stage) is enveloped by an inner, medium-Na mantle (Omp2; Jd = 36–32 mol.%—reflecting E2 stage) and an outer discontinuous low-Na rim (Omp3; Jd <32 mol.%—referring to E3 stage; Table 2; Table S1; Figure 4e). Occasionally, omphacite has broken down to amphibole, forming coatings along the omphacite grain boundaries (Figure 4e,f). The matrix omphacite contains numerous inclusions of rutile, apatite, zircon, quartz and sulphides. Quartz in omphacite is rarely surrounded by radial cracks (Figure 4h). The omphacite inclusions in garnet do not exceed 50 μm in diameter and their jadeite content varies in a range of 26–33 mol.% (Table 2). Omphacite inclusions are also partly replaced by amphibole (Figure 4a).
| Mineral | OmpE1 | Omp | OmpE2 | Omp | OmpE3 | Omp | PhE1 | PhE2 | Ph | PhE3 | PhE1A | Amp | Amp | Amp | Amp |
|---|---|---|---|---|---|---|---|---|---|---|---|---|---|---|---|
| Position | Core Omp1 | Core Omp2 | Inner rim Omp2 | Outer rim Omp3 | Outer rim Omp3 | Inclusion | Core Ph1 | Inner rim Ph2 | Inner rim Ph2 | Outer rim Ph3 | Inclusion | Symplect. pargasite | Symplect. pargasite | Inclusion Fe-pargasite | Inclusion Fe-pargasite |
| SiO2 | 55.95 | 56.14 | 54.19 | 53.06 | 53.65 | 53.43 | 49.34 | 48.22 | 48.40 | 47.99 | 51.07 | 42.01 | 42.11 | 39.09 | 40.88 |
| TiO2 | 0.09 | 0.10 | 0.22 | 0.20 | 0.23 | 0.20 | 1.22 | 1.28 | 1.20 | 1.33 | 1.22 | 0.80 | 0.75 | 0.65 | 0.20 |
| Al2O3 | 9.97 | 10.14 | 10.26 | 8.31 | 6.72 | 9.47 | 26.35 | 28.02 | 28.14 | 29.11 | 26.19 | 16.44 | 16.74 | 18.65 | 17.05 |
| FeO | 3.27 | 3.52 | 5.18 | 6.11 | 5.43 | 6.89 | 1.87 | 1.89 | 1.70 | 1.64 | 1.94 | 12.36 | 12.48 | 16.07 | 16.28 |
| MnO | 0.02 | 0.00 | 0.04 | 0.02 | 0.05 | 0.06 | 0.00 | 0.01 | 0.00 | 0.00 | 0.00 | 0.08 | 0.10 | 0.08 | 0.13 |
| MgO | 9.91 | 9.84 | 9.18 | 9.59 | 10.31 | 8.63 | 3.42 | 3.10 | 3.10 | 2.90 | 3.69 | 10.57 | 10.52 | 7.77 | 8.34 |
| CaO | 15.17 | 15.18 | 15.30 | 18.28 | 19.12 | 15.44 | 0.00 | 0.03 | 0.01 | 0.00 | 0.00 | 10.02 | 10.09 | 10.04 | 10.89 |
| Na2O | 5.61 | 5.53 | 5.30 | 3.63 | 3.25 | 4.73 | 0.57 | 0.58 | 0.38 | 0.67 | 0.52 | 3.11 | 3.31 | 3.61 | 3.10 |
| K2O | 0.01 | 0.00 | 0.01 | 0.01 | 0.00 | 0.11 | 10.32 | 10.47 | 10.67 | 10.50 | 10.38 | 1.19 | 1.03 | 0.56 | 0.34 |
| Cl | — | — | — | — | — | — | — | — | — | — | — | 0.41 | 0.30 | 1.40 | 1.01 |
| Total | 99.99 | 100.45 | 99.68 | 99.26 | 98.84 | 99.08 | 93.35 | 93.90 | 94.11 | 94.13 | 95.01 | 97.10 | 97.58 | 97.93 | 98.34 |
| O | 6.00 | 6.00 | 6.00 | 6.00 | 6.00 | 6.00 | 11.00 | 11.00 | 11.00 | 11.00 | 11.00 | 23.00 | 23.00 | 23.00 | 23.00 |
| Si | 1.99 | 1.99 | 1.95 | 1.95 | 1.98 | 1.96 | 3.37 | 3.29 | 3.29 | 3.25 | 3.41 | 6.22 | 6.20 | 5.89 | 6.11 |
| Ti | 0.00 | 0.00 | 0.01 | 0.01 | 0.01 | 0.01 | 0.06 | 0.07 | 0.06 | 0.07 | 0.06 | 0.09 | 0.08 | 0.07 | 0.02 |
| Al | 0.42 | 0.42 | 0.43 | 0.36 | 0.29 | 0.41 | 2.12 | 2.25 | 2.26 | 2.32 | 2.06 | 2.87 | 2.90 | 3.31 | 3.00 |
| Fe3+ | 0.00 | 0.00 | 0.02 | 0.00 | 0.00 | 0.01 | 0.00 | 0.00 | 0.00 | 0.00 | 0.00 | 0.15 | 0.14 | 0.22 | 0.17 |
| Fe2+ | 0.10 | 0.10 | 0.13 | 0.19 | 0.17 | 0.20 | 0.11 | 0.11 | 0.10 | 0.09 | 0.11 | 1.38 | 1.40 | 1.81 | 1.86 |
| Mn | 0.00 | 0.00 | 0.00 | 0.00 | 0.00 | 0.00 | 0.00 | 0.00 | 0.00 | 0.00 | 0.00 | 0.01 | 0.01 | 0.01 | 0.02 |
| Mg | 0.53 | 0.52 | 0.49 | 0.52 | 0.57 | 0.47 | 0.35 | 0.31 | 0.31 | 0.29 | 0.37 | 2.33 | 2.31 | 1.75 | 1.86 |
| Ca | 0.58 | 0.58 | 0.59 | 0.72 | 0.76 | 0.61 | 0.00 | 0.00 | 0.00 | 0.00 | 0.00 | 1.59 | 1.59 | 1.62 | 1.74 |
| Na | 0.39 | 0.38 | 0.37 | 0.26 | 0.23 | 0.34 | 0.08 | 0.08 | 0.05 | 0.09 | 0.07 | 0.89 | 0.94 | 1.06 | 0.90 |
| K | 0.00 | 0.00 | 0.00 | 0.00 | 0.00 | 0.01 | 0.90 | 0.91 | 0.93 | 0.91 | 0.89 | 0.22 | 0.19 | 0.11 | 0.07 |
| Total | 4.00 | 4.00 | 4.00 | 4.00 | 4.00 | 4.00 | 6.99 | 7.02 | 7.00 | 7.02 | 6.97 | 15.75 | 15.77 | 15.85 | 15.76 |
| X Mg | 84.38 | 83.30 | 75.97 | 73.67 | 77.19 | 69.04 | 76.53 | 74.51 | 76.47 | 75.90 | 77.24 | 62.79 | 62.28 | 49.16 | 49.96 |
| X Na | 40.10 | 39.73 | 38.53 | 26.45 | 23.53 | 35.69 | — | — | — | — | — | — | — | — | — |
| Jd | 39.20 | 38.77 | 35.90 | 26.55 | 23.78 | 33.66 | — | — | — | — | — | — | — | — | — |
- XMg = 100 × Mg/(Mg + Fe); XNa = 100 × Na/(Na + Ca); Jd content calculated according to Morimoto (1989).
Phengite (~4.5 vol.%) typically consists of subhedral matrix grains and rare inclusions within garnet. The large matrix grains (up to 0.5 mm in width) exhibit a zoning pattern similar to omphacite, expressed by different Si (apfu) content (Table 2 and Table S2; Figure 3i,j). High-Si inner domain (Ph1—representing E1 stage; Si >3.32 apfu, max Si = 3.37 apfu) is surrounded by a medium-Si (Ph2—reflecting E2 stage; Si = 3.27–3.32 apfu) mantle and outer, low-Si (Ph3—referring to E3 stage; Si <3.27 apfu) thin and discontinuous rim. Occasionally, phengite is replaced by biotite. The matrix phengite contains inclusions of rutile, omphacite, quartz and zircon. Phengite inclusions only occur within atoll garnet and are associated with quartz±apatite±plagioclase (Figures 3e and 4c). Rarely, they host garnet inclusions (Figure 3f). The Si content in phengite inclusions in garnet varies from 3.31 to 3.41 apfu (referring to E1A stage; Figure 3g), but does not display any zoning pattern.
Rutile (~1.5 vol.%) occurs in two textural varieties. Most commonly, it forms anhedral matrix grains (10–150 μm across; Figure 4f) with Zr varying from 291 to 472 ppm. Rarely, rutile occurs as single inclusions or inclusion swarms within garnet, omphacite and phengite (Figures 3a and 4c,f). Its Zr content varies from 167 to 368 ppm. Rutile is generally well preserved, only locally it is replaced by titanite.
Amphibole (~6 vol.%) occurs as inclusions within garnet, discontinuous domains replacing omphacite (Figure 4e) and within amphibole+quartz symplectites around omphacite grains (Figures 3a and 4f) or amphibole+plagioclase symplectites around phengite grains (Figure 3a,e). The amphibole inclusions, occasionally associated with omphacite and zoisite (Figure 4a,d) have a composition of Fe-pargasite with XMg = 47.1–50.0% and high chlorine content (0.70–1.40 wt%). Late amphibole replacing omphacite has pargasite composition (XMg = 53.8–69.4%) with significantly lower chlorine content (<0.41 wt%) compared to amphibole inclusions. Amphibole also occurs in the aforementioned late veinlets, representing retrograde E4-stage assemblage, together with plagioclase, garnet, epidote/zoisite, biotite, titanite and carbonates.
Plagioclase (~2.5 vol.%) exists as inclusions only within the atoll garnet (Figure 4c) and symplectitic intergrowths with amphibole and quartz (Figure 3a,e). Plagioclase inclusions in garnet are Ab85An15, whereas symplectitic plagioclase composition varies in the range of Ab81-85An13-18. Orthoclase content does not exceed 0.5 mol.% in both textural types.
4 P–T ESTIMATES
4.1 Conventional geothermobarometry
The P–T conditions have been calculated for the garnet+clinopyroxene+phengite assemblage using the coupled method of garnet–clinopyroxene Fe2+-Mg exchange thermometer (Ravna, 2000) and net-transfer reaction 6diopside+3muscovite=3celadonite+2grossular+pyrope geobarometer (Ravna & Terry, 2004). For the calculations we used: (1) the phengite activity model and solid solution by Holland and Powell (1998), (2) the clinopyroxene activity model by Holland (1990) and (3) the garnet activity model by Ganguly, Cheng, and Tirone (1996). This approach provides reliable pressure estimates in phengite eclogites (Ravna & Terry, 2004), but the obtained temperatures might be underestimated due to uncertainties in Fe2+/Fe3+ ratio in pyroxene, providing an error of ±60°C (Ravna & Paquin, 2003).
The compositions of garnet, omphacite and phengite cores reflect the peak-pressure stage, referred to here as E1, whereas representative compositions of inner mantles and outer rims reflect the lower-pressure stage E2 and the peak-temperature stage E3, respectively (Figure 5a). According to Ravna and Terry (2004), the peak-pressure conditions are recorded by garnet with the highest grossular activity. This is valid for garnet, which underwent homogenization under the peak conditions. However, in the case of the eclogite, textural observations and chemical mapping suggest that the outer part of the garnet core reflects the peak-pressure composition (Figures 3b and 5). Therefore omphacite with maximum jadeite content, phengite with maximum Si (apfu) content, and garnet with grossular content representative for the outer part of the core (XGrs = 29 mol.%) have been taken for calculations of E1 (Tables 1 and 2). To verify our approach, the composition of garnet with maximum grossular (XGrs = 34 mol.%) was also used for a set of geothermobarometry calculations. The difference in the P–T results, despite the 5 mol.% difference in the grossular content, was negligible i.e. ~0.14 GPa, ~3°C.
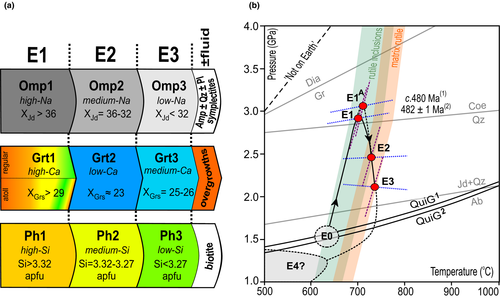
The geothermobarometric calculations yielded P–T conditions of 2.9 GPa at 702°C for the E1, thereby indicating UHP conditions during the peak-pressure metamorphism, and 2.5 GPa at 730°C for the E2 and 2.1 GPa at 735°C for the E3 stage, respectively (Figure 5b). It is worth mentioning that the atoll garnet cores contain phengite inclusions with significantly higher Si content up to 3.41 apfu (Figure 3e,g). These inclusions must have either grown before or simultaneously with the garnet core. This implies that the composition of phengite inclusions should record the peak pressure conditions, instead of the matrix-located phengite cores. Calculations based on a composition of phengite inclusion, outer part of the garnet core (XGrs = 29 mol.%) and omphacite (maximum jadeite content) yielded P–T of 3.1 GPa and 710°C (referred as E1A; Figure 5b). Differences in P–T values between E1 and E1A are subtle and interpose within inaccuracy of the applied method.
4.2 QuiG geobarometry and Zr-in-rutile geothermometry
The difference between the Raman spectrum of α-quartz at 464 cm−1 and the peak position for the quartz inclusion was used to calculate the pressure of the inclusion entrapment. The 464 cm−1 quartz peak which recorded the highest shift was used. The measured shift of the quartz Raman 464 cm−1 band reached up to 4.77 cm−1 for quartz inclusions in the regular garnet porphyroblasts. The highest shift measured for quartz inclusions in the atoll garnet was 5.12 cm−1. The calibration of Schmidt and Ziemann (2000) was used to calculate internal pressure. The isomekes of the entrapment pressures were calculated using the Fortran program Geobaramantry (Castro & Spear, 2016). The thermo-elastic model of Guiraud and Powell (2006) and equations of state for garnet (almandine) and quartz (Holland & Powell, 2011) were applied. The chosen quartz inclusions in garnet are 10–50 μm in diameter, situated below the surface and far from other inclusions (see Kohn, 2014 for detailed instructions). The precision of the QuiG barometry is ±0.01 GPa (Kohn, 2014; Spear, Thomas, & Hallett, 2014).
The Zr content in rutile enclosed in garnet provides information about the temperature of entrapment. Once entrapped, the rutile inclusions are supposedly resistant to re-equilibration (Tomkins et al., 2007). Zr-in-rutile temperatures have been estimated using the Tomkins et al. (2007) pressure-dependent calibration. The equation for the α-quartz stability field has been used for fields below the quartz–coesite transition line, whereas for the fields above this line, the coesite field equation has been applied. Application of different equations did not shift the temperature range, but only affects the slope of temperature fields (Figure 5b), which might be caused by change in substitution mechanism of Zr in rutile in higher pressures (Tomkins et al., 2007). The measured Zr in rutile inclusions (167–368 ppm; Table 3) encompasses a lower temperature range at pressures from 1.5 GPa (garnet nucleation—see Section 5; Figure 5b) to 3.0 GPa (peak pressure) than the matrix rutile (Zr = 292–437 ppm; Table 3; Figure 5b). Some rutile grains co-occur with zircon, but measured Zr concentration in those grains do not differ from rutile occurring in zircon-free assemblages. The temperature differences obtained from rutile inclusions in different garnet core regions are not larger than the method error (±30°C; Tomkins et al., 2007).
| Zr content in inclusion rutile (°C) | Zr content in matrix rutile (°C) | |||||
|---|---|---|---|---|---|---|
| Min. 167 ppm | Max. 368 ppm | Mean 307 ppm | Min. 292 ppm | Max. 473 ppm | Mean 376 ppm | |
| TE0* (1.5 GPa) | 625 | 688 | 673 | — | — | — |
| TE1** (3.0 GPa) | 684 | 752 | 730 | 731 | 776 | 754 |
| TE2* (2.5 GPa) | — | — | — | 711 | 754 | 733 |
| TE3* (2.1 GPa) | — | — | — | 694 | 736 | 716 |
In summary, the intersection of the QuiG geobarometry and Zr-in-rutile geothermometry (for rutile inclusions in garnet) isolines indicate the minimum P–T conditions of garnet growth, referred to here as E0. The calculated isomekes for quartz inclusions in the regular garnet cores suggest that the garnet nucleation commenced at ~1.50–1.55 GPa (at 620–660°C; QuiG2 in Figure 5b). Quartz hosted by the atoll garnet core yielded similar pressures in range of 1.55–1.60 GPa (at 620–660°C; QuiG1 in Figure 5b). In turn, the results obtained using conventional geothermobarometry, supported by Zr-in-rutile geothermometry, pinpoint the peak-pressure stage (E1) at 2.9 GPa and 702°C, followed by lower-pressure stages (E2) at 2.5 GPa and 730°C and (E3) at 2.1 GPa and 735°C.
4.3 Thermodynamic modelling
Isochemical phase diagram P–T sections for metamorphic stages E1 and E2 have been calculated using the Perple_X version 6.7.5 software package (Connolly, 1990, 2005) with the internally consistent thermodynamic database by Holland and Powell (1998). Both pseudosections have been calculated in the Na2O–CaO–K2O–FeO–MgO–MnO–Al2O3–SiO2–H2O–TiO2 (NCKFMMnASHT) system using following solution models: garnet (Ganguly et al., 1996), omphacite (Diener & Powell, 2012), phengite (Auzanneau, Schmidt, Vielzeuf, & Connolly, 2010), amphibole (Dale, Powell, White, Elmer, & Holland, 2005) and plagioclase (Newton, Charlu, & Kleppa, 1980). Both models have been calculated in the P–T space of 1.0–4.0 GPa and 500–1,000°C, and assume pure H2O fluid saturation.
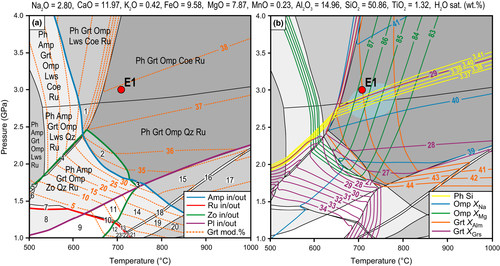
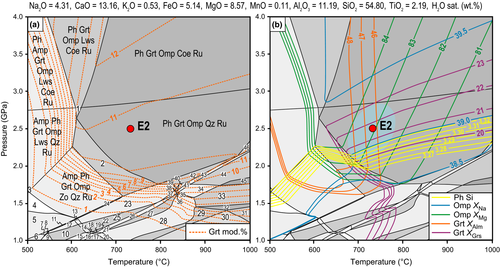
The pseudosection for the E1 stage has been calculated based on a slightly modified and normalized bulk rock composition (Figure 6a). The P2O5 and Cr2O3 contents (0.11 and 0.4 wt%, respectively) are negligible and thus omitted in the calculations. The FeO content has been lowered due to sulphide occurrence preserved as inclusions in garnet (Appendix S2; Table S3). Temperature dependent compositional isopleths of garnet (XAlm = 41–44 mol.%) and omphacite (XMg = 83–87) as well as pressure dependent isopleths of garnet (XGrs = 27–34 mol.%), omphacite (XNa = 39–41) and phengite (Si = 3.37–3.41 apfu) have been plotted (Figure 6b). In addition, isopleths reflecting garnet modal amount show extensive garnet growth within zoisite and amphibole stability fields that is less substantial after zoisite breakdown (Figure 6a). Isopleths were plotted for regular garnet type, omphacite and phengite cores. Almandine isopleths in garnet (XAlm = 41–44 mol.%) and magnesium number isopleths in omphacite (XMg = 83–87) show a broader range in comparison to measured values (i.e. XAlm = 42–46mol.% and XMg = 83–84) probably due to uncertainties in Fe2+/Fe3+ ratio (Table 1). Compositional isopleths plotted on the pseudosection mark a broad area within the garnet+omphacite+phengite+rutile+coesite and garnet+omphacite+phengite+rutile+quartz stability fields (Figure 6a). These results (2.8–3.1 GPa, 660–780°C) are in agreement with the P–T estimates obtained by the conventional geothermobarometry (Figure 5b). The pseudosection for the E2 stage (Figure 7) has been calculated based on normalized effective bulk composition, obtained by subtracting the composition of E1 minerals from the eclogite bulk composition (Appendix S2; Table S4). Isopleths were plotted for mineral inner rims (Grt2, Omp2 and Ph2). The pressure sensitive isopleths of garnet (XGrs = 20–23 mol.%), omphacite (XNa = 38.5–39.5), phengite (Si = 3.27–3.32 apfu) and temperature sensitive isopleths of garnet (XAlm = 46–48 mol.%) and omphacite (XMg = 81–84) have been calculated. All isopleths mark a P–T space between 2.2–2.8 GPa and 680–780°C, and intersect within the garnet+omphacite+phengite+rutile+quartz stability field (Figure 7b) matching the P–T conditions calculated using the conventional geothermobarometry method by Ravna and Terry (2004; Figure 5b). Garnet volume isopleths mark a wide field of garnet stability showing that garnet regrowth is possible during decompression coupled with rising temperature (Figure 7a). Garnet content rapidly decreases only within fields below amphibole-in and zoisite-in reactions (Figure 7a).
5 DISCUSSION
5.1 Prograde to peak metamorphism
The mineral assemblage preserved as inclusions in porphyroblasts (e.g. in garnet) is commonly the only source of information about the prograde P–T path of an eclogite. The first metamorphic reaction, which is possible to quantify in terms of the P–T in the studied eclogite is the garnet nucleation (referred to here as E0; Figure 5b). Hence, the temperature calculated from the intersection of the Zr-in-rutile isolines with QuiG isomekes indicates the minimum conditions of garnet nucleation, i.e. 1.5–1.6 GPa and 620–660°C. The pseudosection modelled using the bulk composition (Figure 6) shows that rutile was stable at this stage, which rules out a possibility of titanite entrapment and subsequent recrystallization to rutile under peak conditions. Also, at these conditions garnet should constitute no more than ~5 mod.% of the rock. This suggests that the garnet bloom occurred far above the modelled garnet-in reaction, thus may point to the overstepping of garnet-in reaction during the prograde path. In addition to quartz and rutile, garnet also contains inclusions of plagioclase, ferro-pargasitic amphibole and zoisite that give an insight to the lower pressure prograde stages.
Thermodynamic modelling predicts that plagioclase is stable below 1.4 GPa (at ~650°C, Figure 6b). Occasionally, plagioclase occurs in multiphase inclusions with phengite, located within outer parts of garnet cores (Figure 4e). This coexistence may have resulted from, at least locally, plagioclase breakdown reaction overstepping. Furthermore, the pseudosection shows that amphibole becomes unstable along proposed P–T path at ~2.0 GPa (~650°C), whereas zoisite breaks down at ~2.2 GPa (~665°C). The lack of those phases slows down further garnet growth which is demonstrated by garnet mod.% isopleths (Figure 6a). In the fields comprising plagioclase±amphibole±zoisite, the garnet growth rate is 20 mod.%/0.5 GPa, whereas above, the growth rate decreases to 1 mod.%/0.5 GPa. Besides the aforementioned phases, omphacitic clinopyroxene and phengite are also found as inclusions. Their presence could be interpreted as the record of late prograde to peak evolutionary stages. Substantial increase in garnet volume along the prograde part of the P–T path and incomplete assimilation of various inclusions provide evidence for rapid garnet growth.
Chemical zoning in the garnet cores, clearly expressed by decreasing grossular towards the rim, supports the proposed P–T path. The XGrs = 34 mol.% value measured in the centre of the garnet core, plots on the modelled pseudosection in the estimated P–T field for the garnet nucleation (E0; Figure 6b). Decreasing grossular with increasing P–T presumably results from decreasing amount of Ca-bearing phases (e.g. plagioclase, amphibole, zoisite) in the rock matrix. The isopleth XGrs = 29 mol.% for the outer part of the garnet core plots in a close proximity to the peak pressure conditions calculated using conventional thermobarometry (Figure 6b), which supports the aforementioned interpretation about the grossular decrease in the garnet core with increasing P–T.
Chemical zoning in the atoll garnet cores is yet more complex and provides information about different growth dynamics along the same P–T path. The maximum Ca-enrichment was observed in peninsula (XGrs ≈ 28 mol.%) and ring (XGrs ≈ 31 mol.%) i.e. central and outer part of the atoll garnet core (Figure 3h). Presumably at the later stage of prograde metamorphism, the gap between peninsula and ring was healed by the XGrs ≈ 26 mol.% infill (Figure 3h). The QuiG barometry applied to the inclusions hosted in these zones shows that the atoll garnet started growing under similar conditions (1.55–1.60 GPa at 620–660°C) to the predominant regular garnet (1.50–1.55 GPa at 620–660°C; Figure 4). Therefore, slightly lower grossular content in the atolls would not be caused by different P–T conditions of early growth, but may be an effect of different local bulk composition. Garnet inclusions in phengite that is hosted by the atoll garnet (Figure 3g) display similar compositions as the healed atoll (XGrs ≈ 26 mol.%), hence they have formed at similar P–T conditions.
Calculated and modelled peak-pressure (E1) conditions i.e. 2.8–3.1 GPa at 660–780°C predict stability of coesite in the peak mineral assemblage (garnet+omphacite+phengite+rutile+coesite) and therefore confirm UHP conditions during maximum burial of eclogites. The lack thereof in the studied eclogite could have resulted from the back polymorphic reaction during retrogression and recrystallization. The matrix quartz displays polygonal texture (Figure 3i), which is indicative for extensive Grain Boundary Area Reduction static recrystallization at >700°C (e.g. Mainprice, Bouchez, Blumenfeld, & Tubia, 1986). The only possible indication of the former presence of coesite is radial cracks around quartz inclusions in garnet and omphacite (Figure 4h).
5.2 Retrograde metamorphism
The P–T conditions of the lower-pressure stage (E2) have been constrained using the garnet, omphacite and phengite inner rim compositions, and are estimated to be 2.5 GPa at 730°C. The modelled pseudosection and compositional isopleths for relevant mineral compositions confirm these estimates suggesting the P–T range of 2.2–2.8 GPa and 680–780°C (Figure 7b). This P–T region overlaps the amphibole-bearing and amphibole-free assemblages. Based on petrographical observations, amphibole can be excluded from the E2 assemblage. Thus the E2 stage recorded by this rock resulted in modification of the internal chemistry and mode of the phases building the E1 assemblage, but without addition or removal of new phases.
Thermodynamic modelling is not applicable to estimate the E3 stage. The outer rims of garnet and omphacite reveal substantial Ca-enrichment, which could not have been achieved without an external Ca supply. Therefore, calculations of an effective bulk composition for the E3 stage based on the E2 stage bulk composition would be flawed due to an open chemical system. Nevertheless, the P–T conditions obtained for the E3 stage using conventional geothermobarometry (2.1 GPa at 735°C) imply nearly isothermal decompression.
The temperature range calculated for the unaltered matrix rutile is slightly higher than that for the inclusion rutile over a broad pressure range (Table 3; Figure 5b) and overlaps with our P–T estimates for the E2 and E3 stages.
Later stage of exhumation (E4) can be constrained by amphibole±plagioclase±quartz symplectites replacing omphacite suggesting a reduction in pressure below 1.5 GPa (Figure 5b). Mineral assemblages found in the late veinlets (i.e. amphibole+plagioclase+zoisite/epidote+biotite+titanite+carbonates) and extreme enrichment of Ca in the garnet outermost rim (XGrs = 49–61 mol.%; Figure 4d) imply a pervasive Ca-bearing fluid influx during retrogression. Such Ca-fluid supply has been also discussed for the Vaimok eclogites’ host rocks by Albrecht (2000). It is beyond the scope of this research to discuss in detail a possible source of such Ca-enriched fluid, but it can be speculated that it originated in the host rocks which are locally dominated by calc-silicate lithologies.
5.3 Tectonic implications
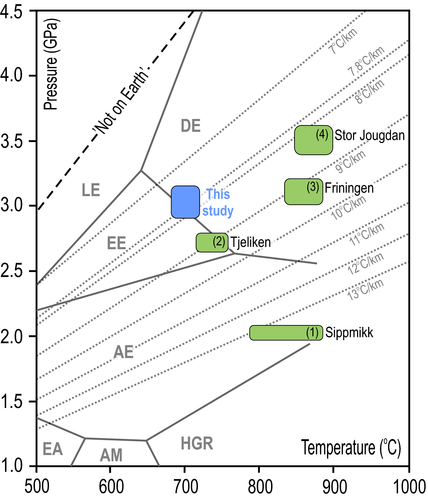
High-P rocks of the SNC in Norrbotten are substantially older (c. 490–480 Ma; Fassmer, Froitzheim, Fonseca, & Münker, 2017; Root & Corfu, 2012) than those known from other parts of the SNC and other tectonostratigraphic units of the Scandinavian Caledonides. They are traditionally interpreted as the result of the subduction beneath and collision with the Virisen Island Arc, an event called the Finnmarkian orogeny (e.g. Andréasson & Albrecht, 1995; Brueckner & van Roermund, 2004; Stephens & Gee, 1989 Figure 8a). The Finnmarkian subduction was initially of intraoceanic character and rather low temperature type, which was followed by involvement of the Baltica outermost margin, which in turn resulted in a change in the temperature regime. Indeed, some of the eclogitized pillow lavas known from the Tsäkkok lens of Norrbotten contain relict glaucophane (Kullerud et al., 1990), typical for low temperature-high pressure (LT-HP) rocks. Hence, they must have formed along low to very low geotherms leading to metamorphism under blueschist facies conditions. The studied eclogite from the Vaimok lens does not contain any relicts of a LT-HP metamorphic assemblage, but the P–T estimates provided by this study suggest formation of this eclogite along still quite low thermal gradient of ~7.8°C/km (Figure 9). Thus, it is probable that the HP lithologies of the Vaimok lens represent the very first vestiges of the Baltica continental crust which were subducted during the Caledonian Orogeny.
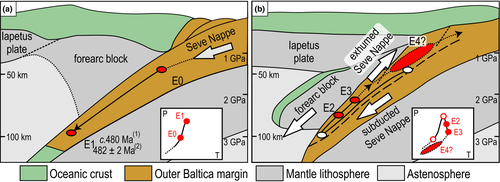
The retrograde P–T path of the Vaimok eclogites presented in this study provides new insight into the evolution of this part of the Scandinavian Caledonides. The post-peak pressure (i.e. post-E1; see also Figure 8b) exhumation could have been a complex process involving at least two stages (E2 and E3) of tectonic stagnation during which new mineral equilibria were attained. One of the causes of such a non-linear exhumation rate may be the double dunking of parts of the SNC initially proposed by Brueckner and van Roermund (2004) and later revived by Majka, Rosén, et al. (2014). In such a scenario, renewed (or ongoing) subduction of the SNC (its parts proximal to the Baltica basement) could have slowed down or even stopped the already exhuming HP Seve units. The exhuming Seve (including the Vaimok lens) would had to have formed an upper and presumably thinner tectonic unit temporarily juxtaposed to the down-going thicker Seve units (Figure 8b), probably equivalents to those occurring farther south in Jämtland which yield younger middle Ordovician ages. However, such speculation requires a detailed context-sensitive in-situ thermochronology, which would allow a direct dating of shear fabrics developed in exhuming rocks, preferably in the metasedimentary host rocks to the eclogites studied here. Nevertheless, the deduced retrograde part of the P–T path reveals heating during exhumation (Figure 8), which may suggest either a generally slow exhumation rate or stagnation periods (i.e. E2 and E3 stages) of exhumation during which new assemblages were developed. Another line of evidence for the latter is the fluid-induced changes observed within the assemblages developed during the E3 and especially E4 stages. In such a case, the source of fluids would be located within the devolatilizing, down-going Seve units.
As mentioned above, the studied rocks most likely represent the very first continental lithologies that were subducted during the Caledonian orogeny in general. Existing and widely accepted tectonic models (e.g. Brueckner & van Roermund, 2004; Gee et al., 2013) as well as provenance studies performed on the host rocks to eclogites in the Vaimok lens (Gee, Andréasson, Lorenz, Frei, & Majka, 2015) place the rock units discussed here either in the outermost Baltica margin or in a microcontinent, possibly a Baja California-like peninsula, which had been rifted away from the Baltica outer margin during initial stages of the Iapetus opening (but see also e.g. Corfu, Andersen, & Gasser, 2014 for critical discussion and alternative ideas). The existence of a microcontinent was recently discarded, mostly because of a lack of evidence for an actual suture zone between the SNC (more specifically HP bearing parts of the SNC) and the underlying units (e.g. Klonowska et al., 2016; Majka, Janák, et al., 2014). Therefore it is suggested here that the parts of the SNC in Norrbotten could have entered the subduction zone during the earliest Caledonian orogenic cycle due to the uneven geometry of the Baltican margin. If such a western extension of Baltica (current coordinates) existed, it would have been subducted first, followed by subduction of more proximal parts of the shelf sediments and eventually by the Baltica crystalline basement. Notwithstanding, this speculation as well as other models, have to be corroborated by more detailed modern petrological, structural and geochronological studies within both the Vaimok and Tsäkkok lenses as well as farther north towards the Kebnekaise and Torneträsk regions where other possible HP lithologies occur.
6 CONCLUSIONS
- Phengite eclogites from the Vaimok lens, belonging to the SNC in Norrbotten (Sweden), have undergone subduction related ultrahigh-pressure metamorphism. Therefore, we show that the Seve nappes bear a record of subduction into mantle depths nearly along their entire length, extending north of the Arctic Circle.
- The first metamorphic stage recorded by the studied eclogite (E0) is interpreted to mark garnet nucleation occurring at 1.5–1.6 GPa by 620–660°C. Peak P–T conditions of the E1 stage have been constrained by various geothermobarometric techniques and based on the modelled peak assemblage (garnet+omphacite+phengite+rutile+coesite?), to 2.8–3.1 GPa at 660–780°C. Later, lower-pressure stages E2 and E3 record conditions of 2.2–2.8 GPa, 680–780°C and 2.1 GPa, 735°C, respectively. Subsequent decompression below 1.8 GPa was caused by the final exhumation of the studied HP unit.
- The Vaimok lens eclogites had been subducted in a cold subduction regime (˜7.8°C/km) at the early stages of the Iapetus Ocean closure. Multistage exhumation might be a result of repeated stagnation stages due to temporal juxtaposition with down-going parts of Seve along ongoing/renewed subduction system.
ACKNOWLEDGEMENTS
We are grateful for constructive reviews performed by H.K. Brueckner and G. Rebay as well as editorial handling and review by D. Robinson, leading to significant improvement of the manuscript. This research was funded by the National Science Centre (Poland) research project CALSUB (no. 2014/14/ST10/00321 to J. Majka) and by the Swedish Royal Academy of Sciences (KVA) project GS2015-0006 to I. Klonowska. This work was also partially supported by the project: Centre of Excellence for Integrated Research of the Earth's Geosphere (ITMS: 26220120064), which is co-financed through the European Regional Development Fund. G. Ziemniak is acknowledged for his great help with calculations. A. Włodek is thanked for his technical and analytical assistance during WDS analyses at AGH-UST.


