Encounter the unforeseen: Resilient supply chain modeling for a sustainable bioeconomy
Editor Managing Review: Robert Anex
Funding Information:
The authors received no financial support for the research, authorship, and/or publication of this article.
Abstract
Bioeconomic supply chains (BioSC) processing biogenic resources and substituting fossil-based products are prone to weather-induced feedstock supply disruptions, which likely increase in severity and frequency due to climate change. To attain supply security of biobased products that contribute to sustainable development, BioSCs should be equipped with a certain level of “resilience” against unexpected feedstock fluctuations. Existing BioSC models usually capture producer resilience to maximize profitability for anticipated feedstock scenarios. Consumer supply security for unanticipated events has drawn less attention. To encounter the unforeseen and both producer and consumer perspectives, we present a two-step approach: (1) resilient planning of a European BioSC producing bioethanol as petrol substitute from straw for both producer and consumer perspective; a novel step (2) assesses the “actual” resilience for unanticipated, random feedstock scenarios and economic, and environmental implications. While a producer-resilient supply chain has lower bioethanol production capacity and already high straw storage capacities to maximize profitability under feedstock fluctuations, supply security degrades. In contrast, consumer-resilient supply chains have higher production and storage capacities to maintain supply security. Although this network redundancy comes with higher environmental impacts from facility construction and supply chain operation (production and transport), the environmental benefit of substituting petrol exceeds those burdens in most environmental life cycle assessment categories. Consequently, consumer resilience can be congruent with environmental sustainability and should be supported by policymakers to strengthen European bioeconomy and guide producers toward consumer-resilient supply chains. This article met the requirements for a gold-gold JIE data openness badge described at http://jie.click/badges.
1 INTRODUCTION
The bioeconomy endeavors to satisfy humans’ hunger for materials and energy through renewable biological resources and is a central sector of the global economy and of key importance for leading the society toward a sustainable pathway (El-Chichakli et al., 2016). Depending on its realization, bioeconomic value chains enable a positive contribution to multiple stakeholders, from the economy to the environment and society (Messmann et al., 2023; Wietschel et al., 2021). However, recent global supply disruptions insinuate ever-increasing vulnerabilities of efficiency-trimmed supply chains (SC) (Bruckler et al., 2024; Carvalho et al., 2012; Golan et al., 2020; Sheffi & Rice, 2005; Tang, 2006). Bioeconomic SC (BioSC) are particularly vulnerable to disruptions: Even in the optimistic 1.5°C global warming scenario, temperature extremes, heavy precipitation, and droughts will occur more frequently and intensely (IPCC, 2022), increasing the likelihood of weather-induced resource shortfalls (Lesk et al., 2016) and making BioSC more susceptible than fossil and mineral resource-based SC (Habibi et al., 2023). Increasing BioSC resilience, which paves the way for a more sustainable future, is therefore of great interest to society as a whole. The field of industrial ecology, traditionally focused on reducing environmental impacts through technology, identified the urgent need to equip sustainable development with resilience considerations to protect the path to sustainability from the impacts of climate change (Chester, 2020; Dijkema et al., 2015; Elmqvist et al., 2019; Kendall & Spang, 2020; Meerow & Newell, 2015; Yang et al., 2020).
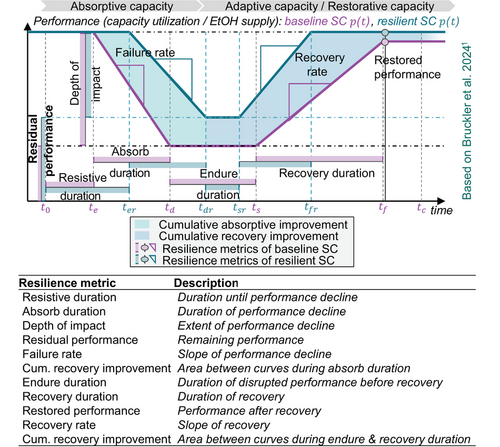
The term “resilience” could be translated to “rebound” from a disturbance and is popular in several fields, such as psychology, livelihood, social, economic, engineering, or ecological systems. Engineering resilience is a reactive concept that targets stability around an equilibrium state and investigates a system's capacity to absorb and recover from disturbances (Holling, 1996). Supply chain resilience (SCR) is based on this school of thought and is usually defined by a combination of preparedness for a disturbance and the ability to respond, recover, and maintain a positive equilibrium state within reasonable costs and time (Ribeiro & Barbosa-Póvoa, 2018). These abilities are known as absorptive, adaptive, and restorative capacities (Vugrin et al., 2011). SCR research has already developed quantitative methods to evaluate the effects of high-impact, low-probability disruptions: the so-called resilience curve maps a system's performance over time and, thereby, illustrates its degradation and recovery in case of disruptions (Bruneau et al., 2003) depending on the available absorptive, adaptive, and restorative capacities (Bruckler et al., 2024). Resilience metrics assess characteristics of the curve, such as the depth of impact (extent of performance decline) or the recovery rate (slope of performance recovery) (Poulin & Kane, 2021). BioSC, such as biofuel production, can be termed resilient when absorptive, adaptive, and restorative capacities ensure an efficient response, adaption, and recovery of the network from disruptions (e.g., feedstock shortfall) to meet the system's objectives (e.g., profitability from a producer perspective) and the consumer needs (e.g., demand coverage) (Habibi et al., 2023). Deliberate actions can strengthen those capacities, improve resilience metrics, and, consequently, improve overall SCR (Bruckler et al., 2024). These precautionary actions can already be considered in strategic planning to increase resilience toward supply disruptions.
BioSC depend on low-density and low-cost feedstock, which is spatially spread, resulting in nonlinear feedstock transportation costs (Lauven et al., 2018; Wietschel et al., 2021; Wright & Brown, 2007). Consequently, these SC require context-specific models and actions to improve resilience, which have already been addressed in the literature.
Existing approaches that explicitly consider resilience actions in BioSC modeling include resilience-oriented biorefinery (BR) location and capacity planning (e.g., Bai et al., 2015), feedstock storages or collection centers (e.g., Fattahi et al., 2021; Liu et al., 2017; Mousavi Ahranjani et al., 2020; Saghaei et al., 2020; Yazdanparast et al., 2022), pretreatment facilities (e.g., Khezerlou et al., 2021; Maheshwari et al., 2017; Osmani & Zhang, 2013, 2017), or multiple feedstock types (e.g., Fattahi et al., 2021; Huang & Pang, 2014; Khezerlou et al., 2021; Mousavi Ahranjani et al., 2018, 2020; Osmani & Zhang, 2013, 2017). Some of these articles incorporate environmental or social objectives or constraints alongside the predominant economic perspective and examine the implications of different dimensions on the SC design (e.g., Mousavi Ahranjani et al., 2020; Salehi et al., 2022).
Besides the integration of resilience actions, literature on BioSC planning has considered resilience by models intended to optimize or at least maintain economic efficiency in case of parameter uncertainty. In this context, strategic planning encompasses uncertainty of feedstock availability (e.g., Mousavi Ahranjani et al., 2020; Soren & Shastri, 2019), demand (e.g., Kalhor et al., 2023), operational availability (e.g., Huang & Pang, 2014; Khezerlou et al., 2021), or joint uncertainties of multiple parameters (e.g., Liu et al., 2017; Mousavi Ahranjani et al., 2020; Osmani & Zhang, 2013; Saghaei et al., 2020). The dominant method to consider uncertainty in BioSC is stochastic programming with objective functions minimizing costs or maximizing profit (Habibi et al., 2023). To reduce complexity, uncertainty is typically represented by finite random scenarios with given probabilities (Habibi et al., 2023). Few articles consider realistic scenarios drawn from probability distributions based on historical data (Bairamzadeh et al., 2018; Mousavi Ahranjani et al., 2018).
Resilience is rarely considered within BioSC by integrating resilience objectives, constraints, or metrics. Zhao and You (2019) optimize the area under the resilience curve for the performance measure of available BR capacity in a bi-objective two-stage robust model. They additionally use Pareto curves to analyze trade-offs between resilience and economic performance for two small-scale cases (transportation network and biofuel SC). Salehi et al. (2022) incorporate resilience and sustainability factors into a joint objective function of a robust optimization model, assuming demand and operational uncertainty. Resilience is achieved by penalizing the use of old technology and critical nodes and flows along the SC. They apply the same metric as Zhao and You (2019) as a constraint to assess the resilience also for the performance measure of available BR capacity.
- ❖ Resilience operationalization: To design resilient BioSC, most models follow economic objectives under uncertainty through fictive, randomly chosen scenarios, including explicit decisions on resilience actions whereas most works exclusively focus on “operational resilience” from the producer perspective. However, multiple stakeholders might be affected by disruptions and countervailing resilience actions (Grafton et al., 2019), requiring an inclusive assessment of the different affected perspectives to avoid unwanted problem shifting (Elmqvist et al., 2019). Approaches of explicit resilience objectives or metrics integrated into models to address different stakeholders, such as the consumer (ensuring supply security), are barely investigated.
- ❖ Resilience against the unforeseen: Existing models rely on anticipated scenarios for which resilience is determined as a priori assessment. However, resilience is not necessarily improved against unknown future events (Inan et al., 2024). This “actual” SCR against unforeseen, not anticipated scenarios has not yet gained much attention (Bruckler et al., 2024).
- ❖ Implications of incorporating resilience: Less attention has been paid to jointly investigating the effect of resilience considerations in SC modeling on resilience, economic, and environmental performance (Habibi et al., 2023).
- ❖ RQ1: How can resilience in terms of supply security (consumer perspective) be considered in quantitative models for the strategic planning of BioSC?
- ❖ RQ2: How can the “actual” resilience regarding unanticipated events be assessed?
- ❖ RQ3: Which effect do these resilience considerations in SC modeling have on the economic and environmental performance of a second-generation bioethanol (2G EtOH) SC?
This article presents a real-data experiment design to model and assess resilient SCs for 2G EtOH production in the EU, considering feedstock supply uncertainty due to extreme events. Therefore, Section 2.3 presents a new two-step approach: In step 1 (strategic planning), a bi-criteria two-stage stochastic linear programming decides on the combination of actions to optimize economic profit under feedstock uncertainty (producer perspective) and to meet a resilience satisfaction goal to ensure “supply security” (consumer perspective). Therefore, we select a set of realistic feedstock scenarios from historical feedstock data. In contrast to existing approaches that are based exclusively on a priori optimization, a subsequent simulation (step 2) is used to validate these strategic decisions from the resilient model for a new set of randomly drawn scenarios, which the model did not yet anticipate. This enables the analysis of economic and environmental implications (Section 3.1) of resilience considerations in SC modeling and to assess the “actual” SCR (Section 3.2) for unforeseen scenarios. Thereby, our article contributes to the required shift in research that a resilient system needs to deal with unknown developments for a sustainable future (Reyers et al., 2022). Although our approach is tailored for BioSC, this work contributes to a general understanding of how the resilience curve, its metrics, and SC modeling can be combined to increase resilience and which implications can come along with resilient SC planning.
2 METHODS
2.1 Problem description and aim
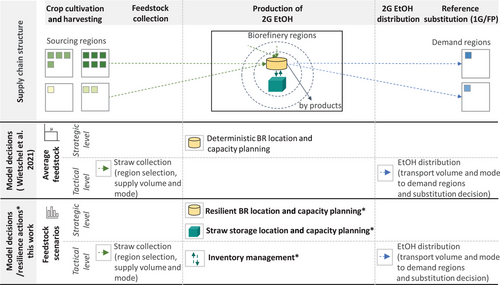
This article builds upon the model of a large-scale 2G EtOH production network introduced by Wietschel et al. (2021) as an advanced real-case model for the EU. In their work, a mixed integer linear programming model (MILP) is used to determine 2G EtOH SC configurations as trade-off solutions according to different objectives: an economic objective function maximizing the profit and several life cycle assessment (LCA)-based environmental objective functions maximizing benefits of the network design and operation. The SC configurations are designed within 91 Nomenclature des unités territoriales statistiques (NUTS1) regions of the EU28 and comprise the following decisions (Figure 1): feedstock harvesting (cereal straw) and transport to the BR, BR location and production capacity, and 2G EtOH production and distribution to either substitute petrol or first-generation (1G) EtOH. However, their model considers average feedstock availability, which may limit the validity of the results (Wietschel et al., 2021). While their approach shows a potential course toward a more sustainable future, additionally considering the resilience of different affected stakeholders would strengthen the system's capacity to adhere to the pathway, especially in light of the increasing frequency and intensity of climate change-induced weather extremes (IPCC, 2022). Consequently, we aim for an approach that combines tools (metrics) and concepts (resilience curve) of resilience research with SC modeling to (1) strengthen resilience of vulnerable BioSC and (2) analyze their “actual” resilience, economic, and environmental performance regarding not anticipated scenarios. Therefore, we adapt the model of Wietschel et al. (2021) by considering resilience within the model formulation and decisions to enable coping with feedstock disruptions. In contrast to the original model, where economic and environmental objective functions are (Pareto) optimized, our model is solely optimized economically, while a resilience satisfaction goal is introduced (see Section 2.2), and the environmental performance is co-calculated for several LCA end/midpoints.
2.2 Resilience consideration and assessment
Unlike existing articles, we differentiate between the producer and consumer resilience of a BioSC. From a producer perspective, the performance measure is the BR capacity utilization: A resilient production maintains high capacity utilization by absorption, adaptation, or restoration from a disruption, which aligns with existing models (e.g., Salehi et al., 2022; Zhao & You, 2019). Regarding the stakeholder “consumer,” we define performance as EtOH supply to cover a demand (supply security): a fully resilient EtOH SC maintains a constant supply to fulfill demand at any time and disruption scenario equal to the covered demand in case of average feedstock availability.
To operationalize resilience, the deterministic MILP of Wietschel et al. (2021) is transformed to explicitly consider the consumer: a satisfaction objective (constraint) enforces a minimum residual performance in demand coverage in each period and feedstock scenario as first resilience consideration. To cover the producer perspective, the model is turned into a time-discrete, two-stage stochastic linear programming model considering feedstock supply uncertainty. Consequently, the proposed model decides on BR locations and capacities at the strategic level under consideration of feedstock disruption scenarios, which can be considered a second resilience consideration for the improvement of absorptive capacity (Bruckler et al., 2024; Sharkey et al., 2021), since the network design already reflects the supply uncertainty of each individual region. The resulting network design intends to reduce impacts on EtOH production and supply volumes which is analyzed in Section 3.2.
Besides the model formulation, resilience can be influenced by explicit actions that decision-makers proactively choose to improve absorptive, adaptive, and/or restorative capacities (Bruckler et al., 2024). The underlying model incorporates actions at the strategic and tactical planning levels (Figure 1). Research on BR network planning considers different types of storage to hedge feedstock uncertainty (Fattahi et al., 2021; Liu et al., 2017; Mousavi Ahranjani et al., 2020; Saghaei et al., 2020; Yazdanparast et al., 2022). Therefore, as third resilience consideration, our model makes strategic decisions on feedstock storage locations at BR sites and capacities as explicit, strategic resilience action aiming at improving absorptive capacity by absorbing feedstock shortages through inventory (Bruckler et al., 2024). In addition, our model decides on inventory management (storage in-/outflow) as a tactical resilience action.
Finally, the effect of the proposed resilience considerations is assessed by the resilience curve, which results from mapping the performance measures (capacity utilization = producer resilience; EtOH supply = consumer resilience) over time. Metrics from Bruckler et al. (2024) quantify the effect of resilience actions, the “resilience gain,” on the curve's characteristics that improve absorptive, adaptive, and restorative capacities and, thereby, overall SCR. This article applies only metrics computable with the available data (Figure 2) to assess how the resilience considerations affect the resulting networks compared to a deterministic baseline supply chain (BSC), which is planned without resilience considerations and based on average feedstock availability similar to Wietschel et al. (2021).
2.3 Experiment design
This work's experiment design aims at the methodological inclusion of resilience in the strategic planning of BioSC and the investigation of its interplay with economic and environmental performance for unforeseen scenarios. Therefore, the regional scope is limited to NUTS1 regions of Romania (RO), Hungary (HU), and Bulgaria (BG), which were identified as promising for 2G EtOH production due to relatively low BR construction and operation costs and high-feedstock availability (Wietschel et al., 2019, 2021). A timeframe of 16 quarters (4 years) is chosen as suitable compromise between accurate temporal resolution and computational efficiency to account for seasonal supply patterns and inventory holding costs.
- ❖ Step 1: The baseline model is formulated as a deterministic MILP assuming average supply (baseline scenario) in each region, similar to the assumptions made by Wietschel et al. (2021), and is solved only once to determine the strategic decisions (BR/storage locations and capacities) of a reference network named baseline SC (BSC). Furthermore, the 2G EtOH supply volume to each demand region is calculated to serve as benchmark EtOH demand fulfillment in the resilient model (2G EtOH supply (baseline) in Figure 3). The resilient model is implemented as a two-stage stochastic model: the first-stage (“here-and-now”) decisions (Li & Grossmann, 2021) involve location and capacity planning for BR and storage facilities. The second-stage (“wait-and-see”) decisions depend on the first-stage decisions and are determined for each scenario realization (Li & Grossmann, 2021). They comprise decisions on feedstock and ETOH flows and storage in-/outflows. The objective function is the expected net present value for the realization of the 25 selected scenarios with their respective (joint) probability, which results from five discrete feedstock supply scenarios in years two and four (Supporting Information S1 1.4 and 4.1). In addition, the resilience satisfaction objective ensures a certain level of minimum EtOH demand fulfillment (residual performance) for each demand region. It is solved for 11 different residual performances between 0% and 100% (represented by ) of the benchmark EtOH demand fulfillment in the baseline. This results in 11 different SC configurations determined by the first-stage decisions with the ascending impact of the resilience satisfaction objective (resilient SC0-SC10).
- ❖ Step 2: Each resulting SC configuration of step 1 is fixed (strategic decisions of BSC; first-stage decisions of the resilient model forming resilient SC0-SC10), and their performance is simulated for the new 25 randomly generated feedstock scenarios (Supporting Information S1). Therefore, a one-stage stochastic model only takes second-stage tactical decisions: tactical resilience actions (rerouting feedstock collection, storage in-/outflows) and decisions on EtOH supply to demand regions.
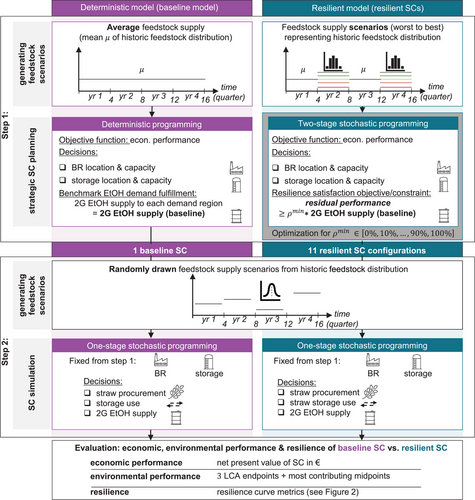
Finally, an ex post analysis assesses the economic (expected net present value) and environmental performance regarding three LCA endpoints of ReCiPe 2016 (Huijbregts et al., 2017) and most contributing midpoints (Figure 2 of Supporting Information S1) of the resulting SC configurations. Additionally, the effect of resilience considerations in SC modeling is evaluated based on the resilience curve for two different performance measures (BR capacity utilization and EtOH demand fulfillment) to investigate both the producer and consumer resilience as conceptually explained in 2.2.
3 RESULTS
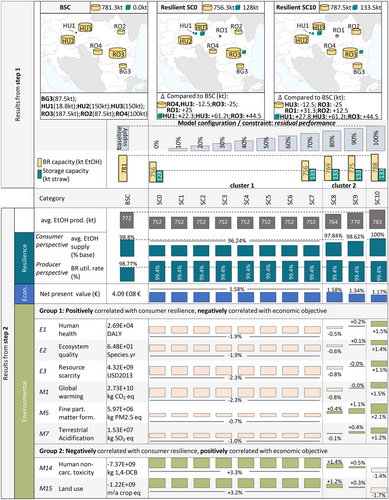
- ❖ Baseline model, step 1: The BSC has a total BR capacity of 781.3 kt 2G EtOH/quarter without straw storage since it is not economically viable. The largest BR is built in RO3 (187.5 kt), followed by HU2 and HU3 (150 kt each), RO4 (100 kt), and BG3 and RO2 (87.5 kt each). A comparatively small BR is built in HU1 (18.8 kt). The EtOH produced is finally distributed to high-profit demand regions (i.e., Austria (AT1, AT2), Finland (Fl1, Fl2), and Sweden (SE2)).
- ❖ Resilient model, step 1: Considering the stochasticity of feedstock supply and the ascending levels of the resilience satisfaction objective residual performance (0%–100% of the benchmark performance), 11 SC configurations (SC0 to SC10) are identified. For SC0, the constraint residual performance is set to 0% (not binding), the model solely maximizes the economic objective. Compared to BSC, the total capacity reduces to 756.3 kt due to a smaller BR in RO3, RO4, and HU3. Even though the total capacity decreases, a new BR is constructed in RO1. The capacity reduction ensures higher utilization rates even in adverse feedstock supply scenarios but also results in lower total EtOH production volumes. In contrast to BSC, a total of 128 kt straw storage is built in RO3, HU1, and HU3 to cushion fluctuating supply. These strategic decisions remain robust until the resilience constraint enforces a minimum residual performance of 60%, resulting in an identical network of SC0 to SC6. A residual performance of at least 70% (SC7) further increases the storage capacity in HU1 to a total of 133.5 kt. For a residual performance of 80% (SC8), the BR capacity of RO4 increases, totaling a capacity of 769 kt. For further accentuating residual performance to 90% (SC9), the resulting network is characterized by a capacity increase in RO1 to 775 kt. To ensure a residual performance equal to the benchmark performance in the baseline scenario (100%), the total BR capacity of SC10 increases to 787.5 kt while the storage capacity remains unchanged.
- ❖ Economic performance and resilience of the SC simulation, step 2: Under optimization of the economic objective, the performance of BSC and SC0–SC10 are simulated for the new set of 25 random feedstock scenarios per region and year drawn from the correlated normal distribution. Regarding economic performance, the expected net present value of SC0–SC7 is 1.58% higher than that of the BSC (4.09 E+08€) due to higher average utilization rates of BR capacities (99.42% vs. 98.77% for BSC). Consequently, producer resilience and profitability seem complementary, as higher capacity utilization rates were identified as economically efficient. However, the average quarterly EtOH production volume of 752 kt EtOH is lower due to the smaller total BR capacity of 756.3 kt, resulting in a lower mean covered demand of 96.24% compared to the baseline supply, which indicates lower consumer resilience (more details in Section 3.2). For SC8–10, the economic performance remains better than for the BSC, but the advantage slightly declines from +1.58% (SC8) to +1.17% (SC10). At the same time, the average produced EtOH volume significantly increases from 764 kt (SC8) to 783 kt EtOH (SC10), and demand coverage rises from 97.84% (SC8) to 100% (SC10). The economic benefit of SC0–SC10 compared to BSC is even more apparent in single low feedstock availability scenarios, resulting in above-average performance of up to 4.8% (SC0) and 4.5% (SC10), proving the robustness of the proposed SC configurations, especially against severe events. In contrast, for high-feedstock availability scenarios, the performance is mainly below average, but except for few scenarios, SC10 is preferable compared to BSC. A scenario-wise analysis for each of the 25 scenarios is conducted in Supporting Information S1 5.2.
- ❖ Environmental performance of the SC simulation, step 2: The environmental performance is represented by three LCA endpoints and the context-specific most important midpoints (global warming (M1), fine particulate matter formation (M5), terrestrial acidification (M7), human non-carcinogenic toxicity (M14), and land use (M15)). Figure 4 groups them according to their correlation to economic performance and resilience.
- ❖ Group 1: All endpoints and the midpoints M1, M5, and M7 positively correlate with consumer resilience (maintaining high EtOH demand fulfillment) and negatively correlate with profitability. Two clusters of SC configurations with similar performance were detected. Cluster 1 (SC0–SC7) performs up to 2.3% worse than BSC for these categories, mainly due to the comparatively lower EtOH production. Like the economic performance, the environmental performance in severe scenarios is mainly higher than the average results but still worse compared to BSC. For high-feedstock scenarios, the performance is even below average, with up to 2.9% worse (regarding E3). It increases with higher resilience satisfaction due to higher total EtOH production volumes substituting fossil petrol. In cluster 2 (SC8–SC9), the performance is almost equal to or better than that of BSC, while SC10 shows, on average, up to 2.1% (M5) and, in severe scenarios, up to 2.6% (M5) better performance.
- ❖ Group 2 (M14 and M15) shows an inverse behavior: With increasing demand fulfillment (resilience satisfaction), the environmental performance degrades. On the other hand, those categories positively correlated with the economic objective and negatively with consumer resilience. Cluster 1 has up to 3.3% (M14) higher performance and average capacity utilization rates because of a smaller total BR capacity. However, the environmental performance of SC0 in low feedstock scenarios is mainly below average, with up to only 2.4% (M15) due to less EtOH production of BSC compared to high-feedstock availability scenarios. With increasing residual performance from 80% to 90% and the resulting higher BR capacities, cluster 2 converges to the performance of BSC from 1.4 % (SC8) to 0.5% (SC9) for M14. However, capacity utilization rates remain high as the main objective is still the economic dimension. SC10 performs 1.4% regarding M14 and 1.7% regarding M15 worse than BSC and even worse in low feedstock scenarios as maintaining EtOH supply high leads to more land use required for SC operations compared to BSC providing less EtOH.
3.1 Evaluation of consumer and producer resilience
To assess the “actual” producer and consumer resilience for unanticipated scenarios, the resilience curves of the performance measures of average BR capacity utilization and average EtOH demand fulfillment (EtOH supply) are analyzed.
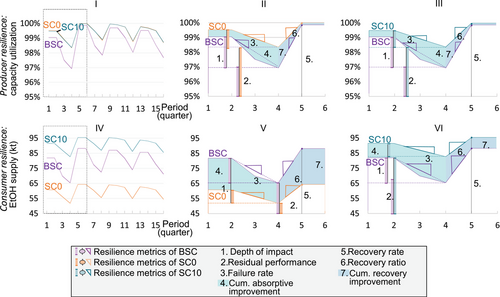
Figure 5 shows the curves for consumer and producer resilience for three representative network configurations: BSC represents the network without resilience considerations, SC0 represents planning under uncertainty without binding resilience constraint (0%), and SC10 represents planning under uncertainty with strong resilience constraint (100%).
- Producer resilience: Investigating the curves of SC0 and SC10, most metrics indicate a positive effect of integrating resilience into strategic SC modeling. When selecting SC0 instead of BSC, the absorptive capacity increases, which is indicated by the improved metrics depth of impact by 0.94%, residual performance by 1.42%, failure rate by 0.47%, and cumulative absorptive improvement by 2.86%. Figure 5 shows a smaller and less steep performance decline and a higher residual performance for SC0 than for BSC. SC10 shows a slightly higher positive effect on the metrics depth of impact (0.99% higher than BSC) and failure rate improvement to 0.50% compared to BSC, while residual performance is about the same for both SC0 and SC10. However, cumulative absorptive improvement, which aggregates the effect of the aforementioned metrics, is lower for SC10 than for SC0, wherefore SC0 is slightly preferable for improving the absorptive capacity from the producer perspective. Since the performance decline of SC0 and SC10 is lower than that for the BSC, less performance must be regained. Therefore, the metrics of restored performance and recovery rate are lower compared to BSC, leading to negative values. In contrast, the cumulative recovery improvement of SC0 (0.92%) and SC10 (0.89%) is higher than for BSC. Compared to SC0, SC10 is slightly preferable when aiming at the improved restored performance (+0.02%) but not regarding the recovery rate (−0.03%). SC0 is preferable again for maintaining BR capacity utilization high during recovery duration, with a slightly higher cumulative recovery improvement (0.03%). Analyzing the resilience metrics, SC0 and SC10 show very similar producer resilience.
- Consumer resilience: The difference between SC0 and SC10 becomes apparent from the consumer perspective. SC0 (V) performs worse than BSC in terms of residual performance (−13.53 kt) and cumulative absorptive improvement (−52.01 kt during the resistive and absorb duration) because of the smaller total BR capacity installed. However, due to a significantly lower production volume, the depth of impact (7.62 kt) and failure rate (3.81 kt) of SC0 are lower, whereas SC0 performs better in these metrics than BSC. Nevertheless, SC10 (VI) is preferable for improving the absorptive and adaptive/restorative capacity indicated by almost every single metric (besides restored performance). This is especially true for the metrics residual performance (+30.83 kt) and cumulative absorptive/recovery improvement (+92.33/+62.02 kt), which mainly characterize how well the level of demand coverage is maintained during the observation period.
| Producer resilience | Consumer resilience | |||||||
|---|---|---|---|---|---|---|---|---|
| Resilience metrics | Description | ∆(BSC-SC0) | ∆(BSC-SC10) | ∆(SC0-SC10) | ∆(BSC-SC0) | ∆(BSC-SC10) | ∆(SC0-SC10) | |
|
Effect on absorptive capacity |
Resistive duration | Duration until performance decline | No difference | |||||
| Absorb duration | Duration of performance decline | No difference | ||||||
| Depth of impact | Extent of performance decline | 0.94% | 0.99% | 0.06% | 7.62 kt | 7.70 kt | 0.08 kt | |
| Residual performance | Remaining performance | 1.42% | 1.43% | 0.01% | −13.53 kt | 17.30 kt | 30.83 kt | |
| Failure rate | Slope of performance decline | 0.47% | 0.50% | 0.03% | 3.81 kt | 3.85 kt | 0.04 kt | |
| Cum. absorptive improvement | Area between curves during absorb duration | 2.86% | 2.78% | −0.08% | −52.01 kt | 40.32 kt | 92.33 kt | |
|
Effect on adaptive/restorative capacity |
Endure duration | Duration of disrupted performance before recovery | No difference | |||||
| Recovery duration | Duration of recovery | No difference | ||||||
| Restored performance | Performance after recovery | −0.35% | −0,32% | 0.02% | −0.019 kt | −0.035 kt | −0.016 kt | |
| Recovery rate | Slope of recovery | −1.27% | −1.31% | −0.03% | −10.36 kt | −10.12 kt | 0.25 kt | |
| Cum. recovery improvement | Area between curves during endure and recovery duration | 0.92% | 0.89% | −0.03% | −42.61 kt | 19.41 kt | 62.02 kt | |
3.2 Performance under increasing disruption severity
This chapter investigates the effect of increasing disruption severity in light of climate-change-related extreme weather events (IPCC, 2022; Lesk et al., 2016) on the economic and environmental performance regarding global warming potential (GWP) of BSC, SC0, and SC10 (Figure 6). To reflect event severity for the randomly drawn feedstock scenarios, the extreme events are assumed to occur in years 2 and 4 and reduce the supply by a factor from 0% to 80%.
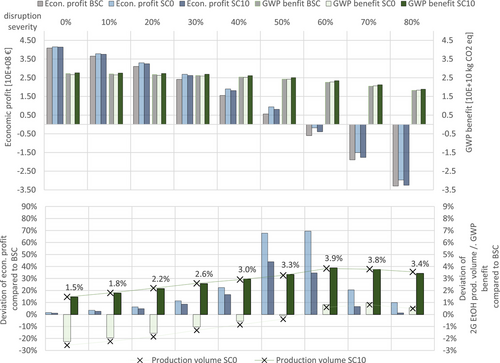
The environmental and economic performance decreases with rising disruption severity. In the economic dimension, SC0 consistently performs best. At a severity level of 60% (rather unrealistically high severity), the economic performance of SC0, SC10, and BSC turns negative. Around that point (50%–60%), the relative economic advantageousness of SC0 and SC10 compared to BSC peaks. For even higher severity, all configurations show further decreasing economic performance, while the relative economic advantage of SC0 and SC10 still remains but decreases again as this extreme level of low feedstock availability has not been anticipated in the planning step. The relative economic advantage of SC10 is especially decreasing as the investment in resilience actions weighs relatively high compared to the low economic revenue from EtOH production for high severity. The GWP benefit is more robust against increasing severity than the economic performance and consistently stays positive for each severity scenario and SC configuration. SC10 has the highest average GWP benefit, and its advantage, compared to the BSC, peaks at 3.9% for 60% severity before it decreases again. Similarly, the relative GWP disadvantage of SC0 compared to BSC decreases with increasing severity, and from 60% severity onward, SC0 has a higher GWP benefit than BSC due to available resilience actions like feedstock storage that covers shortages. Figure 6 further unveils a high correlation between the average EtOH production volumes of SC0 and SC10 and the GWP benefit. Figure 3 of Supporting Information S1 describes the performance of land use for increasing severity.
4 DISCUSSION
This article presents a two-step experiment design that integrates resilience considerations into the strategic planning of BioSC. The principal idea behind the experiment design is the anticipation of future feedstock disruptions already within strategic SC design. We, therefore, propose a stochastic MILP that optimizes the economic dimension, adheres to resilience constraints, and co-calculates the environmental dimension.
Step 1 takes strategic SC decisions on scenarios that represent the historical supply variance. Using representative scenarios that typify realistic future developments instead of randomly drawn scenarios from probability distributions is a common approach in SC decision-making (Maier et al., 2016). To account for the unknown future, step 2 simulates the performance of the resulting networks by drawing equally weighted random feedstock scenarios. We thereby validate the strategic SC decisions from step 1, which pursues the necessary shift toward the assessment of the “actual” resilience to unforeseen events called for in the literature (Bruckler et al., 2024; Inan et al., 2024; Reyers et al., 2022).
The feedstock scenarios used in this work reflect realistic supply fluctuations in promising bioeconomy regions such as Eastern Europe to investigate the ramifications of fluctuations in the BioSC performance. Our results indicate that scenario-based stochastic modeling that considers feedstock uncertainty and integrates deliberate resilience actions such as feedstock storages strengthens producer resilience. However, consumer resilience is not inherent, as it is not necessarily profitable for the producer. This requires an explicit consideration of resilience metrics within the model constraints, such as a minimum residual performance in EtOH demand coverage, to steer BioSC planning toward consumer resilience. The positive effect of explicitly incorporating consumer resilience in the supply chain planning is proven by the simulation of unforeseen supply fluctuations in step 2: with very high consumer resilience requirements (e.g., due to contracted supply rates), the resulting SC10 achieves a higher EtOH supply security (consumer resilience), higher economic benefit and higher environmental benefits for several impact categories (e.g., GWP) compared to the deterministic baseline SC. This observation is especially pronounced in severe disruption scenarios. Compared to SC0, the resilience curve of SC10 shows a higher residual performance and related metrics like cumulative absorptive/recovery improvement. Planning without the binding consumer resilience constraint (SC0) results in slightly higher economic benefit for the producer compared to SC10 and BSC and a noticeably lower EtOH supply security for the consumers. For practitioners such as SC planners, our results demonstrate the necessity of considering consumer resilience in SC modeling to fulfill the system objective (economic profitability) and customer needs simultaneously as the requirements for resilient BioSC.
Although the expected objective values and resilience metrics of the different SC configurations differ only slightly in the aggregated results, the scenario-wise analysis unveiled more pronounced economic and environmental benefits of resilient SC, especially for low feedstock supply scenarios. Eventually, the performance of different SC configurations is simulated for increasing disruption severity to investigate the impacts of ongoing climate change with increasing frequency and intensity of weather extremes. Similarly to Pizzol (2015), we confirm an increasing outperformance of resiliently planned networks over vulnerable networks in terms of GWP for growing disruption severity. However, we observe a nonlinear behavior of the economic and environmental (GWP) benefit of the resilient SC compared to the BSC, as the relative advantage peaks at 60% severity.
The bigger picture of considering resilience in BioSC modeling unveils heterogeneous patterns for different environmental categories, resilience, and the economic dimension. Consumer resilience is congruent with environmental goals of group 1, where considerable benefits (e.g., regarding global warming) can be realized by producing 2G EtOH to substitute petrol. In line with Pizzol (2015), this phenomenon particularly applies to BioSC when environmentally beneficial alternatives substitute fossil-based products. Policymakers can conclude from our study that strengthening consumer resilience of BioSC increases environmental benefits regarding several LCA categories and serves the goal of sustainable development. Therefore, incentivizing consumer-resilient SC planning contributes to a successful European bioeconomy. Conversely, resilience conflicts with environmental categories like land use (group 2), where the product performs worse than its reference. Due to the multiplicity of goals for sustainable development, it is not possible to equally satisfy all objectives simultaneously. Especially policymaking may be confronted with remaining conflicts between desirable aspects, which necessitates a transparent discussion of such limitations (European Commission, 2018).
A limitation of our approach is the small number of 25 different scenarios in the strategic SC planning. However, Shapiro and Philpott (2007) note that a high number of scenarios does not necessarily result in a solution closer to the “actual” optimum of the real problem. Since the exact prediction of future supply is impossible, we decided to base the strategic planning on explicitly chosen scenarios representing the historical range of feedstock availability in each region. Although some assumptions, such as the constant feedstock availability within a year (seasonality is considered by seasonal inventory holding costs at the farmer), the pattern of average feedstock availability in years 1 and 3 and explicit feedstock scenarios in years 2 and 4 are arbitrarily chosen to represent two isolated extreme years that do not interfere, the viability of our approach is proven by step 2.
The presented approach is specifically elaborated for the 2G bioethanol production in the EU, which limits drawing more general conclusions. Nevertheless, for SC planners, the approach can serve as methodological blueprint for other BioSC using straw or feedstock with similar properties as biorefineries could also produce other green chemicals like methanol to substitute fossil-based products. Also, for completely different SC, the integration of resilience constraints or objectives to strengthen consumer resilience might be possible and desirable to increase supply security. Conclusions about the environmental performance cannot be transferred to other SCs, as this depends heavily on the product under consideration. A possible extension would be an integration of different metrics to improve specific characteristics of the resilience curve according to the decision-maker's preference. As this work has not considered resilience metrics as maximizing objective function, multi-criteria approaches optimizing economic, environmental, and/or resilience aspects would provide deeper insights into relevant trade-offs for decision- and policymaking. Our research approach sets a basis for future research to derive a more standardized methodology for various application cases to prepare for the unforeseen in resilient planning.
AUTHOR CONTRIBUTIONS
Martin Bruckler: Conceptualization; methodology; formal analysis; data curation; writing—original draft; review and editing; visualization. Lars Wietschel: Conceptualization; methodology; formal analysis; writing—original draft; review and editing. Selina Sartor: Data curation; writing—original draft. Andrea Thorenz: Supervision; review and editing. Axel Tuma: Supervision; review and editing.
ACKNOWLEDGMENTS
We thank Christian Gahm for the fruitful discussion on the model conceptualization and the anonymous reviewers for their constructive and inspirational comments.
Open access funding enabled and organized by Projekt DEAL.
CONFLICT OF INTEREST STATEMENT
The authors declare no conflicts of interest.
Open Research
DATA AVAILABILITY STATEMENT
The data that support the findings of this study are openly available at Zenodo: 10.5281/zenodo.14622893.


