Analysis of air-inflated rubber dam for flood-fighting at the subway entrance
Funding information: National Natural Science Foundation of China, Grant/Award Numbers: 51878446, 52108335, 52171273; Technology Development Program of Tianjin Municipal Transportation Commission, Grant/Award Number: 2021-15; Tianjin Science and Technology Plan Project, Grant/Award Number: 20JCJQJC00220
Abstract
The air-inflated rubber dam is innovatively adopted in this paper for temporary flood-fighting at the subway entrance. Numerical studies using the FLAC2D software are carried out to investigate the behavior of the proposed structure. Laboratory model tests are also conducted to verify the accuracy of the numerical model. The results from the model tests agree well with those from the numerical analysis. Parametric studies are carried out to investigate the influences of the external floodwater head, inflated air pressure, and anchor position on the performance of the proposed air-inflated rubber dam. It is found that the external floodwater head reduces the tensile force but nonlinearly increases the height of the rubber dam. The inflated air pressure has no obvious effect on the cross-section of the rubber dam but heavily influences the ultimate flood-fighting height and tensile force. An optimum design line for the inflated air pressure of the rubber dam is provided. A deeper anchor position results in a smaller ultimate flood-fighting height. A rubber dam design with a lower anchor depth that has to satisfy the requirements of the anchor bolt is therefore concluded.
1 INTRODUCTION
Surface water flooding occurs due to an accumulation of rainwater or an overflow of water from water bodies, such as a river, lake, or ocean (Adelekan, 2016; Kaźmierczak & Cavan, 2011). Surface water flooding in urban areas has become one of the significant global issues threatening urban areas with not only massive physical floodwater disturbance but also socio-economical loss (Ali et al., 2019; Nye et al., 2011; Ochoa-Rodríguez et al., 2018). The urban subways are more easily inundated amid heavy surface water flooding. Local civilians or even armies often have to work together to place sandbags to build or reinforce the flood defenses for the protection of the subway entrance or other critical infrastructures (Akter et al., 2011; Lendering et al., 2016). However, the sandbags require too much manpower and time to fill or carry, which are limited during flood disasters. The flood barrier installed onto a doorway or into a gate of an underground structure is a more effective, reliable, and reusable method to provide ongoing protection.
An alternative option for flood-fighting is a geomembrane tube made of very low permeability membrane materials (Plaut & Suherman, 1998). The geomembrane tubes can be inflated promptly using air or water before the flood comes, folded, stored conveniently after the flood recedes, and reused multiple times (Sun et al., 2017, 2019). A series of analytical solutions have been proposed in recent years to analyze the cross-sectional equilibrium configuration and tensile force of the single geomembrane tubes resting on rigid foundations (Guo, Chu, Nie, & Yan, 2014; Guo, Chu, Yan, & Nie, 2014; Huong et al., 2002; Leshchinsky et al., 1996) and on deformable foundations (Guo et al., 2011, 2015; Plaut & Klusman, 1999; Plaut & Suherman, 1998). For geomembrane tubes with complex boundary conditions, it is often investigated using numerical methods through commercial software such as the Fast Lagrangian Analysis of Continua (FLAC) (Itasca Consulting Group, 2000) and the Particle Flow Code (PFC) (Itasca Consulting Group, 2008). In FLAC software, the flexible geomembrane tubes were usually modeled by linearly elastic beam elements (Guo et al., 2015; Kim et al., 2005). However, the bending effect or moment of the beam element is the limitation of this method. The PFC method was therefore used to conduct the stability analysis of geomembrane tubes with accessory structures (Sun et al., 2017, 2019).
Rubber dams can be treated as a special form of geomembrane tube (Guo et al., 2013) and are flexible cylindrical structures made of rubberized material, attached to a rigid base, and inflated by air or water. The rubber dam has the advantages of good seismic resistance, convenient construction, and good ecological environmental compatibility (Saleh & Mondal, 2001; Tam, 1999). The first rubber dam was developed in the mid-1950s for the Los Angeles Department of Water and Power. After that, it is widely used for water diverting and storage, irrigation, power generation, and urban river landscape construction (Islam & Kumar, 2016; Kumar & Islam, 2019; Tam, 1998; Zhang et al., 2002). Many researchers have analyzed the cross-sectional equilibrium configuration and tensile force of the water-inflated rubber dam (Tam, 1997; Zhang et al., 2002) and air-inflated rubber dam (Ghavanloo & Daneshmand, 2009; Streeter et al., 2015; Watson et al., 1999). Most of these solutions are based on the assumption that the rubberized material is weightless and inextensible to be simplified into a two-dimensional plane strain problem. The rubber dam is rested on a rigid foundation and is subjected to internal and external hydrostatic pressures. For water-inflated rubber dam, the configuration on the upstream side is often mathematically calculated as an arc of a circle, and that on the downstream side requires the use of elliptic integrals (Alhamati et al., 2005; Binnie, 1973; Ghavanloo & Daneshmand, 2010; Harrison, 1970). For the air-inflated rubber dam, the calculation of the configuration on the upstream side requires elliptic integrals, but that on the downstream side is an arc of a circle (Plaut & Cotton, 2005; Streeter et al., 2015; Watson et al., 1999).
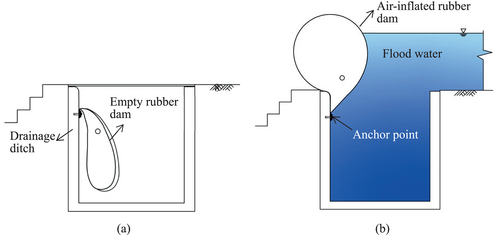
In this paper, the air-inflated rubber dam is innovatively adopted as a flood barrier at the subway entrance. The air-inflated rubber dam made of a waterproof membrane as a flood barrier at the subway entrance is schematically shown in Figure 1. The rubber dam is anchored on the vertical sidewall of the drainage ditch using the same method as a conventional rubber dam. With no flood alarm, the rubber dam is folded in the drainage ditch and manually covered by catch basin lids as shown in Figure 1a. The two ends of the rubber dam are anchored and well protected against the walls of the doorway of the subway entrance. When water flooding is coming, the rubber dam is taken out and inflated by air through outlets to resist flood from flowing into the subway as shown in Figure 1b. A facility such as an air pump is required to be well prepared before a rainstorm. The proposed structure is different from the often used water-inflated rubber dam, although they are both anchored into the rigid base. As the proposed air-inflated rubber dam is anchored on the vertical sidewall of the drainage ditch, it will be impacted down onto the surface of the rigid base, which is different from that of the conventional rubber dam. It has to be pointed out that the structure is better to be fully installed before the rainstorm, according to the weather report, because there is limited preparation time to remove the lid and place the rubber dam after the flood arrives. Numerical analyses using FLAC2D are conducted to investigate the cross-sectional configuration of the proposed air-inflated rubber dam as a flood barrier. Laboratory model tests were carried out to verify the accuracy of the numerical model. Parametric studies are carried out to investigate the influences of the external floodwater head, inflated air pressure, and anchor position on the cross-sectional configuration of the proposed air-inflated rubber dam.
2 LABORATORY MODEL TESTS
Laboratory model tests were carried out in a steel tank with dimensions of 1.5 m in length, 1.0 m in width, and 1.0 m in height as shown in Figure 2a. One side of the tank is manufactured using Perspex glass to have a clear view of the cross-section of the flood barrier as shown in Figure 2b. The rubber dam with its dimensions of 0.5 m in cross-sectional circumference and 1.0 m in length was formed by a 0.04-mm-thick clear membrane with a tensile strength of 720 N/m. The long edges of the membrane sheets were folded 2 cm wide and anchored into the upstream side of the acrylic base with an anchor spacing of 6 cm. The acrylic foundation was glued by a 5-cm-thick acrylic sheet with cross-sectional dimensions of 94 cm in length and 30 cm in width as shown in Figure 2a. Two ends of the rubber dam are folded and anchored onto the acrylic plates with an anchor line angle of 45° so that the rubber dam can deform freely after being loaded by the floodwater. Holes with designed positions were predrilled in the 3-cm-thick acrylic plates. The edges of the acrylic plates, or those contacting tank walls, are sealed using silicon glue.

Two ports were preinstalled on the side of the rubber dam, with one port connecting to the inflating pump and another connecting to the digital pressure gauge. The cross-sectional coordinates are measured by the laser displacement sensor (model: Keyence-IL-600) installed onto the frame as shown in Figure 2. The frame was fabricated by a 20 series T-Slot Aluminum Extrusion with a height of 27 cm. The two feet of the frame were stranded on the steel tracks, which make it possible to move freely along the surface of the tank. Since the laser displacement sensor cannot be used to measure the point beneath the water level, the DHG/18 model vernier height calipers were adapted to manually measure the coordinates of the cross-section beneath the water surface.
A total of five laboratory model tests are conducted, as summarized in Table 1. The rubber dam models were anchored on the upstream side of the acrylic foundation at 3 cm below its surface. The inflated air pressure and flood height are taken as variables. The model tests were carried out using the following procedure: (1) install the rubber dam in the designed position and connect the air pump and pressure gauge, see Figure 3a; (2) inflate the rubber dam with air to the designed air pressure, such as 1.0 kPa in Figure 3b; (3) fill tap water on the upstream side to the designed water level, such as 9.5 cm in Figure 3c; (4) measure the cross-section of the rubber dam; (5) repeat steps (3) and (4) by rising the water height till the water flow over the rubber dam of which defined as the ultimate flood-fighting height; (6) repeat steps (2) to (5) by inflating the rubber dam with another air pressure to get another ultimate flood-fighting height of rubber dam. It should be noticed that the floodwater has to be applied slowly and stably to generate a static water pressure condition. For the practice in the field, the complex natural conditions, such as dynamic flood conditions with substantial flow velocities and turbulence, and floating trash on the floodwater surface, could not be considered in the model setup.
| Model test no. | Anchor depth, D (m) | Pumping pressure, p0 (kPa) | Flood height, Hu (m) |
|---|---|---|---|
| 1 | 0.03 | 0.5 | 0.065 |
| 2 | 0.03 | 1.0 | 0.065 |
| 3 | 0.03 | 1.0 | 0.095 |
| 4 | 0.03 | 1.0 | 0.115 |
| 5 | 0.03 | 1.5 | 0.065 |

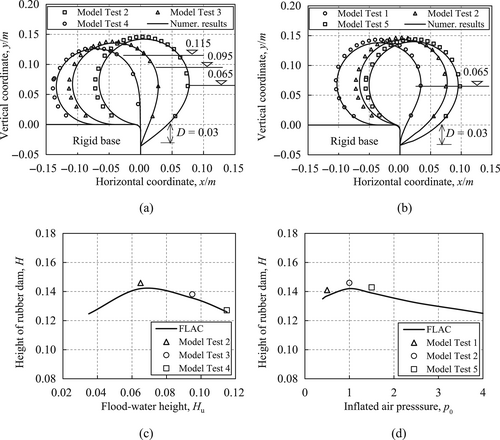
The cross-sections of the rubber dam models inflated by the air pressure of 1.0 kPa, anchored on the side wall with anchor depth D = 0.03 m and impacted by different flood heights of Hu = 0.065, 0.095, and 0.115 m are plotted in Figure 4a. With an increase in the flood height, the rubber dam is gradually pushed to the left-hand side with its height decreasing from H = 0.149 to H = 0.129 m, and contact width with the ground surface increasing from 0.009 to 0.0816 m. The cross-sections of the rubber dam inflated by the air pressures of 0.5, 1.0, and 1.5 kPa, impacted by a flood height of 0.065 m and anchored on the side wall with anchor depth D = 0.03 m are shown in Figure 4b. Due to the increase in the inflated air pressure from 0.5 to 1.5 kPa, the rubber dam becomes stronger to resist the flood. The contact widths with the ground surface decrease from 0.045 to 0.005 m. The inflated air pressure has no obvious effect on the cross-section of the rubber dam and decreases its height from H = 0.148 to 0.144 m, or 2.8%.
3 NUMERICAL ANALYSES
Numerical analysis was conducted using FLAC2D (Itasca Consulting Group, 2008) to simulate the cross-section and tensile force of the rubber dam. The grids of the numerical model are shown in Figure 5. The distance from the base surface to the anchor point is defined as the anchor depth D. The flood height is defined as the height of water above the rigid base and is denoted by Hu. The extreme condition is when the external floodwater flows over the air-inflated rubber dam, the height of which is written as Hul. The rubber dam was modeled by 110 beam elements. As no hydraulic pressure can be applied directly onto the beam elements in FLAC2D, the converted point load method is used by assuming that the beam element is straight in each calculation step. More details of the calculation method are discussed in Huong et al. (2002), Kim et al. (2014), and Guo et al. (2015).
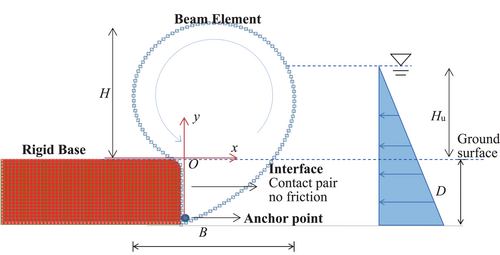
All nodes of the rigid base are fixed in their movement in all directions. The corner of the rigid base contacting with the rubber dam was set as an arc of a circle to reduce the force concentration. The frictions between the ground surface and the rubber dam and those between rubber dam beams are not considered in the numerical studies. The interface between the rubber dam and the rigid base surface was modeled using contact pair as shown in Figure 5. The numerical analysis was conducted with the following two steps: (1) build the initial equilibrium between gravity and air pressure; (2) apply the converted hydraulic node forces onto the beam element till the whole system was balanced.
4 VERIFICATION OF THE NUMERICAL MODEL
The accuracy of the proposed method was verified by comparing its results with those from the laboratory model tests. In the numerical analyses, the geometry parameters of the rubber dam, inflated air pressure, flood height, and anchor depth used in the model tests are taken as inputs. The unit weight of the filling tap water and membrane is 10 and 11 kN/m3, respectively. The elastic modulus and thickness of the membrane material are measured with their magnitudes of 4 × 10⁶ kPa and 4.0 × 10⁻⁵ m, respectively. The adapted length of the beam element is 4.55 × 10⁻³ m. The contact normal and shear stiffnesses are assumed as 1 × 10⁶ and 5 × 10⁵ kN/m, respectively, by referring to the studies conducted by Huong (2001) and Gao et al. (2022). All the parameters adapted in the numerical studies are summarized in Table 2.
| Name of parameter | Comparison with model tests | Parametric studies |
|---|---|---|
| Cross-sectional perimeter | 0.5 m | 1.0 |
| Length of the beam elements | 4.55E–3 m | 9.1E–3 |
| Thickness of beam element | 4E–5 m | 8E–5 |
| Unit weight of beam element | 11 kN/m3 | 1.1 |
| Elastic modulus of beam element | 4E6 kPa | 8E5 |
| Moment of inertia of beam element | 5.3E–15 m4 | 4.3E–14 |
| Contact normal stiffness | 1E6 kN/m | 4E5 |
| Contact shear stiffness | 5E5 kN/m | 2E5 |
| Unit weight of floodwater | 10 kN/m3 | 1.0 |
The predictions of the cross-sectional configuration of the rubber dam from numerical analyses are presented in Figure 4a,b to compare with those from the laboratory model tests. It can be seen that good agreements between the results from numerical studies and model tests are achieved. The cross-sections of the rubber dam measured by the laboratory model tests are slightly larger than those from numerical studies. One possible reason may be due to the stretching of the membrane from the anchor point due to the inflated air pressure and external flood action. The heights of the rubber dam are taken from Figure 4a,b and plotted versus floodwater head H and inflated air-pressure p0 in Figure 4c,d, respectively. Good agreements between the results from numerical studies and model tests are achieved with a maximum difference of less than 2.84%.
5 NUMERICAL PARAMETER STUDIES
Parametric studies were conducted to investigate the key factors that influence the cross-sectional configuration of the proposed rubber dam as a flood barrier. To avoid the influence of units, dimensionless parameters are used in numerical analyses. The normalization method adopted in this paper is the same as that used by Plaut and Suherman (1998), Kim et al. (2005), and Plaut and Stephens (2012). The geometry parameters H, D, and Hu are divided by L. The area of the cross-section is divided by L2. The pumping pressure and tensile force are divided by γwL and γwL2, respectively, where γw is the unit weight of floodwater. Therefore, the unit weight of the floodwater γw and the cross-sectional perimeter of the rubber dam L are set as 1.0 in the numerical model. Other parameters used in the FLAC2D model are summarized in Table 2.
5.1 Floodwater head
The cross-sections of the rubber dams inflated by the air pressure of 0.2γwL, anchored at the depth of 0.06L, and impacted by different floodwater heads are shown in Figure 6a. It was observed that the rubber dam is pushed down to the rigid base surface by the floodwater. With the increase of air pressure, such as p0 = 0.4γwL in Figure 6b, the rubber dam becomes strong enough to sustain the floodwater. A similar phenomenon can also be observed in Figure 6c,d.
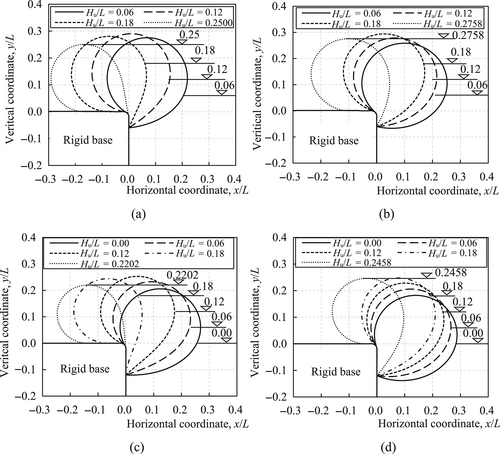
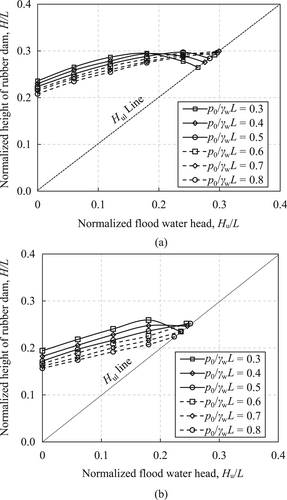
To further illustrate the effects of the floodwater on height changes of the rubber dam, the floodwater head versus height of rubber dams with an anchor depth of 0.06L and inflated by different inflated air pressure curves is plotted in Figure 7a. For air pressure with p0/γwL ≤0.5, the heights of rubber dams nonlinearly increase till reaching their maximum magnitudes and decrease till water flows over the rubber dam surface (45° degree line) with the increase of floodwater heads. This is because the cross-section configuration of the air-inflated rubber dam below the rigid base surface is squeezed by the floodwater and increased the height of the rubber dam, see the example with Hu/L = 0.06 to 0.12 in Figure 6a. With the increase of external floodwater head, the whole cross-section of the rubber dam is impacted down onto the surface of the rigid base, and therefore the height of the cross-section decreases, see the example with Hu/L = 0.12 to 0.25 in Figure 6a. For air pressure with p0/γwL ≥0.6, the air-inflated rubber dams are so strong to sustain the floodwater that cannot be fully impacted down to the surface of the rigid base. The extreme condition is when the external floodwater flows over the air-inflated rubber dam and Hul = Hu (45° degree line). A similar phenomenon is also observed in Figure 7b for a rubber dam with an anchor depth of 0.12L.
The tensile force T/γwL2 variations along the cross-sections of the rubber dams inflated by the air pressure of 0.4γwL, anchored in the depth of 0.06L, and impacted by different floodwater heads are shown in Figure 8. It demonstrates that the tensile force varies along the cross-section, keeps uniform along the section with no contact with the rigid base, and reduces contact sections between the rubber dam and rigid base. The anchor points sustain much of the load. The maximum tensile force of the rubber dam happens at the position with no contact with the base surface. The minimum magnitudes of the tensile force happen at the end position of the corner of the rigid base. As no friction is considered in the numerical model, one possible reason for the tensile force variations on the contact sections may be due to the effects of the bending moment of the beam elements. The tensile forces decrease with the increase in floodwater head. Similar phenomena are also observed from the tensile force variations of the rubber dams inflated by the air pressure of 0.4γwL, anchored in the position of 0.12L, and impacted by different floodwater heads as shown in Figure 9.


5.2 Inflated air pressure
The cross-sections of the rubber dams inflated by the air pressures of 0.2γwL and 0.4γwL and anchored at the depth of 0.06L are shown in Figure 6a,b, respectively. For the same floodwater head greater than Hu = 0.18L, the rubber dams inflated by the air pressure of 0.4γwL are stronger to support the floodwater than those inflated by the air pressure of 0.2γwL with their contact lengths at the rigid base surface of 0.013L and 0.076L, respectively. Similar phenomena are also observed from the cross-sections of the rubber dams anchored in the position of 0.12L and impacted by different floodwater heads shown in Figure 6c,d.
As shown in Figure 7a, for small floodwater heads, that is, ≤0.18L, the heights of the rubber dam decrease with increasing inflated air pressure. However, the differences are not obvious. Take the case of Hu = 0.12L for example, the air pressure increasing from 0.3γwL to 0.8γwL only results in the height of the rubber dam decreasing from 0.2866L to 0.2548L, or 11.1%. Although the increase of inflated air pressure has no obvious influence on the height of the rubber dam, it influences the tensile force along the cross-sections. As shown in Figure 10, the magnitudes of the tensile force along the section with no contact with the rigid base increase from 0.0385γwL2 to 0.0812γwL2, or 2.1 times, for air pressures increasing from 0.3γwL to 0.7γwL.

The ultimate flood-fighting heights of the rubber dam increase to the highest flood-fighting heads and then decrease depending on the inflated air pressure as shown in Figure 7a. The intersections between the 45°-line plot and the floodwater head versus the height of rubber dam curves mean the floodwater flow over the rubber dams which are their ultimate flood-fighting heights. The intersections clearly show the maximum ultimate flood-fighting height appears for a rubber dam inflated by air pressure 0.7γwL and anchored at the depth of D = 0.06L. For air pressures increasing from 0.3γwL to 0.7γwL, the ultimate flood-fighting heights increase only from 0.2646L to 0.2962L, or only 11.9%. Similar phenomena are also observed from the floodwater head versus the height of rubber dams with anchor depth of 0.12L curves as shown in Figure 7b. The ultimate flood-fighting heights increase from 0.2348L to 0.2518L, or 7.3%, for air pressure increasing from 0.3γwL to 0.5γwL. However, the ultimate flood-fighting heights with an air pressure of 0.6γwL to 0.8γwL are lower than those with an air pressure of 0.3γwL to 0.5γwL.
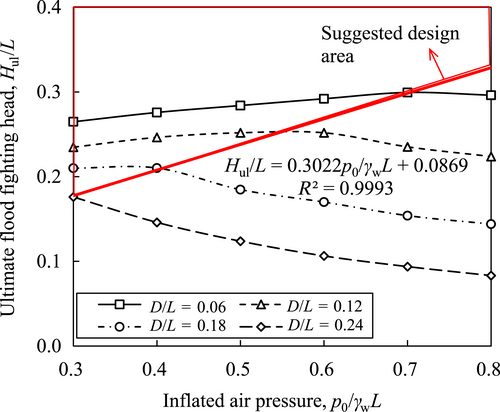
The inflated air pressure versus ultimate flood-fighting height curves for rubber dams anchored at different positions is further plotted in Figure 11. It revolves that the ultimate flood-fighting heights of the rubber dams have nonlinear relationships with the inflated air pressure. There exists an optimum inflated air pressure corresponding to the maximum ultimate flood-fighting height. Generally, the lower the anchor depth the higher the optimum inflated air pressure. For example, the optimum inflated air pressures are 0.7γwL and 0.3γwL for anchor depths of 0.06L and 0.24L, respectively. Connecting the maximum magnitudes of the ultimate flood-fighting height gives the optimum design line of inflated air pressure as shown in Figure 11. By considering the effect of inflated air pressure on the tensile force of the rubber dam, it is suggested to design the rubber dam with inflated air pressure located at the positions above the optimum design line, Hul/L = 0.3022p0/γwL + 0.0869.
5.3 Anchor depth
The anchor depth heavily influences the flood sustainability of the rubber dam for the flood barrier. It is easy to understand that the larger the anchor depth, the lower the cross-section above the rigid base, as shown in Figure 6. For a D/L increase from 0.06 to 0.12, the normalized heights H/L of the cross-section of the rubber dam inflated by the air pressure of 0.2γwL and impacted by Hu/L = 0.18 reduce from 0.2804 to 0.2440, or −13%. As shown in Figures 8 and 9, the deeper the anchor position is, the slighter the influence from the rigid base wall onto the deformation of the rubber dam. Due to this support from the rigid base wall, the tensile forces along sections of the rubber dam with no contact with the rigid base reduce related to the increase of the anchor depth.
The anchor depth has a heavy influence on the ultimate flood-fighting height. As shown in Figure 11, the deeper the anchored position is, the smaller the ultimate flood-fighting height that the rubber dam could sustain. For a rubber dam inflated by the air pressure of 0.4γwL, when anchor depths increase from 0.06L to 0.24L, the ultimate flood-fighting heights decrease from 0.2758L to 0.146L, or −47%. For a very deep anchor position, that is, D/L = 0.24, an increase in the air pressure can never increase the ultimate flood-fighting height. It is therefore suggested to design a rubber dam with an anchor depth as low as possible but must satisfy the requirements of the anchor bolt.
6 CONCLUSIONS
- The inflated air pressure has no obvious effect on the height of the rubber dam but heavily influences the ultimate flood-fighting height. It is suggested to design the rubber dam with inflated air pressure located above the optimum design line with its expression of Hul/L = 0.3022p0/γwL + 0.0869.
- The external floodwater head nonlinearly influences the height of the rubber dam. For p0/γwL ≤0.5, the height of the rubber dam nonlinearly increases till reaching its maximum magnitude and decreases till to the height when floodwater flows over the rubber dam. For p0/γwL ≥0.6, the height of the rubber dam nonlinearly increases till the height when floodwater flows over the rubber dam.
- The anchor depth heavily influences the flood resistance of the rubber dam. The larger the anchor depth, the smaller the ultimate flood-fighting height that the rubber dam could sustain. It is suggested to design a rubber dam with an anchor depth as low as possible but must satisfy the requirement of the anchor bolt.
- The tensile forces of the rubber dam are influenced by the floodwater head and the inflated air pressure. The tensile force keeps uniform along the section with no contact with the rigid base.
- The presented studies on the air-inflated rubber dam only considered the static water pressure featuring different floodwater heights. For practical applications in the field, complex natural conditions such as dynamic flood conditions with substantial flow velocities and turbulence and floating trash on the floodwater surface could not be considered.
- The proposed design chart is valid for the air-inflated rubber dam fabricated by thin-walled geomembrane material or the effect of its thickness could be ignored. For thick geomembrane material with higher stiffness, there is a possibility that when scaling the calculated charts are no longer valid. It is suggested to conduct small-scale or large-scale model tests to investigate their performance.
ACKNOWLEDGMENTS
The funding supports from the Tianjin Science and Technology Plan Project (20JCJQJC00220), the National Natural Science Foundation of China (51878446, 52171273, and 52108335), and the Technology Development Program of Tianjin Municipal Transportation Commission (2021-15) are gratefully acknowledged.
Open Research
DATA AVAILABILITY STATEMENT
Data sharing is not applicable to this article as no new data were created or analyzed in this study.


