An artificial neural network-hydrodynamic coupled modeling approach to assess the impacts of floods under changing climate in the East Rapti Watershed, Nepal
Abstract
Recurring floods have devastating consequences on the East Rapti Watershed (ERW), but effective mitigation/adaptation measures are lacking. This article aims at establishing a rainfall-runoff (RR) relationship; estimating depth and extent of inundation under climate change scenarios; assessing impacts on the socio-economy; and identifying and evaluating adaptation strategies in the ERW. Artificial Neural Network (ANN) was used to generate peak flows which were then entered into a hydraulic model to simulate inundation. Results were validated with field survey. The calibrated and validated RR and hydraulic models were fed with projected future climate (2021–2050) derived from multiple regional-climate-models to assess the changes in inundation. Results showed the peak discharge likely exceeds 10,500 m3/s at the ERW outlet in the extreme future flood scenario with corresponding inundation of 80 km2 and up to a depth of 11 m sweeping away over 1000 houses and 19 km2 of agricultural land in the critical areas. Constructing a 17 km long embankment in the critical areas along the right bank of the East Rapti River could reduce the flood spread by 35%, safeguarding 78% of the houses and saving 51% agricultural land compared with the scenarios without the embankment.
1 INTRODUCTION
Flood, a major natural disaster across the globe, accounted for 44% of all disaster events during 2000–2019 worldwide (UNDRR, 2020). About 41% of the total flood events during the period was observed in Asia alone impacting 1.5 billion people. Climate change (CC) is further exacerbating extreme events such as floods and exposing more population and property at risk (Fahad & Wang, 2019). Nepal ranks 30th in terms of vulnerability to flood risk, the problem being more prominent in the flat southern plains (UNDP, 2021).
Flood modelling and hazard mapping are well-established methods for effectively assessing associated damages. Moreover, they provide evidence-based information for decision-making on flood risk reduction and devising adaptation strategies (Schwarz et al., 2018). One-dimensional (1D) and/or two-dimensional (2D) models are used to simulate flood propagation depending upon the requirement, data availability and site conditions. 1D models are generally used for longer simulation periods in rivers where the flow is concentrated along the main river whereas 2D models find their application in areas where flow is likely to change direction and spread across a large area (Hutanu et al., 2020). Additionally, if only peak flow data is available, 1D steady flow modeling is preferred while 2D unsteady modelling is performed if continuous flood flow hydrographs are available as input to the model (HEC-RAS, 2020). Some popular hydrodynamic modelling software are HEC-RAS (Song et al., 2019), MIKE 11 (Chowdhury et al., 2020), FLO-2D (Mitra et al., 2021), LISFLOOD-FP (Rajib et al., 2020), etc. Among the many available models, HEC-RAS developed by U.S. Army Corps of Engineers has been widely used for flood hazard studies due to its flow modelling capability in 1D, 2D, and combined 1D-2D domain (Aryal et al., 2020; Song et al., 2019). In Nepal, several flood studies have applied 1D HEC-RAS in rivers such as Babai (Bhattarai et al., 2019), Kankai (Khadka & Bhaukajee, 2018), Daraudi (Banstola & Sapkota, 2019) and West Rapti (Devkota et al., 2020), to list a few.
Hydrodynamic models require flood hydrographs as the basic input. Hydrological models are generally used to generate these flood hydrographs at points of interest along the stream. Physically based distributed and conceptual models can predict the rainfall-runoff (RR) process at the catchment scale fairly accurately. However, they are not applicable to basins where detailed data and parameters are unavailable (Lin et al., 2019). In such cases, data driven models like Artificial Neural Network (ANN) can be used to optimally model the RR process in catchments even with insufficient input data. Such models have been found to be handy where runoff is the only output needed by developing empirical relations between the input (for example, precipitation and temperature) and output (water level and discharge) variables without considering the physics behind the RR process (Lin et al., 2019; Wu et al., 2021). Due to such an ability, application of ANNs have increased over the years for RR modeling (Wu et al., 2021).
Climate change is expected to impact the hydrology by increasing the intensity of extreme precipitation events, leading to higher risk of flooding (Tabari, 2020). A study by MoFE (2019) projected increase in mean temperature of Nepal by 0.9 to 1.1°C and 1.3 to 1.8°C in the 2030s and 2050s, respectively, as a result of CC. Additionally, precipitation is projected to increase by 11% to 23% by 2100. Various studies have modeled RR responses to CC (Hakala et al., 2018; Skoulikaris et al., 2019). Outputs from Global Climate Models (GCMs) or Regional Climate Models (RCMs) are corrected for biases while projecting future climate of an area. Among the various methods available for bias correction, Quantile Mapping (QM) is considered as a relatively better technique for improving the performance of climate models (Tegegne et al., 2017). Studies like Dhaubanjar et al. (2019) and Marahatta et al. (2021) have applied this technique in CC studies in different basins of Nepal. However, climate projections are approximations which vary considerably with location and physiographic regions, thus, warranting careful interpretation of their results.
Climate-induced flood risks can be minimized by suitable adaptation strategies that are cost-effective and environment-friendly. Adaptation options can be structural and nonstructural (Martinez et al., 2021). Structural adaptation measures include flood embankments, culverts and improved drainage, among others; embankments are the most popular (Ward et al., 2017). Nonstructural measures like national adaptation plans, awareness raising, hazard and vulnerability mapping and zoning, community-based adaptation plans and land use planning have been used in different studies (Devkota et al., 2016; Devkota & Bhattarai, 2015; Gonzalez et al., 2016; Martinez et al., 2021; Thapa-Parajuli et al., 2018). In Bangladesh and Nepal, awareness raising, early warning systems and community-based flood management have been seen to be quite successful (Dewan, 2015). Though there are various potential adaptation strategies documented in literature, suitability to a particular area is largely governed by its cost-effectiveness and preferences of the local community (Nofal & Lindt, 2020).
Despite abundant recent studies on future hydro-climatic projections due to CC (e.g., Bhattarai et al., 2022; Dhaubanjar et al., 2019; Marahatta et al., 2021), their impacts on flood inundation at the watershed scale are still limited in Nepal. Consequently, very few studies (Dewan, 2015) have quantified the flood impacts on the socio-economic sectors. Studies testing and recommending both structural and nonstructural flood adaptation strategies are scarce in Nepal. Furthermore, sparse meteorological stations pose an additional challenge in flood modelling. Majority of the past flood studies have used conventional hydrological models (e.g., HEC-HMS, SWAT, etc.) to simulate the RR process in ungauged river basins of Nepal despite difficulties in validation because of lack of sufficient observed data. However, recent global trend of RR modeling is the application of data-driven techniques such as ANN as a convenient alternate compared to the conventional approach (Meresa, 2019; Saez et al., 2018). Thus, this study tries to fill this research gap in Nepal by utilizing data-driven technique for RR modeling of ungauged/sparsely gauged watershed under changing climate, assessing socio-economic impacts of inundation, and proposing both structural and nonstructural measures for the flood-impacted communities. Therefore, the overarching objective of this study is to assess the impact of CC on inundation and its implication on the socio-economy of one of the data scarce watersheds—East Rapti Watershed (ERW)—located in south-central Nepal. This study aims to answer the following research questions: (i) What will be the extent and depth of inundation in ERW under current and future climatic scenarios? (ii) What are the potential impacts of inundation on the socio-economic system of ERW?, and (iii) What are the possible adaptation strategies to minimize such impacts? The results will definitely be beneficial to the ERW in particular while the applied methodological framework consisting of the ANN-hydrodynamic modeling will find its applicability in other partly gauged flood-prone basins of the region.
2 MATERIALS AND METHODS
2.1 Study watershed
The ERW has a drainage area of 3202 km2 (Figure 1a). In a study of 25 river basins of Nepal, out of the 41 extreme flood events that have occurred in those basins in between 1991 and 2015, 40% were in ERW (ADPC, 2016). ERW has reported 143 flood events that affected 3460 people and 139 died in these events during the same period. Among these, the most devastating 10 events reported during 1991–2015 caused damage of over one million Nepalese Rupees (NRs.) in 2015 prices. These evidences indicate that the ERW is a flood-prone basin which requires appropriate flood management and adaptation strategies for risk minimization.
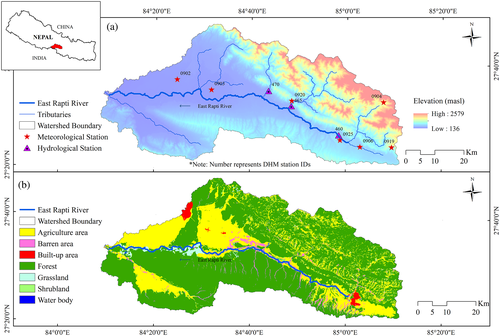
The elevation of the watershed varies from 136 to 2579 m above the mean sea level. Although the ERW lies immediately below the Nepal Himalayas, it is not a snow-fed watershed. There are seven meteorological and three hydrological stations administered by the Department of Hydrology and Meteorology (DHM), Government of Nepal within the ERW. The average annual rainfall of the basin is about 2008 mm. Similarly, the average maximum and minimum temperatures are 30°C and 17°C, respectively. Out of the three gauging stations, Rajaiya (DHM Index no. 460) is located in the uppermost part of the basin (Figure 1a). The observed instantaneous maximum discharge at this station is 1010 m3/s in the baseline period (1979–2010). The most dominant land use/cover (LULC) of ERW is forest (66%) while agricultural land covers about 28% of the catchment area (Figure 1b).
2.2 Methodology
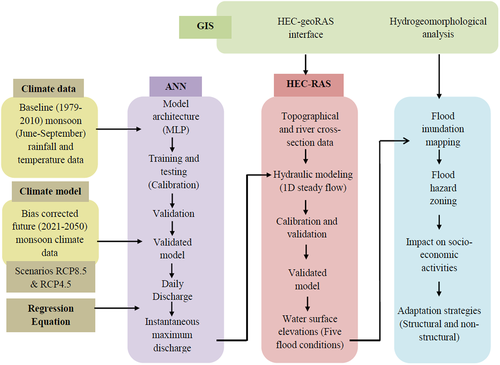
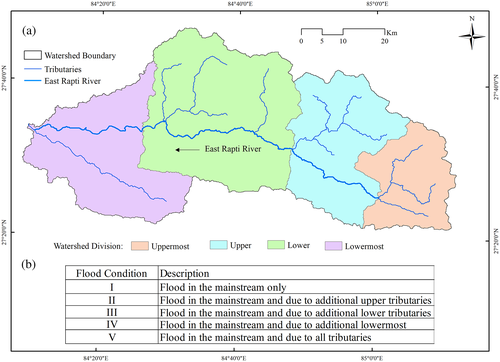
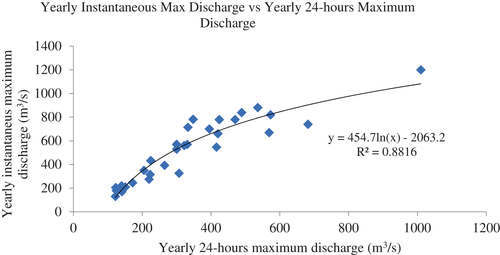
The methodological framework used in this study is shown in Figure 2. The study started by developing a rainfall-runoff (RR) model applying ANN to estimate daily monsoon (June–September) discharge using precipitation and temperature as the input variables. The daily discharge was converted into instantaneous maximum discharge by using regression equation developed from the plot of yearly 24-h maximum discharge versus yearly instantaneous discharge available at Rajaiya for the baseline period. The next step included flood modeling using HEC-RAS to calculate the flood extent and depths along the river for the baseline period followed by inundation mapping. The study watershed was divided into four sections (Figure 3a). Then, future climate data was derived from climate models and fed into the flood model considering five flood scenarios (Figure 3b) to assess the impact of CC on the ERW.
Details of the data used in this study are shown in Table 1. The historical hydro-meteorological data was obtained from DHM. Future climate data was derived from CORDEX-SA. The Land-use/cover (LULC) map was obtained from ICIMOD (2013) and the SRTM 90 m digital elevation model (DEM) was obtained from USGS.
| S. No. | Data | Description | Resolution | Source |
|---|---|---|---|---|
| 1. | Rainfall | Daily observed rainfall | 7 stations (1979–2014; daily) | DHM, Nepal |
| 2. | Discharge | Daily observed streamflow | 1 station (1979–2014; daily) | DHM, Nepal |
| 3. | Max and min temperature | Daily observed maximum and minimum temperatures | 2 stations (1979–2014; daily) | DHM, Nepal |
| 4. | Land use | Land use/cover map | 30 m × 30 m grids (for 2010) | ICIMOD (2013) |
| 5. | Future rainfall and temperature | Daily projected values in grids | variable (1979–2014; daily) | 9 RCMs from CORDEX-SA |
| 6. | DEM | Digital elevation model | 90 m × 90 m grids | USGS (earthexplorer.usgs.gov) |
2.2.1 Rainfall-Runoff (RR) modelling
Unavailability of a gauging station at the basin outlet made the application of conventional hydrological models such as HEC-HMS and SWAT, among others, difficult. Hence, data driven ANN model was used to establish the RR process of the study basin. ANN model was trained, tested and validated using daily rainfall and temperature as input data and discharge as the output for the monsoon period. The same model was used to estimate the flows at downstream confluences of the East Rapti River with the other smaller tributaries assuming a similar RR pattern throughout the study watershed.
Multi-Layer Perceptron (MLP) with feed forward back propagation is a popular architecture in RR modelling for simulating base flow, dynamic RR process and river flow simulation (Dastjerdi et al., 2019). Among the many available learning rules for the neutral network, delta learning rule is faster and accurate in deep learning and therefore has been used in many recent studies (Shaikh, 2020). To introduce nonlinearity into the output of a neural, variants of activation function can be used. In recent literatures, Rectified Linear Unit (ReLU) are used as activation fuctions for a neuron in MLP (Hawamdeh & Kuisi, 2021).
MLP usually consists of three layers: the input layers, where data are introduced to the network; hidden layer, where the data are processed (can be one or multiple) and the output layer, where the results for given inputs are produced (Saez et al., 2018). Selection of appropriate number of hidden layers depends on the complexity of both input and output parameters and has significant role in the quality of learning. Previous studies have shown that two hidden layers is sufficient to model complex rainfall-runoff process (Saez et al., 2018). Therefore, in this study, MLP architecture (Figure 4) with one input layer, two hidden layers, and an output layer trained with a back-propagation algorithm is used to predict the discharge. The hidden layers were trained using delta learning rule and ReLU as transfer function in python.
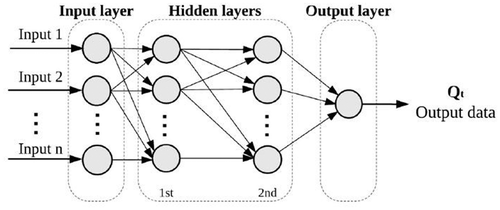
The ANN model was trained using monsoon data (June to September; calibration from 2004 to 2009) at daily resolution and then validated for the monsoon season of 2010 to 2013. Six indicators, namely, Nash-Sutcliffe Efficiency (NSE), coefficient of determination (R2), index of agreement (d), standard deviation ratio (RSR), percent error in peak flow (PEPF), and percent bias (PBIAS) have been used to access the performance of the ANN model which is shown in Table 2 (Moriasi et al., 2007). The calibrated ANN model was used to generate daily discharges at the points of interest along the river reach for flood modelling.
| Indicators | Equation | Performance rating* | |||
|---|---|---|---|---|---|
| Very good | Good | Satisfactory | Unsatisfactory | ||
| Nash-Sutcliffe efficiency (NSE) |
|
0.75–1 | 0.65–0.75 | 0.50–0.65 | <0.50 |
| Coefficient of determination (R2) |
|
0.75–1 | 0.65–0.75 | 0.50–0.65 | <0.50 |
| Index of agreement (d) |
|
0.90–1 | 0.75–0.90 | 0.50–0.75 | <0.5 |
| Standard deviation ratio (RSR) | 0.00–0.50 | 0.50–0.60 | 0.60–0.70 | >0.70 | |
| Percent error in peak flow (PEPF) | <15 | 15–30 | 30–40 | >40 | |
| Percent bias (PBIAS) | <±10 | ±10 to ±15 | ±15 to ±25 | >±25 | |
- Note: *Performance rating criteria adopted from (Moriasi et al., 2007); = observed discharge at the ith time; = mean observed discharge of the total simulation time period; = simulated discharge at the ith time; = mean simulated discharge of the total simulation time period; = number of timesteps in the total simulation period; = observed peak during the total simulation period; = simulated peak during the total simulation period; = Total observed flood water volume; = total simulated flood water volume.
2.2.2 Flood frequency analysis
A regression analysis between the 24-h mean discharge and the yearly instantaneous maximum discharge available at Rajaiya for the baseline period (1979–2010) was carried out. The same equation was used to estimate the instantaneous maximum discharge for the future period (2021–2050) assuming that flood characteristics of the basin remains constant in the future too. Furthermore, flood frequency analysis was performed assuming Gumbel distribution to determine the flood magnitudes of 2, 5, 10, 25, 50, and 100 years return periods.
2.2.3 Hydraulic modelling
One dimensional steady flow simulation was performed to calculate the surface profile under a mixed flow regime in HEC-RAS (HEC-RAS, 2020) and flood extent maps were prepared using HEC-GeoRAS. During model calibration in HEC-RAS, the values of Manning's n (0.05, 0.04, and 0.035 for left over bank, main channel and right over bank, respectively) were assigned based on the recommendations of Gautam and Dulal (2013) for the study basin. In most steady 1D flow computations, downstream boundary condition is set as normal depth (i.e., uniform depth) because it allows the user to provide an energy slope and automatically calculate the depth using Manning's equation (Banstola & Sapkota, 2019; Bhattarai et al., 2019). Thus, downstream boundary condition was provided as normal depth in this study. Generally, 5- and 100-year return period floods are considered as frequent and rarer events, respectively in flood studies (Hawker et al., 2020). In this study, simulation was carried out in HEC-RAS for 5- and 100-year return period flood scenarios in both the baseline and future periods for comparision. As the ERW is only partly gauged and continuous instantaneous maximum discharge for past years were unavailable, recent available instantaneous maximum flood discharge data of the 12th July, 2019 flood was considered for validation. Initially, an attempt was made to validate the model by making pixel-to-pixel comparisons of the flood maps with LANSAT 8 (250 m resolution, scene ID = “LC81410412019195LGN00”, accessed date: August 15, 2021) and MODIS (500 m resolution, MOD13Q1, accessed date: August 14, 2021) satellite data (Enea et al., 2018). But it could not be done because of lack of error-free satellite data for this region for the selected flood event. Also, Sentinel satellite imagery was explored but no data were available for download for the selected region and the flood event. Hence, a field survey method of validation was adopted in which the inundation map as a result of the July 12, 2019 flood (i.e., 2350 m3/s) in the East Rapti River was generated by the model and verified by visual inspection of the watermarks and based on consultation with the local communities. A similar validation approach has been used satisfactorily in other parts of Nepal especially when observed data are not available or very scarce (Devkota et al., 2020; Sarchani et al., 2020). Field survey was conducted by visiting accessible sites (outside of the national park area which is under high security) during the COVID 19 lockdown period in September 2020 by the study team led by the first author.
2.2.4 Future climate projection
Bias corrected nine RCMs using QM under two RCP scenarios (8.5 and 4.5) recommended by (Ray et al., 2022) were used to project future climate for the study basin. The projected data was input to the RR model to generate future daily discharge which was used in the hydraulic model simulation to generate inundation maps. Two RCMs (out of the shortlisted nine) for which the flood peaks of RCP8.5 were larger than RCP4.5, were selected. From the prepared inundation maps, the flood value corresponding to the maximum flood extent was considered as the extreme flood condition.
2.2.5 Impacts of floods on socio-economy
To assess the potential flood impacts of CC in the future, inundation depth was divided into four classes (low: <1 m depth; medium: between 1 and 2 m; high: between 2 and 3 m; danger: >3 m) based on the severity. Usually inundation of depth <1 m would be easy for adults to wade through, and thus there would not be any life-threatening damage potential. Flood depths of more than 1 m pose a significant risk to human life and property. While, single-storied houses get inundated and could be washed away (which is the case for most rural houses) if flood depth exceeds 3 m. Therefore, it was found rational to consider these classes of inundation depth for our study. Similar values have been taken in several other studies of Nepal and also recommended by the Rainfall-Runoff manual of Australia (Ball et al., 2019; Bhattarai et al., 2019).
Additionally, impact of floods on the livelihood of the community was assessed by estimating the number of households submerged, inundated land and agricultural production of the study basin. These were derived for the baseline and future from the inundation map of ERW in the extreme flood conditions. Consequently, the direct economic loss due to inundation of summer crops (June–September) in the baseline and future periods were determined by multiplying the market rate of the crops per hectare and total agricultural land inundated. Critical areas were then marked based upon the maximum number of houses and largest agricultural land inundated in the extreme flood condition. The economic loss in those critical areas as a result of historical and future inundation scenarios were compared.
2.2.6 Evaluation of adaptation strategies
To deal with the potential flood damages, various structural and nonstructural adaptation strategies were reviewed (please refer to Section 1: Introduction). The most commonly used structural measure for disaster risk reduction is embankment due to its cost-effectiveness in areas with high population and asset concentrations (Ward et al., 2017). Therefore, the effect of addition of embankments in the critical areas on the right bank of the mainstream was simulated for extreme flood condition in future using the HEC-RAS model. The total number of houses that can be safeguarded, agricultural land reclaimed and the corresponding economic value of the assets due to the construction of embankments in critical areas in the projected future climatic conditions were determined. Flood forecasting and warning, flood risk management, public participation, and other nonstructural approaches are frequently employed to mitigate flood risk across the world (Gonzalez et al., 2016; Martinez et al., 2021). Some viable nonstructural adaptation measures which might be suitable for the study area are recommended at the end derived from literature review.
3 RESULTS
3.1 ANN model performance
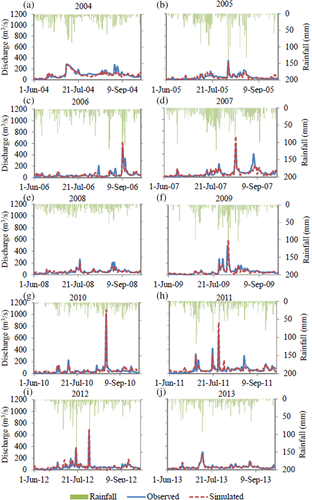
Details of the ANN model calibration, simulation results and model performance are shown in Table 3. The statistical evaluation for calibration and validation phases showed satisfactory performance of the model for all the indicators (Table 2) as recommended by Moriasi et al. (2007). It can be seen that Nash-Sutcliffe Efficiency (NSE) ranges from 0.55 (0.7) to 0.75 (0.9) in calibration (validation) phase. Similarly, the variation of coefficient of determination (R2) in calibration (validation) is from 0.56 (0.74) to 0.79 (0.91). In addition, index of agreement (d) in calibration (validation) ranges from 0.84 (0.93) to 0.92 (0.98). Similarly, standard deviation ratio (RSR) in calibration (validation) varies from 0.5 (0.31) to 0.67 (0.55). Likewise, the range of percentage error in peak flow (PEPF) in calibration (validation) is from −23.95% (6.31%) to +25.47% (+29.79%). Correspondingly, percentage bias (PBIAS) in calibration (validation) phase ranges from 0.36 (0.29) to 13.48 (8.15). Interestingly, the validation results were found to be better because of the good correlation between rainfall and runoff than for calibration (Figure 5).
| Phase | Year | Statistics* | PEPF% | R2 | d | NSE | RSR | PBIAS |
|---|---|---|---|---|---|---|---|---|
| Calibration | June–September 2004 | Value | 3.3 | 0.56 | 0.84 | 0.55 | 0.67 | 5.83 |
| Rating | Very good | Satisfactory | Good | Satisfactory | Satisfactory | Very good | ||
| June–September 2005 | Value | 10.61 | 0.63 | 0.88 | 0.62 | 0.61 | 2.22 | |
| Rating | Very good | Satisfactory | Good | Satisfactory | Satisfactory | Very good | ||
| June–September 2006 | Value | −17.61 | 0.72 | 0.92 | 0.71 | 0.54 | 3.67 | |
| Rating | Good | Good | Very Good | Good | Satisfactory | Very good | ||
| June–September 2007 | Value | −23.95 | 0.71 | 0.91 | 0.67 | 0.57 | 2.65 | |
| Rating | Good | Good | Very good | Good | Good | Very good | ||
| June–September 2008 | Value | 25.47 | 0.79 | 0.91 | 0.75 | 0.5 | 0.36 | |
| Rating | Good | Very good | Very good | Very good | Very good | Very good | ||
| June–September 2009 | Value | −22.73 | 0.63 | 0.88 | 0.60 | 0.63 | 13.48 | |
| Rating | Good | Satisfactory | Good | Satisfactory | Satisfactory | Good | ||
| Validation | June–September 2010 | Value | 6.31 | 0.91 | 0.98 | 0.90 | 0.31 | −8.15 |
| Rating | Very Good | Very Good | Very Good | Very Good | Very Good | Very Good | ||
| June–September 2011 | Value | 29.79 | 0.74 | 0.93 | 0.70 | 0.55 | −7.81 | |
| Rating | Good | Very Good | Very Good | Very Good | Good | Very Good | ||
| June–September 2012 | Value | 14.82 | 0.86 | 0.96 | 0.82 | 0.43 | −4.99 | |
| Rating | Very Good | Very Good | Very Good | Very Good | Very Good | Very Good | ||
| June–September 2013 | Value | 13.64 | 0.79 | 0.94 | 0.79 | 0.46 | −0.29 | |
| Rating | Very Good | Very Good | Very Good | Very Good | Very Good | Very Good |
- Note: *Performance criteria adapted from Moriasi et al. (2007).
- Abbreviations- d: index of agreement; NSE: Nash-Sutcliffe efficiency; PBIAS: percentage bias; PEPF: percentage error in peak flow; R2: coefficient of determination; RSR: standard deviation ratio.
3.2 Regression analysis of flood peaks
The regression equation derived from the plot of maximum of the yearly 24-h mean discharge versus instantaneous maximum discharge available at Rajaiya for the baseline period is shown in Figure 6. The logarithmic regression equation with R2 of 0.88 shows a good prediction capability. Thus, the same equation was used to predict the instantaneous maximum flow in the future period as well.
3.3 Validation of hydraulic model
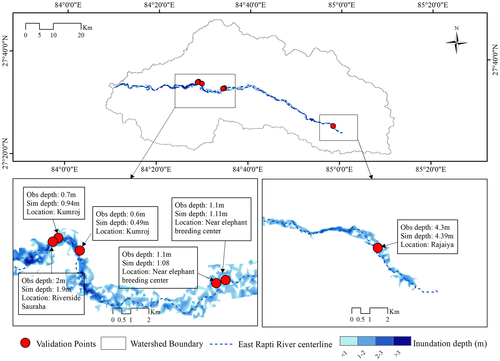
During the field survey, high water marks of the July 12, 2019 flood event was observed and their depths were measured at six locations, this flood being the most recent in the ERW. In addition, local people were consulted for cross-verification of this information. The observed and simulated water depths were compared with the model simulated inundation map (Figure 7). The problem of inundation is significant in the downstream part of the ERW where major portion of the Chitwan National Park is located. Due to high security in this protected area and unavailability of access road in downstream part of the river, the observation points were limited to six locations. In the uppermost validation point (Rajaiya gauging station), it is seen that the simulated depth (4.39 m) and observed depth (4.3 m) are very close. As flood spreads in the downstream sections, the difference between the observed and simulated flood depth becomes significant with the maximum deviation of 0.24 m at Kumroj (immediate upstream location of riverside Sauraha). Thus, a good agreement is seen between the observed and simulated values at the considered locations indicating the model is well validated.
3.4 Future climate and discharge
It can be seen from Table 4 that the future maximum temperature for RCP4.5 (RCP8.5) is projected to increase by 6.3% (7.5%) as compared with the baseline period. Also, the future minimum monsoon temperature is projected to decrease by 0.6% in both RCP scenarios. Likewise, maximum monsoon rainfall is projected to increase for RCP4.5 (RCP8.5) by 25.4% (29.7%). Two RCMs (MPI_REMO and NOAA_RegCM4) show increase in RCP8.5 flood peaks compared with the RCP4.5 case for most of the return period floods. Generally, high emission scenarios lead to higher values of mean daily (and corresponding instantaneous maximum) discharge and therefore, MPI_REMO and NOAA_RegCM4 were selected for hydraulic modelling. The peak discharge in RCP8.5 is likely to double from the RCP4.5 value in the case of RCMs MPI_REMO and increase by 60% for NOAA_RegCM4 for a 100-year return period flood.
| Scenarios | RCMs | 24-h rainfall (mm) | Daily temperature (°C) | Instantaneous peak flood discharge (m3/s) | |||||||||||
|---|---|---|---|---|---|---|---|---|---|---|---|---|---|---|---|
| Time period | Max | Avg | Min | Monsoon | Max | Avg | Min | 2 years | 5 years | 10 years | 25 years | 50 years | 100 years | ||
Baseline (1979–2010) |
212 | 10 | 0 | 1263 | 40 | 29 | 18 | 3430 | 4510 | 5225 | 6128 | 6798 | 7463 | ||
| RCP4.5 | CNRM_CCAM | % Change in (2021–2050) during monsoon period | −26.8 | −1 | 0 | −2.6 | 2.1 | 0.5 | −0.6 | 58 | 41 | 33 | 27 | 23 | 19 |
| CSIRO_RegCM4 | −8.4 | 6 | 0 | 4.2 | 5.7 | 2 | 0.1 | 59 | 48 | 44 | 39 | 37 | 35 | ||
| MPI_REMO | 20.1 | 1.7 | 0 | 0.1 | 4.8 | 0.9 | −0.4 | 72 | 50 | 40 | 30 | 25 | 21 | ||
| NOAA_RegCM4 | −0.2 | 10.9 | 0 | 9.1 | 1.6 | 0.7 | 0 | 72 | 44 | 33 | 22 | 15 | 10 | ||
| ACCESS_CCAM | −28.5 | 3.6 | 0 | 2 | −1.3 | 1.6 | 0.1 | 51 | 41 | 37 | 33 | 31 | 29 | ||
| CNRM_RegCM4 | 22.4 | 15 | 0 | 13.2 | 6.3 | −0.2 | −0.4 | 51 | 49 | 48 | 47 | 47 | 46 | ||
| HadGEM_RA | −3.1 | 27.5 | 0 | 25.4 | 3.7 | 3.1 | −0.2 | 60 | 46 | 40 | 35 | 32 | 29 | ||
| IPSLLR-RegCM4 | −15.5 | 6.5 | 0 | 4.8 | 2.5 | 0.9 | −0.5 | 45 | 45 | 45 | 45 | 46 | 46 | ||
| MPI_CCAM | −26.2 | 5.8 | 0 | 4.1 | 1.6 | 0.8 | −0.5 | 44 | 38 | 36 | 34 | 32 | 31 | ||
| RCP8.5 | CNRM_CCAM | −39.8 | 1.5 | 0 | −0.2 | 0 | 1.1 | −0.4 | 42 | 37 | 35 | 33 | 32 | 31 | |
| CSIRO_RegCM4 | −16.8 | 6.6 | 0 | 4.9 | 2.6 | 2.4 | −0.5 | 52 | 46 | 44 | 42 | 41 | 40 | ||
| MPI_REMO | 40.5 | 9.5 | 0 | 7.7 | 3.6 | 1.3 | −0.6 | 64 | 54 | 50 | 46 | 44 | 42 | ||
| NOAA_RegCM4 | −8.6 | 9.2 | 0 | 7.5 | 1.2 | 1.6 | 0.1 | 70 | 46 | 36 | 26 | 21 | 16 | ||
| ACCESS_CCAM | −33.9 | −0.9 | 0 | −2.5 | −0.3 | 2.8 | 0.1 | 43 | 37 | 35 | 32 | 31 | 30 | ||
| CNRM_RegCM4 | 47.6 | 12.9 | 0 | 11.1 | 7.3 | 0.1 | 0 | 57 | 46 | 42 | 38 | 35 | 33 | ||
| HadGEM_RA | 3.9 | 31.9 | 0 | 29.7 | 6.8 | 3.6 | −0.2 | 61 | 46 | 40 | 34 | 30 | 27 | ||
| IPSLLR-RegCM4 | −8.5 | 3.6 | 0 | 1.9 | 1.6 | 1.2 | −0.4 | 39 | 41 | 41 | 42 | 42 | 43 | ||
| MPI_CCAM | 10.2 | 7 | 0 | 5.2 | 0.2 | 1.5 | −0.3 | 46 | 35 | 30 | 25 | 23 | 20 | ||
- Note: Italics number indicates higher RCP8.5 values as compared with RCP4.5; bold faced RCMs are selected for hydraulic modeling.
3.5 Climate change impacts on inundation
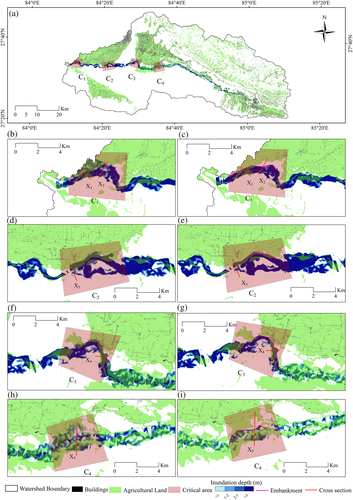
The change in inundation extents in the future due to CC corresponding to the two selected RCMs with respect to the baseline period for the considered five flood conditions are summarized in Table 5. Flood condition I indicates flood in East Rapti mainstream only while flood condition V indicates simultaneous floods in the mainstream as well as all its tributaries. It is evident that a 5-years (100-years) return period flood is expected to cause a decrease (decrease) in the inundation extent by 1% (1%) for flood condition IV of NOAA_RegCM4 under RCP4.5 and increase by 17% (13%) for flood condition V of MPI_REMO under RCP8.5. The maximum inundation extent (79.85 km2) is expected to occur in the future for a 100-years flood, RCP8.5, flood condition V of MPI_REMO. Considering the 100-years flood in RCP8.5 for condition V of MPI_REMO, the inundation extent is expected to increase by 17% for the “high” inundation level (depth <3 m) and by 3% for the “danger” inundation level (depth >3 m) compared with the baseline period (Table 6). Additionally, Figure 8a shows that inundation level for the “>3 m” depth class is mostly confined within the channel boundary in the upstream section and spreads towards the banks in the downstream section. From the inundation map prepared for baseline and future extreme flood conditions, the total number of inundated houses were estimated to be 679 and 1173 and agricultural land covering 29 and 34 km2, respectively, with the maximum inundation depth of over 11 m in the river channel.
| Return period (yr) | Flood condition | Baseline extent (1979–2010) (km2) | RCP4.5 | RCP8.5 | ||||||
|---|---|---|---|---|---|---|---|---|---|---|
| Extent (km2) (MPI_REMO) | % change | Extent (km2) (NOAA_RegCM4) | % change | Extent (km2) (MPI_REMO) | % change | Extent (km2) (NOAA_RegCM4) | % change | |||
| 5 | I | 50 | 55 | 9 | 54 | 7 | 54 | 8 | 54 | 7 |
| II | 59 | 68 | 14 | 67 | 13 | 68 | 15 | 67 | 13 | |
| III | 53 | 60 | 13 | 59 | 11 | 60 | 13 | 59 | 11 | |
| IV | 50 | 55 | 9 | 50 | −1 | 55 | 8 | 50 | 0 | |
| V | 61 | 71 | 17 | 70 | 15 | 72 | 17 | 71 | 16 | |
| 100 | I | 57 | 62 | 8 | 61 | 6 | 61 | 6 | 62 | 9 |
| II | 69 | 75 | 9 | 72 | 5 | 76 | 10 | 74 | 7 | |
| III | 61 | 67 | 11 | 66 | 9 | 68 | 12 | 68 | 12 | |
| IV | 57 | 62 | 8 | 56 | −1 | 61 | 7 | 58 | 1 | |
| V | 71 | 79 | 11 | 76 | 8 | 80 | 13 | 78 | 10 | |
| Flood condition | RCP | Time period | Return period (years) | Flood extent in depth class (km2) | ||||
|---|---|---|---|---|---|---|---|---|
| <1 m | 1–2 m | 2–3 m | >3 m | Total | ||||
| Baseline | 5 | 10.9 | 12.7 | 12.4 | 25.1 | 61.1 | ||
| 100 | 8.8 | 12.4 | 13.4 | 36.0 | 70.6 | |||
| V | 4.5 | % Change in future (MPI_REMO) | 5 | 34.2 | 28.4 | 14.7 | 4.4 | 16.8 |
| 100 | 39.8 | 25.7 | 17.1 | −2.8 | 11.3 | |||
| 8.5 | 5 | 33.5 | 28.5 | 15.3 | 5.5 | 17.2 | ||
| 100 | 35.8 | 22.2 | 17.1 | 3.0 | 13.1 | |||
3.6 Socio-economic implications of inundation
Based on the number of inundated houses and the extent of agricultural land, four impacted areas were marked and classified as uppermost, upper, lower and lowermost critical areas. In the baseline and future periods, 677 and 1073 houses while 17 and 13 km2 of agricultural land respectively fall under critical areas. Considering the average number of people per household to be 4.5 (CBS, 2016), total number people affected by inundation in the baseline and future periods are respectively 3056 and 5278. Similarly, if the economic gain from agricultural land is considered as NRs. 55,000/ha (MoALD, 2014), direct economic loss of NRs.145 million and NRs. 170 million can be expected, respectively, under extreme flood conditions. This is a huge loss for a developing country like Nepal.
3.7 Evaluation of structural adaptation strategies
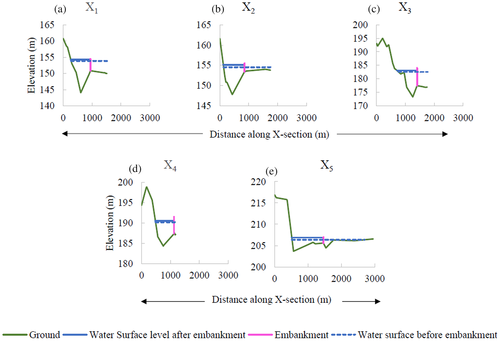
To simulate how potential flood damage in the future could be minimized, embankments were added to the right bank of the East Rapti River in the hydraulic model in critical areas where settlements are dense (Figure 8). As the length and height of embankments varied in each critical area, maximum and minimum heights of embankments were noted (Table 7). Thus, about 17 km long embankment with maximum height ranging from 4 to 11 m were provided in different critical areas. The hydraulic model was then run for the extreme flood condition scenario. The flood inundation maps focused on the critical areas are presented in Figure 8. Addition of embankments resulted in reduction of flood extent with increased flood depths as shown in Figure 9. The future flood extent reduced by 35% because of the embankment. To estimate the average cost of the embankment, average of maximum heights of embankment, that is, 7 m (average of 4 and 11 m) in all critical areas were considered. The average cost of an Reinforced Cement Concrete (RCC) embankment is Nepalese Rupees (NRs1) 20,000 per cubic meter in the study basin (DOR, 2018). If a cantilever RCC embankment 17 km long having top width 0.5 m and base width 3.6 m (0.5 x average height of embankment) is considered, then the total cost of construction will be about NRs. 5 billion. The addition of embankment can reclaim a total of 1579 ha land, which is worth about NRs 9.3 billion (DOLMA, 2021). In addition, 832 houses with 3744 affected people and 6 km2 of agricultural land equivalent to NRs. 33 million worth of direct agricultural produce can be saved in the future with the construction of embankments. Details of the flood extent, numbers of houses and agricultural land inundated in the baseline period and that can be saved due to the construction of embankment in the critical areas in the future are shown in Table 8.
| Critical zone | Embankment at right bank | ||
|---|---|---|---|
| Max. height (m) | Min. height (m) | Length (km) | |
| Uppermost | 4 | 1 | 4 |
| Upper | 8 | 2 | 5 |
| Lower | 11 | 4 | 4 |
| Lowermost | 5 | 2 | 4 |
| Critical zone | Future period (extreme flood condition) | |||||||||||
|---|---|---|---|---|---|---|---|---|---|---|---|---|
| Baseline period (extreme flood condition) | Flood extent (km2) | Inundated houses (no.) | Inundated agricultural land (km2) | |||||||||
| Flood extent (km2) | Inundated households (no.) | Inundated agricultural land (km2) | Before embankment | After embankment | % saved | Before embankment | After embankment | % saved | Before embankment | After embankment | % saved | |
| Upper-most | 6 | 166 | 4 | 7 | 3 | 52 | 199 | 2 | 99 | 5 | 2 | 52 |
| Upper | 6 | 364 | 2 | 6 | 4 | 25 | 397 | 94 | 76 | 2 | 2 | 31 |
| Lower | 6 | 77 | 1 | 7 | 6 | 18 | 291 | 75 | 74 | 2 | 1 | 50 |
| Lower-most | 4 | 70 | 1 | 7 | 4 | 41 | 186 | 70 | 62 | 3 | 1 | 66 |
| Total | 22 | 677 | 8 | 27 | 17 | 35 | 1073 | 241 | 78 | 12 | 6 | 51 |
Compared with the baseline, flood extent, number of houses likely to be inundated and agricultural land are expected to increase in the critical areas by 28% 58%, and 44%, respectively, in the future due to CC. If embankment is constructed during the baseline period as well, significant cultivable land and houses can be saved as in the future.
4 DISCUSSION
In this study, the ANN model configuration is based on five inputs (Rt, Rt−1, Rt−2, Tmax, Tmin) for a single output (Q) which showed satisfactory results in calibration and validation phases. Due to limited hydro-meteorological data within the study area, variation in the input (e.g., with the addition of humidity, wind, sunshine) were not possible. However, the ANN model could be set for multiple set of inputs to enhance the performance of the model. Rajurkar et al. (2002) compared the ANN configurations for three cases (single input, two inputs and three inputs) and concluded that the performance capacity of ANN model increases as the number of inputs increases. Also, ANN model performance in this study shows that it can be used in watershed with no gauging stations at the outlet when the hydrological response does not change much throughout the watershed. This is comparable to the studies by Meresa (2019) and Kassem et al. (2020) which revealed that ANN approach is suitable to predict runoff in ungauged catchment with a reasonable accuracy. We have assumed that the value of peak discharge at any day t is a function of the maximum rainfall for consecutive 3 days (Rt, Rt−1, Rt−2) and temperature (Tmax and Tmin) of the flood day t. As a result, high total monsoon rainfall and high average monsoon temperature for any RCM may not always necessarily result in higher peak discharge.
Validation of the hydraulic model in ungauged river basins is quite challenging. When water level and/or discharge gauging stations are available at the basin outlet or confluence with another river downstream, direct validation of the model is done using the observed data. However, in the case of ungauged or partly gauged basins, the model is indirectly validated by either satellite image or field survey. A recent study by Tamiru and Dinka (2021) evaluated HEC-RAS model by comparing inundation map generated in HEC-RAS and water body delineated from remotely sensed LANDSAT 8 imagery in lower Baro Akobo River basin in Ethiopia. Similarly, several other studies evaluated flood inundation maps from MODIS and ALOS satellite images in flood affected areas in Myanmar and Pakistan (Amarnath & Rajah, 2016; Khaing et al., 2019). In our case, while an attempt was made to perform satellite image validation by comparing LANDSAT 8 and MODIS data with the model simulated results, due to high cloud cover (above 80%) validation was not possible. As a result, this study resorted to field-based indirect validation. Similar postflood field measurement-based validation have been previously applied in poorly gauged river basins in Greece (Sarchani et al., 2020), and in Nepal (Devkota et al., 2020) with satisfactory results.
Results of our study show that the future monsoon climate is projected to be warmer and wetter due to increased average monsoon temperature and rainfall. On the other hand, the maximum monsoon rainfall is projected to decrease. Additionally, the frequency of occurrence of rainfall is expected to increase in the monsoon. These can be attributed to the increase in number of rainy days with rainfall of low intensity. Such results are highly dependent on the choice of the RCMs and their underlying uncertainties. Similar findings have been reported by recent flood studies in Thuli Bheri (Aryal et al., 2022), and Karnali basins of Nepal (Dhaubanjar et al., 2019) underscoring the high uncertainties related to the choice of climate data, hydrological model and the time horizon of analysis.
The instantaneous maximum peak flood is projected to increase in future resulting in increased flood extent in different climate scenarios compared with the baseline. Also, flood extent of low inundation depth decreases and high depth increases as flood magnitude increases in the future. Similar results are depicted in southern Italy (Apollonio et al., 2020), South China (Li et al., 2019), West Rapti (Devkota et al., 2020) and Karnali River basins (Aryal et al., 2020) in western Nepal. Moreover, we can infer from the results that plain areas with higher flow velocity despite low flood depths can be severely damaged due to possible scouring, bank cutting and washing away of physical infrastructure and belongings.
Our results show that settlements at high elevation (upper part of ERW) were not affected by floods as much as the lower reach settlements. The narrow gorges through which the river flows in the upstream area are generally bounded by cliffs on the sides and the settlements are usually located on highlands. As flood emerge into low plains from these high elevations, they spread out with abrupt gradient decrease resulting in altered river courses and sweeping of settlements and agricultural land in the floodplains. Because of this very reason, most of the critical areas are in lower reach of ERW. This study is confined to three aspects of socio-economic impact of flooding: impacted population, number of houses and agricultural land considering the direct economic losses. However, there are various other impacted sectors as well such as infrastructure, type of houses (public and private), roads, electricity, among others that could be areas of future research for the ERW as in the study of River Benue of Nigeria by Abubakar et al. (2020).
The effectiveness of addition of embankment on right bank of the East Rapti River as a structural adaptation measure was analyzed based upon the current data. However, population growth, rate of urbanization, change in agricultural practices, crop production rates and their economic values, among many other socio-economic and biophysical dimensions are highly dynamic in nature which evolve continuously over time. Assumption of constant landuse for the future is a limitation of this study. Modelling all these aforementioned aspects to analyze their impacts on the flood induced damage either in silo or comprehensively could be future research arenas.
Community Based Disaster Management Project piloted by United Nations Development Program in during 2006–2008 implementing nonstructural flood adaptation measures in the Chitwan and Makwanpur districts of ERW has been considered a successful project (UNDP, 2008). More recently, ERW was one of the core areas where Flood Risk Management Project was implemented by the Asian Development Bank (ADB, 2020). The project recommended construction/improvement of flood shelters be designed and implemented through community-based consultation. Moreover, based on literature review (Devkota et al., 2016; Devkota et al., 2020; Devkota & Bhattarai, 2015; Thapa-Parajuli et al., 2018) nonstructural adaptation strategies such as communicating, community-based flood management planning taking care of affected people, exchanging help, and coordinating with government, among others are predicted to be suitable for the ERW.
Overall, we can infer that the aggregation of a data-driven models like ANN and hydrodynamic flood models is conveniently applicable for flood studies with fair accuracy in data-scarce watersheds. Similar modelling approach including analysis of output of various climate models, modelling of structural adaptation measures, and socio-economic analysis can be helpful for CC impact assessments due to inundation in other ungauged watersheds of Nepal and other regions with similar RR characteristics.
5 CONCLUSION
- The mean monsoon temperature and rainfall of the ERW were 10°C and 1263 mm, respectively, for the baseline period. However, an increase of 0.4°C in the temperature and 98 mm in the precipitation is projected in the future under RCP 8.5 based on MPI_REMO data. Additionally, maximum rainfall is projected to increase by 40.5% and the magnitude of a 100-year return period flood is expected to increase to 3134 m3/s with flood extent to 80 km2 and a maximum inundation depth of over 11 m corresponding to the RCP 8.5 scenario.
- The extreme flood in baseline (future) period is likely to inundate a total of 712 (1173) houses with 3056 (5278) inhabitants and 29 km2 (34 km2) agricultural land, among which 9 km2 (13 km2) and 679 (1073) houses were seen to fall under critical areas. The economic loss in baseline (future) period due to inundation of agricultural land in ERW and the critical areas were estimated to be NRs 145 million (170 million) and NRs 45 million (65 million), respectively.
- The use of embankments as structural adaptation measure on the right bank of critical zones of the East Rapti River could be effective in saving 3744 people living in the floodplain areas and NRs 33 million equivalent of agricultural land in the future by decreasing the flood extent by 35%. In addition, effectiveness of the structural measures can be increased by implementing community-based nonstructural adaptation measures.
This study assessed CC impacts using an ANN-RR model and two forcing variables (rainfall and temperature), neglecting other near-surface atmospheric factors, which might affect runoff generation. Evaluating impacts of using multiple variables on the results could be an area of future research. This study assesses inundation impact on limited socio-economic sectors. Incorporating other multidisciplinary dimensions may be an extension of this study. Overall findings of this study suggest that a combination of data-driven hydrological and hydrodynamic models can be a promising approach for flood impact assessments under changing climate in data-scarce watersheds of Nepal and beyond.
ACKNOWLEDGMENTS
We would like to acknowledge Mr. Bharat Bhatta for his support in the ANN work; Ms. Riyanka Pokhrel for her help in the field survey; the Department of Hydrology and Meteorology (DHM), Government of Nepal and Ms. Anupama Ray for the hydro-climatic data and Mr. Sunil Adhikari for his constant support throughout the research.
ENDNOTE
Open Research
DATA AVAILABILITY STATEMENT
Data available on request from the authors.


