Evaluation of evacuation difficulty of urban resident during storm water-logging based on walking experiment
Funding information: Project of Education Department of Jilin Province, Grant/Award Number: JJKH20200428KJ; Project of Science and Technology Department of Jilin Province, Grant/Award Number: 20200403074SF
Abstract
Frequent water-logging disasters in cities are serious threats to urban residents. When a water-logging disaster occurs, it is essential for residents to evacuate, taking refuge to reduce losses and to ensure safety. This project studied evacuation difficulty for residents in the Daoli District of Harbin during storm water-logging. Starting from external factors and internal factors influencing resident evacuation, the study screened indicators for assessing the difficulty of evacuation during urban rainstorm water-logging, constructed an evaluation index system and evaluation models to assess the difficulty of evacuation of residents. Results showed that residents in the vicinity of the three streets, Xinyang Road and Minqing Street, Zhaolin Street and Anfeng Street in the study area have difficulty in evacuation in the case of a 5-year torrential rain disaster. Other areas had little impact. In a 100-year torrential rain situation, it is more difficult for residents in Stone Road Bridge, the intersection of Market Street and Toulong Street, the intersection of Touloing Street and Zhaolin Street, the intersection of Anfa Street and JingweiErdao Street, and Anguo Street, while other areas were not seriously affected. The research results can provide new ideas for the study of evacuation of residents during urban water-logging, and can also provide decision-making basis for disaster prevention and mitigation for urban emergency departments.
1 INTRODUCTION
In recent years, urban water-logging disasters are more and more frequent, and the losses are more and more serious. In order to reduce the losses caused by these disasters, measures must be put in place to prevent and mitigate. Evacuation is an important part of disaster prevention and mitigation. However, residents and the environment affect the efficiency of evacuation. When urban water-logging occurs, when the road water reaches 20 cm in depth, it is more difficult for residents to walk on the road. When road water is more than 30 cm deep, travel by bicycles and cars become more difficult (P. Chen et al., 2012). In addition, evacuation is also affected by resident's education, age, and disaster experience. Therefore, it is of great significance to evaluate the difficulty of evacuation during urban water-logging for the safety of residents and for emergency departments.
First, clarifying the concepts of flood and water-logging disaster are different. Flood refers to water bodies where rivers, oceans, lakes, and other water levels exceed a certain level, threatening the safety of the relevant areas, and even causing water flow disasters. Water-logging disaster refers to the disaster caused by short-term rainstorm, causing large areas of water on urban roads and causing loss of personnel, finance and materials due to heavy rain or concentrated rainfall. The mechanisms of the disaster are different. Water-logging has become a major urban disaster in China. Among them, the impact of road water on residents' travel and refuge is the most concerned problem for residents and also an important factor affecting their refuge. Generally speaking, most predecessors take buildings and housing property as disaster bodies to carry out risk assessment of rainstorm and water-logging. From the perspective of emergency shelter, it has become a research focus to discuss the degree of impact of road water on the residents' evacuation process by combining their own properties with experiments (Q. Chen et al., 2019; Peng et al., 2014). An improved criterion in the form of incipient velocity has been proposed for human stability in floodwaters, and it is specifically for deep-water where toppling instability generally occurs, and it can account for the posture of leaning forward of a human body in floodwater and the process of pivoting around heels at instability.
Moreover, the previous equation of buoyancy force was modified using the parameters of human body structure for a typical American or European in ergonomics.
There are more studies reported abroad, especially Japan where urban flood occurs more frequently. Therefore, there are many studies on residents' asylum. For example, walking safety threshold was determined using the hydraulic experiment combined with experimental walking in the water under different water depth scenarios (Beibei et al., 2012). Nakayama and colleagues simulated flood scenarios, Japan's Zhongshan and other land for flood scenario simulation and evaluated the possibility of walking in different scenarios during evacuation. The indicators mainly include resident's awareness of shelter during water-logging, past water-logging experience, flood risk awareness, water depth, body height and flow rate (Kohei et al., 2010). Ishigaki and colleagues simulated basement water-logging scenarios to assess the difficulty of resident evacuation based on hydraulic principles using three factors (water pressure, depth, and flow rate) (Li et al., 2002). Baba et al. used large-scale hydraulic indoor experiments to determine the relationship between the difficulty of resident evacuation and sanctuary boundaries, time required to escape in the car and water depth (Shinji, Kenichiro, & Kazuhide, 2002). Kohei et al. selected five aspects (e.g., flow velocity, water depth, shelter distance, walking speed, and resident awareness of danger) to assess the difficulty of resident evacuation (Shinji, Kenichiro, Kazuhide, et al., 2002). Domestic and international studies found that difficulty assessment is an indispensable part of resident evacuation, and also an important measure to reduce evacuation time and improve the evacuation operation. In addition to environmental factors, factors of residents also crucially influence the difficulty level of evacuation (Sun, 2007). For example, the difficulty of evacuation is influenced by age, occupation, education, awareness of disaster risk, and experience of disasters are the main factors that cause residents to evacuate. Therefore, it is necessary to understand the asylum-seeking behavior and explore the rule of evacuation behavior in order to correctly evaluate the difficulty of evacuation.
In addition, some scholars explored the stability of people in water from the perspective of the stability of people in floods. However, there is a difference between urban water-logging disaster and flood disaster, and the velocity of road water in water-logging disaster is far less than that of flood water. Therefore, this method provides relevant reference for this paper (Q. Chen et al., 2019; Musolino et al., 2020).
In summary, there is no empirical research on the difficulty of evacuation of residents in China. The evacuation difficulty of residents is rarely evaluated based on experiments and resident evacuation behavior. In order to provide services to refuges during urban water-logging, this paper analyzed external and internal factors influencing resident evacuation, screened evacuation difficulty indexes together with resident evacuation drills for urban rainstorm water-logging, constructed an evaluation index system and an evaluation model. Provide shelter services for urban rainstorm and water-logging residents.
2 OVERVIEW OF THE STUDY AREA
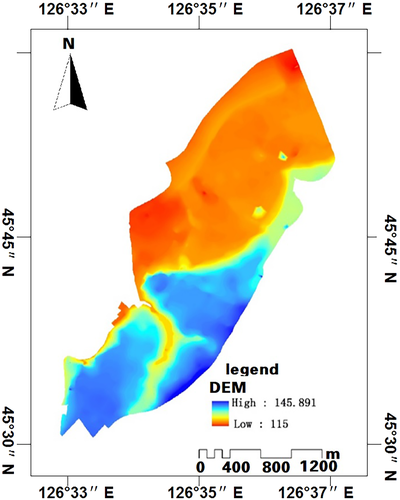
Daoli District of Harbin is located between 45°30′–47′ N and 126°08′–38′ E (Figure 1). Overall, the terrain is high in the south and low in the north and west. The landforms in the urban area of south bank belong to the type of accumulation and erosion accretion. The inland river cuts the Songhua River terraces and the floodplain, forming an undulating landscape. The average precipitation is 545.7 mm annually, and heavy rainstorms occur mostly in July and August, accounting for 84%–88% of the total number of heavy rains. During the flood season from June to September, precipitation accounts for 80% of the annual precipitation, of which 52% were in July and August. During this period, it is easy to form a torrential water-logging disaster, which is a great threat to the life and belongings of residents.
3 RESEARCH METHODS AND DATA SOURCES
3.1 Experiment of walking in water
3.1.1 Purpose of experiment
In recent years, urban torrential rains have become increasingly serious, causing serious threats to the lives and property of urban residents. Therefore, when a disaster occurs, residents should take refuge actions promptly to reduce the impact of the disaster. In order to determine the impact of water depth and flow rate on walking in the water during water-logging, this investigation analyzed the external factors affecting the evacuation of residents, that is, the difficulty threshold of walking in the water. At the same time, the experiment provides a basis for the selection of the index system for assessing the difficulty of evacuation during urban rainstorms.
3.1.2 Experimental site, equipment, and participant selection
Experimental site
The test site is the Water Engineering Safety and Disaster Prevention Engineering Laboratory of the School of Water Conservancy and Environmental Engineering of Changchun Institute of Technology. The laboratory focuses on water engineering safety and disaster prevention, and conducts applied basic research. The laboratory has undertaken a series of projects in the National Science and Technology Support Program and major provincial and ministerial research funds.
Experimental equipment
The water flow velocity and water depth during the experiment was controlled at experimental control station with the computer console and monitored by the experimenter. The glass water channel has a specification of a groove width of 1.0 m, a groove length of 30.0 m, and a model flow rate of 300 L/s. The water channel consists of three parts: the inlet section, the working section, and the tailgate control section. It is mainly used for the section model experiment of water flow and the measurement of water depth and flow velocity.
Experimental participants
This experiment was mainly to determine the critical value of the difficulty of participant walking in the water, and to measure the walking speed of participants in the water. The selected subjects were elementary school students, young people, middle-aged and the aged. The sizes of these participants were the average for their respective age group in the country (see Table 1). During the experiment, participants walked toward upstream and downstream in the water, respectively. The water depth, flow velocity and walk difficulty were measured under the experimental conditions. The threshold of difficulty was determined.
| Type | Age | Weight (kg) | Height (cm) | Number of people | Walking distance (m) | Experimental method |
|---|---|---|---|---|---|---|
| Elementary school students | 8–12 | 30–45 | 125–155 | 10 | 15 | Downstream, countercurrent walk |
| Young (https://www.baidu.com/link?url=3XpQVy2jwzWbG_cxOn3QXHJpTXXRKPDJ_V9-ut8188xfyApmP8yBLgXHQBKfxAKbOoLd2FZ_oHtZtBu5YR0T8p2OZtSVwcXewoHrbM81aFS&wd=&eqid=ca7b5f4f00008a4500000002611108ee) people | 18–24 | 55–75 | 168–175 | 10 | 15 | Downstream, countercurrent walk |
| Middle-aged | 30–50 | 55–75 | 168–175 | 10 | 15 | Downstream, countercurrent walk |
| The aged | 55–70 | 55–75 | 168–175 | 10 | 15 | Downstream, countercurrent walk |
3.1.3 Experimental design
- Participants walked in experimental stream. Ten participants for each age group, including elementary school students young people middle-aged and the aged were selected to conduct the walking test. They are about the average of their respective age groups in the height, weight, and physical condition as those in the same age groups in the country.
- The Water Engineering Safety and Disaster Prevention Engineering Laboratory in the College of Water Conservancy and Environmental Engineering of Changchun Institute of Technology was selected as the experimental site. The experimental binary water channel is used to simulate indoor the road water accumulation section of the research area.
- A control platform was used to adjust the water flow velocity, depth, and flow rate. Under different water depths and flow rates, participants walked in the water channel upstream and downstream. At the same time, the threshold of walking difficulty in the water was determined.
3.1.4 Experimental methods
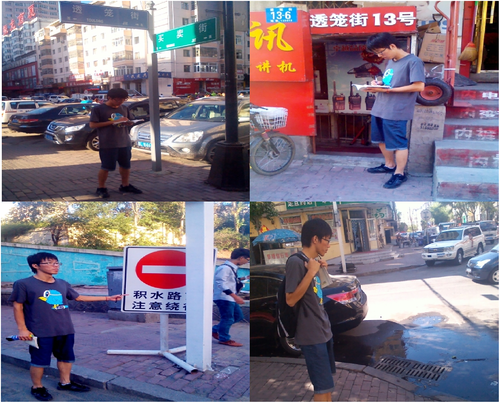
- Field investigation: In order to ensure the accuracy of the experimental data, a field investigation is required. It includes the road conditions in the study area, the areas susceptible to water-logging and the historical water-logging records (see Figure 2). According to the results of the field investigation, the parameters of the binary water channel are set to ensure the consistency with the actual road section, thus ensuring the validity of the experimental data.
- Experimental preparation: The equipment preparation before the experiment mainly includes the debugging of the binary water channel main control platform, the opening of the binary water channel pump, the setting of the binary water channel, the walking distance setting of the participants and the preparation of the participants before the experiment. Among them, the binary water channel parameters were set as follows: water depth in the range of 0.1–1.5 m, flow rate in the range of 0.1–1.5 m/s.
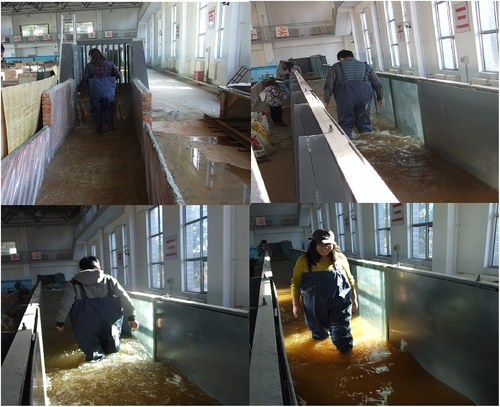
- Experimental process: According to the above pre-experiment preparation, experimenter selection and initial parameter setting of the device, the participants were grouped first according to the age, including elementary school students, young people, middle-aged, and the aged. Each group contained 10 participants. The participants carried out walking experiment sequentially from young people to the aged. The water depth and water flow speed varied from 0.1 to 1.5 m and from 0.1 to 1.5 m/s, respectively. For each participant, the walking process at different water depths and flow rates were recorded, and the threshold of walking difficulty in the water was obtained (see Figure 3).
3.1.5 Experimental results
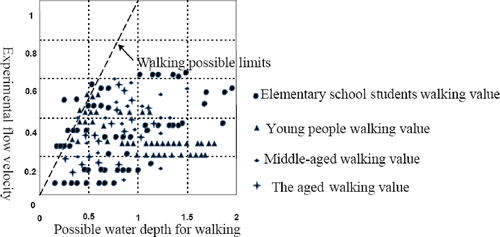
This experiment was carried out ensuring personal safety, and no extreme value experiment was performed. The experimental results show that (see Table 2), the walking speed of the participants gradually decreased as the water flow and water depth increased. That is, the difficulty of walking in the water became more and more difficult as the water depth and the flow rate increased. This shows that the flow rate and water depth have a greater impact on the travel of residents. In addition, as can be seen from Figure 4, when the water depth was 0.1–0.3 m and flow rate was 0.1–0.5 m/s, there was little difficulty for walking in water, and residents can pass. When the water depth reached 0.5–1.0 m and flow rate was 0.5–1.0 m/s, the walking of residents was greatly influenced. Under these conditions, it is difficult to pass through. Walking of participants was greatly impacted when the water depth of the road reached 1.0 m and the flow rate reached 1.5 m/s or higher.
| Number | Velocity (m/s) | Depth of the water (m) | Distance (m) | Velocity of flow (m/s) | Velocity | Velocity (m/s) | Depth of the water (m) | Distance (m) | Velocity of flow (m/s) |
|---|---|---|---|---|---|---|---|---|---|
| A1 | 0.00 | 0.35 | 4.50 | 0.91 | C1 | 0.48 | 0.30 | 15 | 0.84 |
| A2 | 0.35 | 0.35 | 4.50 | 0.73 | C2 | 0.78 | 0.20 | 15 | 0.90 |
| A3 | 0.48 | 0.35 | 3.00 | 0.85 | C3 | 0.78 | 0.30 | 15 | 0.88 |
| A4 | 0.25 | 0.42 | 4.50 | 0.66 | C4 | 0.50 | 0.50 | 15 | 0.58 |
| A5 | 0.50 | 0.20 | 4.50 | 0.56 | C5 | 0.50 | 0.70 | 15 | 0.56 |
| A6 | 0.50 | 0.20 | 4.50 | 1.00 | C6 | 1.00 | 0.40 | 15 | 0.68 |
| A7 | 0.77 | 0.20 | 4.50 | 0.98 | C7 | 1.30 | 0.30 | 15 | 0.78 |
| A8 | 0.48 | 0.20 | 4.50 | 0.87 | C8 | 1.20 | 0.60 | 15 | 0.48 |
| A9 | 0.48 | 0.57 | 4.50 | 0.56 | C9 | 0.95 | 1.00 | 15 | 0.34 |
| A10 | 0.48 | 0.60 | 0.30 | 0.58 | C10 | 0.95 | 0.50 | 15 | 0.53 |
| B1 | 0.48 | 0.35 | 7.50 | 1.02 | D1 | 1.10 | 0.20 | 15 | 0.90 |
| B2 | 0.77 | 0.35 | 7.50 | 0.90 | D2 | 1.20 | 0.30 | 15 | 0.81 |
| B3 | 0.48 | 0.35 | 7.50 | 0.84 | D3 | 1.30 | 0.40 | 15 | 0.88 |
| B4 | 0.48 | 0.40 | 7.50 | 0.70 | D4 | 1.10 | 0.30 | 15 | 0.85 |
| B5 | 0.77 | 0.35 | 7.50 | 1.20 | D5 | 1.20 | 0.40 | 15 | 0.88 |
| B6 | 0.48 | 0.30 | 7.50 | 0.85 | D6 | 1.30 | 0.50 | 15 | 0.78 |
| B7 | 0.36 | 0.35 | 7.50 | 1.23 | D7 | 0.95 | 0.70 | 15 | 0.30 |
| B8 | 0.36 | 0.25 | 7.50 | 1.10 | D8 | 0.60 | 0.40 | 15 | 1.00 |
| B9 | 0.76 | 0.25 | 7.50 | 0.88 | D9 | 1.41 | 0.80 | 15 | 0.53 |
| B10 | 0.48 | 0.48 | 7.50 | 0.76 | D10 | 0.47 | 0.60 | 15 | 0.65 |
| E1 | 0.00 | 0.35 | 4.54 | 0.81 | F1 | 0.58 | 0.32 | 15 | 0.86 |
| E2 | 0.35 | 0.35 | 4.53 | 0.74 | F2 | 0.78 | 0.22 | 15 | 0.80 |
| E3 | 0.48 | 0.35 | 3.00 | 0.75 | F3 | 0.78 | 0.32 | 15 | 0.78 |
| E4 | 0.25 | 0.42 | 4.50 | 0.88 | F4 | 0.50 | 0.52 | 15 | 0.66 |
| E5 | 0.50 | 0.20 | 4.50 | 0.58 | F5 | 0.50 | 0.71 | 15 | 0.66 |
| E6 | 0.50 | 0.20 | 4.50 | 1.02 | F6 | 1.00 | 0.41 | 15 | 0.78 |
| E7 | 0.77 | 0.20 | 4.50 | 0.88 | F7 | 1.32 | 0.30 | 15 | 0.68 |
| E8 | 0.48 | 0.20 | 4.50 | 0.85 | F8 | 1.21 | 0.61 | 15 | 0.45 |
| E9 | 0.48 | 0.57 | 4.50 | 0.46 | F9 | 0.95 | 1.00 | 15 | 0.36 |
| E10 | 0.48 | 0.60 | 0.30 | 0.68 | F10 | 0.85 | 0.50 | 15 | 0.56 |
| G1 | 0.49 | 0.35 | 7.50 | 0.78 | H1 | 1.11 | 0.20 | 15 | 0.88 |
| G2 | 0.75 | 0.35 | 7.50 | 0.80 | H2 | 1.22 | 0.30 | 15 | 0.71 |
| G3 | 0.46 | 0.45 | 7.50 | 0.74 | H3 | 1.32 | 0.40 | 15 | 0.78 |
| G4 | 0.48 | 0.43 | 7.50 | 0.72 | H4 | 1.11 | 0.30 | 15 | 0.75 |
| G5 | 0.74 | 0.33 | 7.50 | 0.77 | H5 | 1.22 | 0.40 | 15 | 0.68 |
| G6 | 0.49 | 0.32 | 7.50 | 0.80 | H6 | 1.32 | 0.50 | 15 | 0.58 |
| G7 | 0.36 | 0.34 | 7.50 | 0.53 | H7 | 0.95 | 0.70 | 15 | 0.31 |
| G8 | 0.37 | 0.26 | 7.50 | 0.62 | H8 | 0.60 | 0.40 | 15 | 0.68 |
| G9 | 0.76 | 0.25 | 7.50 | 0.98 | H9 | 1.41 | 0.86 | 15 | 0.43 |
| G10 | 0.43 | 0.50 | 7.50 | 0.66 | H10 | 0.57 | 0.67 | 15 | 0.58 |
- Note: A1–A10, elementary school students walking toward downstream. B1–B10, elementary school students walking toward upstream. C1–C10, young people participants walking toward downstream. D1–D10, young people participants walking toward upstream. E1–E10, middle-aged participants walking toward downstream. F1–F10, middle-aged participants walking toward upstream. G1–G10, the aged walking toward downstream. H1–H10, the aged walking toward upstream.

3.1.6 Analysis of the relationship between walking, water depth, and flow velocity
The assessment of difficulty for walking during urban storms is essential for residents to select roads during evacuation. Due to water accumulation on the roads, road access is hindered even completely blocked, affecting the success of asylum-seeking. Factors affecting choice of roads include water-logging location, road water-logging range, water depth, water velocity of flow, and flow direction.
Through questionnaire verification, experiments, and analysis of existing research results, it is concluded that when the water depth is 0.5 m, the flow speed is 1.0 m/s, it is difficult for people to walk in the water. When the water depth reached 1 m and the flow speed reached 1.5 m/s or more, people will not be able to pass. At this point residents should choose a different road. See Table 3 for the relationship between the walking difficulty and the water depth, flow rate.
| The depth of the water | h < 0.5 m | 0.5 m < h < 1 m | h > 1 m |
|---|---|---|---|
| Flow of velocity | |||
| v < 0.5 m/s | Can pass | Can pass | Difficult |
| 0.5 m/s < v < 1.5 m/s | Can pass | Difficult | Impassable |
| v > 1.5 m/s | Difficult | Impassable | Impassable |
3.1.7 Analysis of walking safety
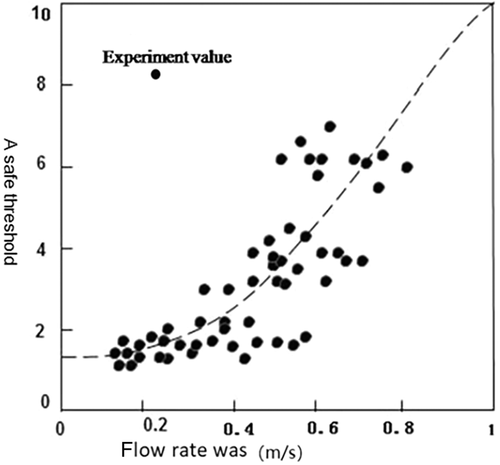
The maximum speed of walking in the water. According to the range of safety rate shown in (Figures 5 and 6), the maximum possible speed of walking was obtained. A comparison between the results experimentally measured and those obtained from the questionnaire revealed that the experimentally measured walking data were basically consistent with the questionnaire results. Most of the data is within the walking range (0–1.5 m, 0–1.5 m/s); the water depth is 0–1 m, and the flow rate 0–1.5 m/s is a safe range for residents to walk in the water. Evacuation safety threshold. In this experiment, the experimenter measured the influence of water velocity and water depth on the walking speed of participants. The measured results were generally consistent with the results from the actual questionnaire survey. The reason for the discrepancy is that the experimental environment simulates the actual road section. Walking difficulty increases when flood water flow and depth increase. When flood velocity and depth increased to a certain level, walking in the flood water became impossible. Therefore, the threshold values of flood velocity and depth were then determined. The relationship between the safety rate and the walking speed in Figure 7 is used to obtain the relationship between the upper limit of the safety rate and the walking speed. Therefore, in the actual experimental operation, there are some conditions in which the simulated road condition and the actual road conditions and environmental conditions cannot be completely consistent. Therefore, there is certain inconsistence.
3.2 Water-logging scenario simulation
The external factors of evacuation difficulty include the depth and speed of road water. Therefore, it is necessary to obtain these parameters through scenario simulations. In this paper, a numerical simulation model of urban storms was used. It has been constructed in reference[9] and is not repeated here. The model is constructed using one-and two-dimensional constant flow and an irregular grid. In addition to simulating the depth and extent of road's water accumulation, the model can also simulate the velocity of road water. This model was used to simulate the scenarios of heavy torrential rain storm in once-in-5-year scenario and a 100-year period in the study area. This simulation provides a basis for the acquisition of parameters of external factors affecting the difficulty of evacuation in disasters.
3.3 Questionnaire survey
The internal factors of residents were obtained through questionnaires. Data on residents' shelter-seeking behaviors were obtained by issuing 300 questionnaires to residents in Daoli district (recovered 278 copies with a recovery rate of 92.66%). Resident data include age, occupation, education level, choice of evacuation route, evacuation methods and shelter.
4 EVACUATION DIFFICULTY EVALUATION SYSTEM AND MODEL CONSTRUCTION
4.1 Construction of the evaluation index system for evacuation difficulty
4.1.1 Selection of indicator system
The evaluation indicator system is the basis for the evaluation of evacuation difficulty. The quality of the indicators directly affects the quality of the overall evaluation. Therefore, during the selection of the indicator system, in addition to considering the above-mentioned index system construction principles, it is necessary to comprehensively consider the internal factors and external factors that affect resident's shelter-seeking.
4.1.2 Indicator quantification and weight calculation
| Name of factor | Type and assignment | ||
|---|---|---|---|
| Education assignment | Junior secondary and below | High school and junior college | Bachelor or above |
| 1 | 2 | 3 | |
| Professional assignment | Peasant | Worker | Student |
| 1 | 2 | 3 | |
| Escape channel assignment | Township road | Provincial and municipal roads | Urban trunk road |
| 1 | 2 | 3 | |
| Optimal path selection assignment | Time is the shortest | Time is the shortest | Highest safety |
| 1 | 2 | 3 | |
| Shelter type assignment | Temporary shelter | District shelter | City shelter |
| 1 | 2 | 3 | |
(2) Weight calculation: In the process of evaluation, an estimate of relative importance of the indicators, that is, weight, is required (Xu et al., 2014). The weights were calculated using the analytic hierarchy process (AHP), which breaks down complex problems into constituent factors, and forms a hierarchical structure according to the dominant relationship. The relative importance of the decision-making scheme is determined by pairwise comparison.
4.2 Evaluation model construction
Among them: WSD is the index of evacuation difficulty during urban water-logging. The greater the value is, the more difficult it is for residents to evacuate. The values of H, E, V, and R correspond to the hazards factor, the road factor, the vulnerability of residents, and shelter-seeking behavior. In Equations (2-6), is a value quantized by the index i. Wi is the weight of the indicator i, indicating the relative importance of main difficulty factors.
4.3 Evaluation results
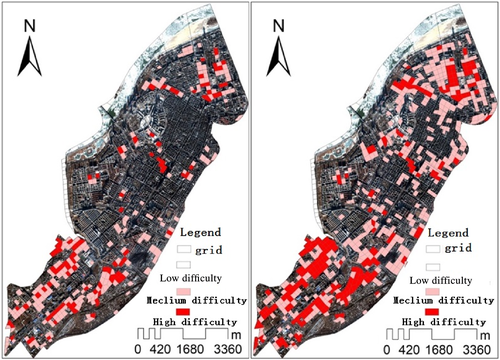
Based on the above-mentioned evacuation difficulty index system and models, the attribute values of the selected indicators for each grid were assigned by interpolation and buffer analysis, ensuring that each grid was calculated to obtain the corresponding data. By calculating the factors influencing shelter-seeking in each grid, a distribution map of the impact factors of evacuation difficulty is obtained. In order to make each grid have the properties of water depth and flow rate, different interpolation methods were compared. Finally, the Kriging interpolation method was used to interpolate the calculated water depth and velocity indexes to obtain the distribution of water depth and velocity data in the Daoli area. Because of the great influence among other factors, the GIS data distribution function is used to superimpose and spread the evacuation difficulty index, and to produce the distribution map of the evacuation difficulty of Daoli District residents in Harbin (Figure 7).
Among them, the evacuation difficulty indexes were graded using the classification method, and the evaluation results were divided into three levels according to the actual situation: low difficulty (0–0.164), medium difficulty (0.164–0.355), and high difficulty (0.355–0.564). In the evaluation results, the lower the evacuation difficulty index value is, the easier it is for residents to evacuate, and the higher the difficulty index value is, the more difficult it is for residents to evacuate. In the case of a 5-year encounter, only some sections of three streets had evacuation difficulty indexes at higher levels, indicating that residents of these sections are having difficulty in evacuating; another five streets had medium evacuation difficulty indexes, indicating that it is more difficult for residents of these sections to evacuate. Other areas had low difficulty indexes; thus, it is easier for residents to evacuate. In the case of once-in-100-years scenario, some sections in five streets had high evacuation difficulty indexes, indicating that it is difficult for residents of these sections to evacuate. In addition, the evacuation difficulty indexes of some sections in nine streets were at medium levels, indicating that it is more difficult for residents of these sections to evacuate. In other areas, the indexes were at lower levels, and it is easier for residents to evacuate. At the same time, in the process of resident evacuation and relocation, the five streets under this scenario cannot be used as an evacuation path (Tables 5–7).
| Factor | Secondary factors | Indicators | Weight |
|---|---|---|---|
| Hazards (H) | Rainfall factors | More than 50 mm of rainfall (XH1) | 0.1692 |
| Inner factors | The depth of the water (XH2) | 0.2185 | |
| The water flow velocity (XH3) | 0.0329 | ||
| Road factors (E) | Road conditions | Highway grade (XE1) | 0.1365 |
| The density of road network (XE2) | 0.0683 | ||
| Residents themselves are vulnerable (V) | Life is fragile | People aged 0–14 and over 60 years old (XV1) | 0.1388 |
| Affected by depth and velocity | People walking speed in water | 0.1340 | |
| Escape behavior characteristics | Professional types (XR1) | 0.0622 | |
| Education (XR2) | 0.1097 | ||
| Refugee behavior (R) | Escape action options | Number of shelters (XR3) | 0.0374 |
| Asylum way (XR4) | 0.0206 | ||
| Escape channel type (XR5) | 0.0440 | ||
| Shelter type (XR6) | 0.0257 |
| Sequence number | Street name | Length of road water (m) | Degree of difficulty |
|---|---|---|---|
| 1 | Xinyang Road | 80 | Asylum has some difficult |
| 2 | Jianguo North Six Street | 60 | Asylum has some difficult |
| 3 | Central Street | 30 | Asylum has some difficult |
| 4 | Section of Street | 50 | Asylum has some difficult |
| 5 | Xinyang Road and Minqing Street Intersection | 100 | Asylum difficult |
| 6 | Zhanlin Street | 120 | Asylum difficult |
| 7 | Anfeng Street | 100 | Asylum difficult |
| Sequence number | Street name | Length of road water (m) | Degree of difficulty |
|---|---|---|---|
| 1 | Ainting Street | 50 | Asylum has some difficult |
| 2 | Gongnong Avenue | 60 | Asylum has some difficult |
| 3 | Ansheng Street | 130 | Asylum has some difficult |
| 4 | Hesong Street | 200 | Asylum has some difficult |
| 5 | Minan Street | 120 | Asylum has some difficult |
| 6 | Hexing Road | 38 | Asylum has some difficult |
| 7 | Daoli North–South Road | 55 | Asylum has some difficult |
| 8 | Weiwu Road | 45 | Asylum has some difficult |
| 9 | Minan Street | 100 | Asylum has some difficult |
| 10 | Shitoudao | 500 | Asylum difficult |
| 11 | Intersection | 300 | Asylum difficult |
| 12 | Intersection | 300 | Asylum difficult |
| 13 | Intersection | 1500 | Asylum difficult |
| 14 | Anguo Street | 900 | Asylum difficult |
5 CONCLUSIONS AND DISCUSSION
This paper investigated the difficulty of evacuation during urban rainstorm water-logging. Based on the empirical research in Daoli District of Harbin City, a set of ideas and methods was proposed for the assessment of evacuation difficulty based on small-scale evaluation. That is to say, the evaluation was based on factors influencing evacuation behavior of residents, questionnaires, walking experiments and water-logging scenario simulation. The evaluation process, experimental methods, and models of evacuation difficulty in flood disasters were discussed. The feasibility of the research results was verified by an empirical experimental method. The study revealed that the evacuation behavior of residents is related to their own factors. In particular, the experiences and education level of residents have great impact on the effectiveness of evacuation process. In addition, walking experiments show that residents did have deficiency in awareness of the risk of walking in flood water. Therefore, relevant departments need to publicize disaster emergency evacuation methods and conduct emergency drills. In this way, not only can residents better understand the danger of walking in flood water, but also reduce the losses caused by water-logging.
- Through the resident water walking experiment, we conclude that when the water depth is 0.5 m, when the flow rate reaches over 1 m and 1.5 m/s, the residents will not pass, and other roads will be selected.
- The asylum behavior of the residents is related to their own characteristics, especially whether the residents have disaster experience, education, education, etc., which are all the factors that have a greater impact on the residents in the evacuation process. Therefore, in the present study, related data on resident evacuation behavior were obtained by questionnaire survey. To describe the asylum behavior of the residents.
- During 5 years of heavy rain and water-logging disasters, seven streets in the road area were flooded to varying degrees. Among them, with the intersection of Xinyang Road and Minqing Street, Zhaobin Street and Anfeng Street as refuge roads, it is difficult for residents to take shelter and pass through them. In the 100-year rainstorm and water-logging disaster scenario, there are 14 roads of varying degrees. Among them, the intersection of Shiqiao, Tongguan Street and China Merchants Street, the intersection of Tongguan Street and Zhaobin Street, the intersection of Anfa Street and Jingwei Second Street, and Anguo Street are difficult to pass through.
The assessment of evacuation difficulty during urban water-logging disasters is complicated, involving many factors such as environmental factors and residents themselves. Therefore, based on the behavior experiment of residents walking in flood water, this paper explored influencing factors, including water depth and flow rate, and used questionnaire to understand the evacuation behavior of residents, and clarified relevant factors that affect the safety of evacuation. However, in the walking experiment, the facility was not sufficient for vehicle use. Therefore, the use of vehicle for evacuation of residents was not considered. In future research, it is necessary to seek better experimental conditions, and consider comprehensively the difficulty of evacuation under the conditions of multiple evacuation methods. As such, research results will be more realistic.
ACKNOWLEDGEMENTS
Project of Science and Technology Department of Jilin Province (No. 20200403074SF); Project of Education Department of Jilin Province (No. JJKH20200428KJ).
Open Research
DATA AVAILABILITY STATEMENT
Data sharing is not applicable to this article as no new data were created or analyzed in this study.


