Assessing lithological uncertainty in dikes: Simulating construction history and its implications for flood safety assessment
Funding information: Stichting voor de Technische Wetenschappen, Grant/Award Number: P15-21
Abstract
Dikes often have a long history of reinforcement, with each reinforcement adding new material resulting in a heterogeneous dike. As data on the dike internal heterogeneity is sparse, it is generally overlooked in the stability assessment of dikes. We present an object-based and process-based model simulating dike construction history on archeological dike cross, yielding similar patterns of heterogeneity as observed in real dikes, and apply it in a dike safety assessment. Model predictions improve when being based on more accurate statistics of dike buildup, or when being conditioned to ground truth data. When incorporated in a dike stability assessment, multiple model runs can be coupled to hydrological simulations and dike slope stability calculations, resulting in a probabilistic stability assessment considering internal dike heterogeneity. While high-resolution observations are still sparse, good model accuracies can be reached by combining regional information on dike buildup with local point observations and this model provides a parsimonious basis to include information of internal dike heterogeneity in safety assessments.
1 INTRODUCTION
Current and future changes in climate likely lead to more extreme precipitation events and high-water levels, which demand major investments in dike reinforcement projects. To efficiently guide these expenditures, extensive research is carried out to determine material properties of dikes (de Waal, 2016). This information is of great importance for dike stability, as the material type directly influences dike stability by the stability parameters (Cao et al., 2016), but also indirectly influences groundwater pressures and flow within the dike (Butera et al., 2020; Kuriqi et al., 2016; van Woerkom et al., 2021).
The material of which dikes are constructed is often very heterogeneous, as throughout their existence dikes were heightened and widened. To support this, a short overview of the river dike history of the Netherlands is presented, but a similar history can be expected elsewhere. The earliest dikes in the Netherlands were constructed in the early Middle Ages, and at the start of the 16th century all rivers were bordered by dikes. These dikes were owned by locals who could use the dike but were also responsible for its maintenance. A water board coordinated and inspected the maintenance works done by the local land owners (TeBrake, 2002). Large scale dike reinforcements only started in the 19th century with the mechanization in transport and construction and the establishment of a national institution for water safety (in Dutch: Bureau van de Waterstaat). In more recent times (following the 1953 storm surge) the Delta Law of 1958 led to an extensive round of dike reinforcement (Pleijster, Veeken and LOLA Landscape Architects, 2014). Currently, new risk-based safety standards based on acceptable probabilities of flooding for various dike failure mechanisms are defined, again leading to a series of reinforcement projects. Differences in reinforcement methods, and the prolonged lack of institutionalized control, has resulted in very heterogeneous dikes (Figure 1), and locally the original lithological sequence in river dikes can be very discontinuous as a result of dike breaches.
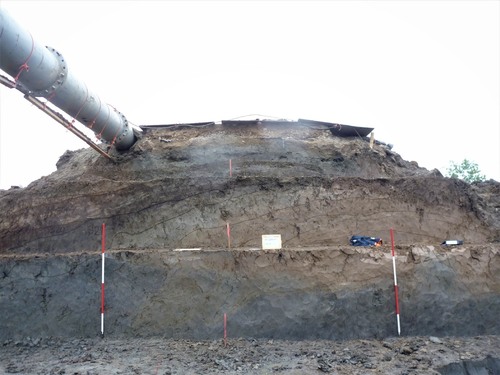
It can be inferred from the sparse excavations of dikes (Figure 1) and from the more numerous cores and CPTs, that many dikes have been constructed during several phases of reinforcement and that often soil material was used that was chosen on the basis of availability rather than its engineering properties. However, their history is often undocumented and observations on dike composition are insufficient to reconstruct a single dike transect, let alone a spatial continuous mapping. Consequently, the stability of the river dike slopes is often very uncertain due to poor estimations of soil properties and groundwater pore pressures. Currently, only average properties of dike material are often derived, or a global statistical uncertainty is applied in a probabilistic analysis (Cao et al., 2016; Gui et al., 2000) to assess its probable response on dike hydrology and stability. Although this approach might be applicable for slope stability problems (van der Krogt, 2022), it ignores the internal structure and heterogeneity of the dike, in which a weak zone can significantly decrease dike macro-stability (Tabarroki et al., 2021). In addition, a wedge of sandy material can increase seepage and pore pressure heads, decreasing the shear strength of the material. Thus, to improve both pore pressure estimations and slope stability calculations internal heterogeneity needs to be included in dike buildup reconstructions.
Two complementary strategies can be deployed to increase information density and improve dike buildup reconstructions. The first strategy is to gather more field-based research, using, for example, geological cores and cone penetration tests (CPTs), but the resulting detailed point observations on layer depths and material properties are insufficient for a full reconstruction and in many cases, no local ground truth data of the dike is available at all. The second strategy focuses on point-data interpolation to simulate lithological sequences. Most common are the pixel or voxel based techniques, for example, kriging (Isaaks & Srivastava, 1989), Markov Chain (Elfeki & Dekking, 2005; Li et al., 2004) and multiple-point geostatistics (Feyen & Caers, 2006). Other techniques are object-based methods, which place preconstructed units with certain characteristics in the model domain consecutively (Deutsch & Wang, 1996) or process-based techniques, which simulate the construction or sedimentation process that formed the geological sequence (Pyrcz et al., 2009). However, most of the pixel or voxel-based techniques are less suitable for river dikes simulation given their very diverse and distinct, man-made lithological sequences. Moreover, some techniques depend on abundant training data and local point data for simulation conditioning (Tahmasebi, 2018), that is virtually absent for dikes.
Thus, any proposed method for simulating dike heterogeneity should be capable of simulating the internal structure and composition of dikes and overcome the lack of ground truth data by using general knowledge on dike buildup. In addition, the method should be able to incorporate ground truth data into the simulation, if any is present. These prerequisites require a combination of object-based and process-based techniques, as the process of iterative dike reinforcements can be understood from the general history of river dikes and object-based methods can most easily incorporate information on structural geometry.
In this study, we present a model to simulate multiple, equally probable versions of a dike's internal stratigraphy. The model uses general information to simulate layer geometry and lithology and can be conditioned on ground truth data where available. The goal of this study is to analyze the performance of this novel method for simulating nonnatural discrete lithological sequences in dikes, which would improve pore pressure estimations and dike stability calculations when compared with methods using average properties with statistical uncertainties. We also apply the method to existing dikes to evaluate the effect of dike interior heterogeneity on groundwater flow under elevated river levels, as a key condition for dike failure. This application highlights the added value of a probabilistic representation of dike buildup in the current practice of dike safety assessments.
2 METHODS
2.1 General methods
We developed DETRIS (Dike Erection Tessellation using Regionally Inherited Statistics) to simulate dike buildup, which uses general information on layer geometry and lithology from archeological excavations of dike cross-sections (Appendix A; Table A1 and Figure A1). The performance of DETRIS is analyzed by its ability to simulate realistic dike buildups in terms of layer geometry and lithology types. The applicability of DETRIS for dike safety assessment is analyzed by coupling the algorithm to a groundwater flow model and dike safety and comparing these results to an expert assessment of dike slope stability.
2.2 Dike construction using DETRIS
2.2.1 Process based dike construction based on historical assumption
Methods of dike construction in the Netherlands differed substantially throughout history, leading to different heterogeneity patterns of dike buildup. In addition, the inner (landward) and outer (riverward) sides of the dike are known to be constructed of different material: the outside needs to be resistant to wave erosion and therefore often mostly consist of clayey material, whereas the inner side is often a low sloping berm of more sandy material.
For this study, we distinguish four time periods with distinct construction methods (see Introduction) and sufficient sample points to derive meaningful characteristics. A first period until the closure of the river dike network (1500 CE), a second period until the emergence of large-scale dike reinforcements (1800 CE), a third period covers further institutionalizations and the start large scale reinforcement projects and a fourth and final phase comprises modern reinforcement techniques starting from 1950. This last phase is often not present in the sampled dikes as it was of smaller interest from an archeological point of view. We distinguish three geometrical zones along the dike: its outer (river-facing) side, its crest, and the inner side. The dike crest encompasses the top of the dike at those sample points where slopes are below 1:6 (vertical over horizontal distance). Sample locations with an absolute slope value >1:6 belong either to the outer or inner side. Creating geometrical zones based solely on slope is found sufficient, although some errors arose in the automatic classification. However, it has the advantage of rapid pre-processing of new data in case additional cross-sections become available. By intersecting the temporal and geometrical zones, a total of nine (3 periods × 3 dike zones) combinations is created (Figure 2c), each with distinct characteristics.

2.2.2 Deriving general information of dike characteristics
General statistics of dike buildup characteristics are derived from historical cross-sections of dikes, which are digitized from multiple archeological reports (Appendix A). These cross-sections contain both high resolution layer geometry, detailed material description and dated ages of some layers. At a 10 cm spacing, sample points are created, at which the intersecting layer is selected (Figure 2). First, the layer material type at that location is determined. Second, the layer thickness () is sampled by calculating the length of the shortest line through the sample point connecting both sides of the layer. Third, the layer slope () is calculated as perpendicular angle of that line with the horizontal. All sampled points are grouped in the corresponding combination of period and geometry (Figure 2c). For each combination, the statistics of layer material type is summarized into histograms and the statistics of layer thickness and layer slope are re-sampled to a continuous probability density functions using a kernel density estimate (Scott, 2015).
The statistics of layer material type, layer thickness and layer slope are derived per cross-section, and thus provide local information on dike buildup. Furthermore, regional statistics are derived by aggregating the statistics of all separate dikes. These regional statistics can be used to inform the model even at locations without local statistics on dike buildup.
2.2.3 DETRIS algorithm
We incorporated the general statistics of dike buildup characteristics per dike construction phase in DETRIS to hierarchically reconstruct the buildup of dikes in an object-based fashion. DETRIS starts with selecting either all local or regional statistics for slope, thickness, and material type. The local statistics are selected if they are available for that dike or a dike in the direct vicinity. Then, a simulation space is created (Figure 3) from the oldest known construction time-period. If no information of construction periods is present, the current dike surface is used. Subsequently, the statistics corresponding to that time-period are selected. An initial dike is created and placed centered at the bottom of the simulation space.
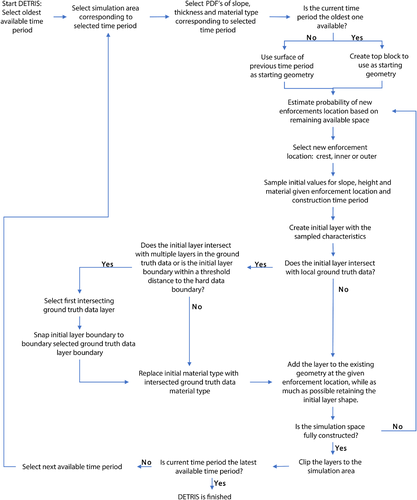
DETRIS iteratively adds a new reinforcement layer on top of the already present dike until the simulation space is entirely filled. In this iteration, first the next reinforcement location (crest, inner, or outer) is selected on the principle of spatial accommodation, that is, the larger the available space between the pre-simulated dike and the final know dike surface, the larger the chance that the next reinforcement stage will be on that location. Then, a new layer is created by sampling a thickness, slope, and material type from the statistics for the reinforcement location and added, until the outline of a dike construction phase is reached. If this is an intermediate phase, the statistics for slope, height and material type are updated to meet those of the next construction phase. If the final outline of the dike is completely filled, the process is completed. In this way DETRIS simulates one possible realization of dike buildup. By creating multiple samples from the same probability density functions, DETRIS can generate many realizations of dike buildup, which are all equally probable.
2.2.4 Conditioning to ground truth data
If local point observations (e.g., cores, interpreted cone penetration tests) of the dike are available, each newly added layer that intersects with this ground truth data is assigned the observed thickness and material type (Figure 3). In case the thickness of the simulated layer is smaller than that of the ground truth data layer, the original thickness is kept, otherwise the thickness is reduced to that of the lowest intersecting ground truth data layer. If a simulated layer intersects with multiple ground truth datapoints, it must comply with all.
2.3 Cross-section descriptions
Two cases are selected to analyze the performance of the DETRIS algorithm, and one case is selected to explore the added value in dike slope stability assessments.
2.3.1 Cross-sections for analysis of DETRIS performance
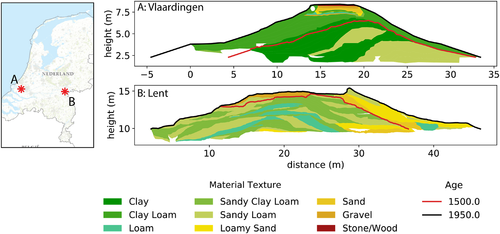
To analyze the material and shape heterogeneity and uncertainty related to DETRIS, two known cross-sections from the database (Appendix A) are selected: Vlaardingen (Maassluissedijk Vettenoord) and Lent (Bemmelsedijk). These are amongst the most complete historical cross-sections available and are located, respectively, in the more distal and proximal parts of the Rhine delta (Figure 4). The Vlaardingen dike is therefore mostly constructed of clay material, while the Lent dike has a strong variation of clays, sands, and silts. Furthermore, the Lent dike was almost entirely constructed before 1500 CE, while the Vlaardingen dike was raised and widened considerably after that time.
2.3.2 Cross-section for DETRIS application
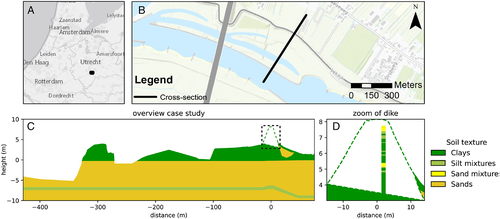
The application of DETRIS in relation to the assessment of groundwater conditions and dike slope stability is shown for the northern Lek dike east of the village Nieuwegein (Figure 5a,b). A survey resulted in a complete lithological characterization of the natural subsurface (Figure 5c) and some point observations (ground truth data) on the dike interior from a cone penetration test (CPT, Figure 5d).
2.4 Performance of DETRIS
The performance of DETRIS is analyzed for the Vlaardingen and Lent dikes (Figure 4). The performance is assessed in terms of the ability of DETRIS to create similar patterns of heterogeneity as found in historical dikes, and the ability of DETRIS to simulate the correct material texture given variable quantities of available ground truth data.
In the assessments, local statistics of slope, layer thickness and material types, that is, from the corresponding cross-section, and regional statistics, that is, the aggregated over all cross-sections in the database, were evaluated. For each dike and selected set of statistics DETRIS created 100 hypothetical dike realizations using the dated outlines of the cross-sections for the construction phases.
2.4.1 Heterogeneity measures
| Material type | (°) | ||||
|---|---|---|---|---|---|
| Sands | 5.75 | 0.0 | 32.5 | 18.0 | 20.0 |
| Sand mixtures | 0.26 | 0.0 | 30.0 | 18.5 | 20.5 |
| Silt mixtures | 0.05 | 1.0 | 30.0 | 20.0 | 20.0 |
| Clays | 0.01 | 5.0 | 17.5 | 17.0 | 17.0 |
| Organic soils | 0.10 | 3.75 | 15.0 | 12.5 | 12.5 |
| Expert scenario dike material | – | 0.0 | 30.0 | 18.9 | 18.9 |
2.4.2 Uncertainty quantification
2.5 Application of DETRIS for dike stability assessment
The application of DETRIS is evaluated on a cross-section for which a dike slope stability assessment is performed, including estimates on groundwater conditions. As described in Section 2.3.2, this case study is located at Nieuwegein (Figure 5) and contains ground truth data (a CPT) to which DETRIS will be conditioned.
2.5.1 CPT classification
The CPT is classified to five lithological classes based on Been and Jefferies (1993): sands, sand mixtures, silt mixtures, clays and organic soils (Table 1). These material types are used to simulate the dike buildup using DETRIS, and the originally used material type histogram (Figure 7) is reclassified to these units.
2.5.2 Basis of expert scenarios of groundwater conditions and dike slope stability
The available expert dike slope stability assessment is performed with the Dutch guidelines (Rijkswaterstaat, 2021) for dike slope stability assessment. These guidelines of this standard (TAW, 2004) specify two scenarios for the phreatic groundwater table in the dike and one for the pressure head in the underlying sandy aquifer.
The expert groundwater scenarios are imported in slope stability software D-Stability (Deltares, 2019). The Uplift-Van limit equilibrium method is used for slope stability calculations, which assumes a dual circular slip plane. The slip plane consists of an active circle, a passive circle and a compression bar in between (Van, 2001). The slip plane has to start in the crest or the upper half of the landside slope. A C-Phi model for calculating shear stresses is used, and each layer in the DETRIS simulations is assigned a characteristic value of cohesion (), friction angle (), material weight () and saturated material weight () given its simulated material type. The expert scenario dike is assumed homogeneous and is assigned a single value for each of the parameters (Table 1).
2.5.3 Calculating groundwater conditions and dike slope stability from DETRIS
The selected Nieuwegein cross-section (Figure 5) has no archeological observations (Appendix A) in its vicinity, so the DETRIS realizations are based on the regional statistics. The classified CPT serves as ground truth data. DETRIS generates an ensemble of 100 possible dike realizations. For each realization steady-state pressure heads are calculated, and a dike slope stability calculation is performed on the DETRIS simulation and the resulting pore pressure heads.
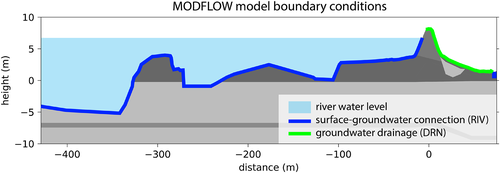
The steady-state hydrological simulations of the entire cross-section are performed using the MODFLOW 6 software (Langevin et al., 2019). The 2D hydrological model is setup using a cell size of 0.2 m both vertically as horizontally and includes the dike and the subsurface (Figure 5c). At the left end the river has a connection with the lower aquifer. Here the imposed river stage constitutes a head-controlled boundary condition (Figure 2) handled by the MODFLOW river package (Hughes et al., 2017). On the inner side of the dike head-controlled conditions (Figure 6) are handled by the MODFLOW drain package that creates seepage points that permit outflow only (Hughes et al., 2017). A drainage ditch with a constant head 0.5 m below the surface is located on the landward boundary. The subsurface material types and simulated dike material types are assigned a saturated conductivity () based on characteristic values (Table 1). In the steady-state simulation, the river is at a high stage, with a head of 6.73 m with respect to ordnance datum (recurrence interval of 1:30,000 years, the safety standard for this dike stretch).
The dike slope stability calculations are again performed in D-Stability software (Deltares, 2019). The DETRIS realization replaces the expert schematization of the dike material, while the natural subsurface is kept the same (Figure 5). Each layer in the DETRIS realization is assigned the C-Phi parameter values corresponding to its material type (Table 1). In addition, the resulting pressure heads from the steady-state MODFLOW model are inserted in the D-Stability software. From the DETRIS realization and corresponding pressure heads, the inner (landward) slope stability is expressed by the safety factor (see supplementary material Data S1 calculation for example).
3 RESULTS
3.1 General characteristics of archeological dike cross-sections
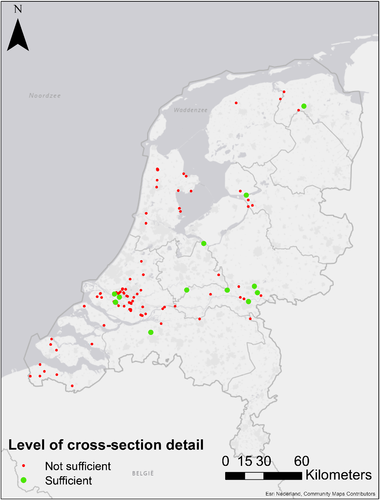
Out of the 66 digitized cross-sections, 12 cross-sections had sufficient detail to derive general statistics of dike buildup characteristics in the form of probability density functions for layer slope, layer thickness and layer material type. The layer slope is centered around a slope of zero, with negative values representing inner side slopes and positive values representing outer side slopes (Figure 7). The median layer slope is exactly zero, indicating inner and outer slopes are generally equally steep. The absolute median layer slope equals 0.21, roughly being equal to a vertical to horizontal ratio of 1 to 5. The median layer thickness is 0.50 meter, with 5 and 95 percentiles at 0.13 and 1.94 m. In our digitized cross-sections most dike layers consist of clay and loam (71%), with the largest remainder consisting of sand or gravel (26%). However, peat, wood and stone are also found in the historical dikes (3%).

3.2 Visual DETRIS example
To illustrate how DETRIS simulates construction history by consecutively selecting new reinforcement layers, the dated construction of the real Lent dike (Figure 8) is presented next to an arbitrary DETRIS realization of the same dike. The total construction period is divided in two phases: a first phase with construction and reinforcements made up to 1500 CE and a second phase with reinforcements made after 1500 CE. As outlined, these construction phases are linked to the different statistics to parameterize DETRIS, resulting in two separate simulation spaces that can be traced across the realizations.
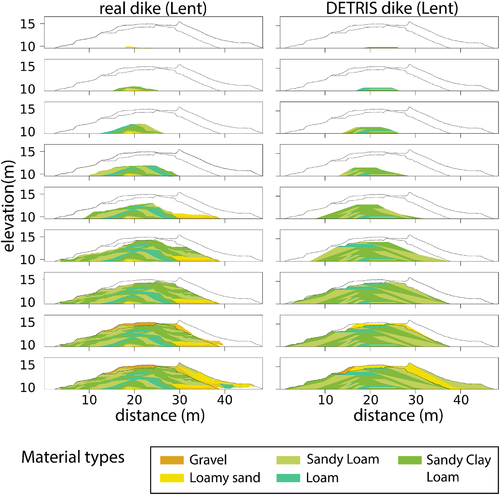
The early reinforcements particularly consist of clayey to silty material in both the real dike and the DETRIS dike. The real dike equally extends the reinforcements to either side of the dike center, confirming our DETRIS assumption that the position of any next reinforcement is based on the principle of spatial accommodation, that is, that there is no clear preference to one side. For the second (youngest) selected temporal period, both the DETRIS dike and the real dike have a larger occurrence of sand and gravel reinforcement layers. The DETRIS realization visually seems to mimic the construction history and resulting heterogeneity of the real dike relatively well, but a statistical analysis is needed to demonstrate this similarity on a larger set of realizations.
3.3 Performance of DETRIS algorithm
The performance of DETRIS in probabilistic terms is assessed on two known cross-sections (Lent and Vlaardingen, Figure 4), using statistics from both local as regional statistics. The performance is based on two indicators: The ability of DETRIS to create similar patterns of heterogeneity as found in historical dikes, and the ability of DETRIS to simulate the correct material texture given variable quantities of available ground truth data.
3.3.1 Performance of simulating dike heterogeneity
Four simple quantitative heterogeneity metrics (Section 2.4.1), being fractal dimension (), relative contagion (), relative evenness () and relative patchiness (), are compared between 100 DETRIS realizations and the two known dike cross-section. The average normalized root mean squared error (NRMSE) of all heterogeneity indices between all the realizations and real the values are seen as a general indication of model performance (Figure 9).
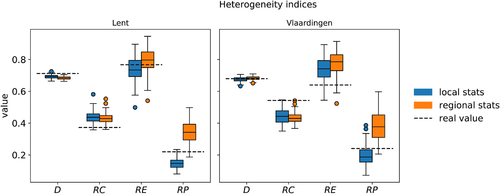
The NRMSE using local and regional statistics for dike buildup characteristics, respectively, are 0.18 and 0.21 for the Lent case and 0.20 and 0.23 for the Vlaardingen case. This indicates that a dike can be more precisely reconstructed by DETRIS if the local statistics of that dike are known. For both Lent and Vlaardingen cases, DETRIS performs best in the fractal dimension () measure, indicating that the simulated layer shapes match well with the layer shapes in the real dikes. For the tested cases, the of the local statistics generally tends to be low and of the regional statistics high, indicating that layer transitions given the regional statistics tend to be associated with shifts in material properties that are more abrupt than observed in reality. In line with this the Vlaardingen is often too high, which might suggest that DETRIS is less suitable for simulating more homogeneous cross-sections.
3.3.2 Performance of model accuracy and effect of ground truth data conditioning
The DETRIS-algorithm can also be conditioned on ground truth data, often available as vertical cores. These cores are often placed at the outer toe, at the dike crest or at the inner toe of the dike. Three scenarios are compared here: a scenario without ground truth data (Figure 10a,d), one location of ground truth data (Figure 10e) and three locations of ground truth data (Figure 10c,f) for DETRIS conditioning. For each scenario, 100 DETRIS realizations are performed using local and regional statistics for both Lent and Vlaardingen. The spatial balanced accuracy () is only assessed on 100 realizations of Lent with local statistics (Figure 10d–f).
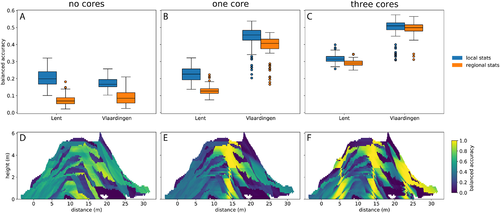
Independent of the use of local or regional statistics, the median increases when adding ground truth data, while the interquartile range of decreases. The local statistics result in a higher than the regional statistics, but this difference decreases when adding one core and almost diminishes when three ground truth data cores are used. There is a large difference in between the two presented cases, Lent and Vlaardingen, where the more uniform Vlaardingen case shows the largest relative improvement from no cores to one core, while the more heterogeneous Lent case shows the largest relative improvement from one core to three cores.
The increase of the DETRIS model is mostly caused by an increase in the proximity of the available ground truth data (Figure 10d–f), with > 0.75 for on average 1.7 m on each side of the ground truth data. At locations further away from the ground truth data the stays the same or can even decrease compared with the noninformed (no cores) reconstruction.
3.4 Implications of DETRIS for groundwater levels and dike stability
The application of DETRIS is shown for a different cross-section (Nieuwegein, Figure 5). At this location, the regional statistics are used as no local information is available except a single CPT. For this location, two expert scenarios on groundwater conditions and the corresponding safety factors () for dike slope stability are available (see Section 2.5.2).
Based on the 100 dike buildup realizations by DETRIS, the simulated pressure heads in the aquifer beneath the dike are in general agreement with the schematized expert scenario (Figure 11B). For the realizations, the variation of dike buildup material type results in a high variation of the simulated water tables in the dike. At the outer crest location (width = −3.5) the difference between the 5 and 95 percentile of the simulated phreatic lines equals 1.59 m, while the two expert schematized phreatic lines differ 0.98 m. Around the CPT location and at the inner toe of the dike, the variability decreases. At the inner crest location (width = 3.5) the difference equals 0.48 m for the simulations and 1.05 m for the schematized phreatic lines, and this decreases even further towards the inner toe, as the dike is drained by the sandy wedge present. At the CPT location, the reduced 5–95 percentile range of groundwater pressure heads emphasizes that the effect of any ground truth data extends beyond decreasing the uncertainty in material texture (as shown in the previous section, Figure 10).

The two safety factors for dike slope stability on the inner (landward, right side) slope are 1.12 with a high phreatic level and 1.53 with a lower phreatic level (Figure 11c). Based on the DETRIS realizations, the median dike stability is 1.41, with a 5 and 95 percentile of 1.35 and 1.51. Thus, the simulated safety factors are in between the two expert schematizations and have a smaller variation. Overall, the DETRIS-based values are nearer to the safety factor resulting from the schematized groundwater scenario with a lower phreatic level as the draining conditions near the inner crest strongly control the phreatic levels in this case.
4 DISCUSSION
4.1 Relevance of local statistics for dike heterogeneity assessments
To assess the dike safety on a longer dike stretch, information on dike material variation along the dike on a small scale (several meters) is crucial. However, to our knowledge only few observations exist from which the parameters needed for DETRIS can be derived, and these are often far apart. However, an indication of the spatial correlation of material properties is essential as it indicates how representative the local and regional statistics are that are used to parameterize DETRIS.
The spatial variability of dike buildup is analyzed based on the material types of all 66 cross-sections in the larger database (see Section 3.1), which include both the 12 detailed profiles used for the parametrization of DETRIS as well as other less detailed reports on historical dikes. Two parameters are assessed: the previously discussed RE, as a measure of dike material heterogeneity, and the average saturated conductivity based on Table 1, as a measure of average dike properties. The spatial similarity of these metrics between dikes is assessed using variograms (Matheron, 1963). A spherical variogram model is fitted including the nugget effect, with a maximum lag distance of 100 km and a uniform binning strategy.
The has a nugget of 0.989, which is 50.5% of the total sill of 1.958, and an effective range of 63.4 km. The RE has a nugget 0.033, which is 53.3% of the total sill of 0.063, and an effective range of 7.7 km (Figure 12).
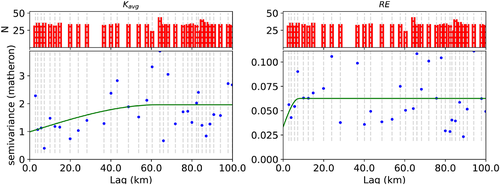
The variograms of Figure 12 suggest that the use of local dike statistics is only useful within 7.7 km from a known dike cross-section, as at further distances no spatial similarity in dike buildup may be expected. Of the approximately 1850 km of primary river dike in the Netherlands, 17% is located within a radius of 7.7 km from a detailed dike cross-section. As the local statistics from detailed dike cross-sections substantially decrease the uncertainty in dike buildup and groundwater conditions, increasing the number of detailed cross-sections from which local statistics can be derived, would increase the overall accuracy. However, the high nugget-to-sill ratios (~50%) indicate that even on smaller scales large variations can occur, and that ground truth data, in combination with a successfully applied interpolation or simulation model, is also needed for accurately predicting dike buildup. This was also shown by the balanced accuracy (), where for Vlaardingen, local statistics without ground truth data lead to an median balanced accuracy () of 0.17, while regional statistics with three ground truth data cores for conditioning lead to a of 0.49 and local statistics with three ground truth data cores lead to a of 0.51 (Figure 10). Thus, the model benefits more from adding ground truth data at multiple locations when regional statistics are used, than it benefits from adding a limited number of cross-sections to provide the local parameterization. Also, cross-sections are very destructive and often not allowed in primary dikes. However, we recommend a more intense collaboration with archeologists to increase the density of high-quality data on dike material buildup to inform dike reconstructions, in particular as the delineation of the reconstruction phases is an open question in our method. Again, replacing it by aggregated statistics for the entire dike buildup and using ground truth data can solve this partly, but the results will deteriorate considerably without ground truth data conditioning.
4.2 Dike safety assessment improvements by DETRIS
DETRIS can provide more realistic heterogeneous dikes than those currently in use, as it does not assume uniform material characteristics in the entire dike. Its fast and effective algorithm can provide multiple realizations of dike buildup, based solely on input statistics of material and layer characteristics, and optionally incorporate ground truth data. As such, it produces a data-based approximation of the uncertainty in dike failure risk as a function of dike heterogeneity and groundwater conditions. This probabilistic approach results in a better informed assessment of dike slope stability. In addition, it can easily incorporate (more) local statistics, ground truth data, or knowledge on dike construction history in an objective manner, contrary to human-controlled expert schematizations. In this case, the probabilistic assessment resulted in a smaller uncertainty when compared with expert judgment (Figure 11). While this may vary from case to case, it reflects the strength of DETRIS in evaluating the effect of the buildup and the uncertainty therein on the stability of dikes in a mechanistic manner.
4.3 Suggestions for model improvements
DETRIS is currently capable of simulating realistic dike buildup on a 2D cross-sections, but the algorithm is prone to simulate too large differences in composition between adjacent layers. In the observed cross-sections similar layers were often more clustered. Like conditioning on g point data, adding conditional probabilities to represent inter-layer dependencies can result in more realistic dike buildup realizations. The use of recent developments in continuous geophysical data interpretation, such as electrical resistivity tomography (Chavez Olalla et al., 2021) or ground penetrating radar (Di Prinzio et al., 2010) are promising to increase the availability of ground truth data too. In addition, coupling our object-based model to other geostatistical methods, such as multiple-point geostatistics (Tahmasebi, 2018) can provide more detailed indications of material uncertainty across but also along the dike. Such a coupling has already been successfully applied to simulate natural deposits (Michael et al., 2010).
4.4 Outlook and suggestions for further research
The explicit characterization of the legacy of dike construction on the material composition as implemented in the DETRIS algorithm can assist in obtaining better informed safety calculations and improve our understanding of the governing processes on different temporal scales. An example of a short-term process as presented in this paper is the location of the phreatic line during high river water levels and the dike slope stability. Other stability related features, such as the presence of an erosion resistant core or small sand lenses in the dike can be better assessed using DETRIS as well. They are important as a source of residual strength after dike slope failure and for having a major influence on the intrusion length of pore pressures.
In terms of long-term processes such as soil formation and weathering, DETRIS can link the composition of a particular layer and its properties to material and age. In addition, compaction of the layers can change the dike buildup geometry and material properties. This, eventually, may alter the behavior of the dike during prolonged periods of droughts due to irreversible shrinkage of clay and peat and the formation of fissures, which could affect its ability to withstand high water levels that follow, thus introducing hysteresis.
5 CONCLUSION
- The implementation of a process-based model (DETRIS) enables a probabilistic assessment of dike interior buildup based on observed characteristics of historic dikes, which goes beyond the current assumption of homogenous dikes.
- Dikes have a high internal heterogeneity which is captured by the model. Local information improves the predicting capacity of dike buildup, but regional statistics, nonetheless lead to representative dikes.
- Dike cross-sections only have a predictive capacity within several kilometers, and considerable variation is observed even on smaller scales. Conditioning to ground truth data cores or CTPs provides a good alternative at locations outside this range.
- Using DETRIS-based scenarios of dike buildup to simulate groundwater levels and dike stability provides a more comprehensive way of incorporating heterogeneity than arbitrary expert-based estimations and narrows down the uncertainty of dike slope stability analyses while incorporating local and adverse effects of more permeable or less competent layers.
- DETRIS is capable of simulating nonnatural discrete lithology sequences, and it can be further improved by adding layer inter-dependency or possibly coupling it to a multiple-point geostatistics algorithm.
- We recommend a more intense collaboration with archeologists and responsible institutions for dike maintenance to increase the density of high-quality data on dike buildup material and ages of dike erection phases than currently present.
ACKNOWLEDGMENTS
We greatly appreciated the support of Martin van der Meer and Johan Hockx providing data on the case-study and ideas on the application of the algorithm. We also greatly thank the late Michel Lascaris for providing references on archaeological dike cross-sections.
APPENDIX A
| Location name | Source |
|---|---|
| Pernis, Oud Pernis | Jacobs, E. (2000): Jacobs, E.; (2000): Pernis, een doorsnede van de dijk van de polder “ud-Pernis” (11–76). DANS. https://doi.org/10.17026/dans-zrj-gh2m (11-76). |
| Kampen, N50 Ramspol | ADC Archeoprojecten; Ridder, J.A.A. de; (2010): Kampen N50 Proefsleuvenonderzoek. DANS. https://doi.org/10.17026/dans-xnt-fsfk |
| Spijkenisse, Schenkeldijk | Burnier, C.Y.; (2003): Spijkenisse Schenkeldijk. DANS. https://doi.org/10.17026/dans-xyt-z4av |
| Vianen Zijderveld, Diefdijk | Genabeek, R.J.M. van; Schorn, E.A.; (2004): Project Verbreding A2: tracebegeleiding Diefdijk. DANS. https://doi.org/10.17026/dans-zdv-586d |
| Reitdiep, Kanaaldijken | Huis in t Veld, J.Y.; (2011): De dijken van het Reitdiep. Een archeologisch onderzoek bij een nieuwe fietsbrug over het Reitdiep te Groningen (GR). DANS. https://doi.org/10.17026/dans-zxr-astj |
| Breda, Buitendijks Slangwijk | Nollen, J.; Jonge, L. de; Gemeente Breda; (2010): Breda Buitendijks Slangwijk. DANS. https://doi.org/10.17026/dans-z82-d8jf |
| Angeren, Rijndijk | Mulder, J.R., P.F.J. Franzen, L.J. Keunen en A.J.M. Zwart, (2003): In de ban van de Betuwse dijken. Deel 4 Angeren. Een bodemkundig, archeologisch en historisch onderzoek naar de opbouw en ouderdom van de Rijndijk te Angeren (Over-Betuwe). Wageningen, Alterra. |
| Malburgen, Rijndijk | Mulder, J.R., L.J. Keunen en A.J.M. Zwart (2004): In de ban van de Betuwse dijken.Deel 5. Malburgen. Een bodemkundig, archeologisch en historisch onderzoek naar de opbouw en ouderdom van de Rijndijk te Malburgen/Bakenhof, Arnhem.Wageningen, Alterra. |
| Opheusden, Rijndijk | Mulder, J.R., P.F.J. Franzen, (2006): In de ban van de Betuwse dijken. Deel 6 Opheusden. Een bodemkundig, archeologisch en historisch onderzoek naar de opbouw en ouderdom van de Rijndijk te Opheusden (Neder-Betuwe). Wageningen, Alterra. |
| Vlaardingen, Maassluissedijk Vettenoord | Louwe, drs E. (Vestigia); Pierik, MSc H.J. (Vestigia); Flamman, drs J.P. (Vestigia) (2013): Dijkdoorgraving Maassluissedijk in het kader van de realisatie van de Doorverbinding Vettenoord - Centrum Westwijk te Vlaardingen; Een archeologische begeleiding (protocol opgraven) van de graafwerkzaamheden. DANS. https://doi.org/10.17026/dans-2x5-feem |
| Bunschoten, Westdijk | van Benthem, Drs A. (ADC ArcheoProjecten) (2017): Eemdijk Dijkverbetering Een coupure door de Eemdijk bij Bunschoten-Spakenburg. DANS. https://doi.org/10.17026/dans-zc3-f6vf |
| Lent, Bemmelsedijk | Rondags, drs. E.J.N. (RAAP) (2019): Lent zones K en L, archeologisch dijkonderzoek, gemeente Nijmegen. DANS. https://doi.org/10.17026/dans-ze9-ars8 |
Open Research
DATA AVAILABILITY STATEMENT
Data sharing is not applicable to this article as no new data were created or analyzed in this study.


