Comprehensive performance evaluation of stormwater management measures for sponge city construction: A case study in Gui'an New District, China
Funding information: Guizhou Science and Technology Department, Grant/Award Number: Qianke He[2016] supporting 2903; National Natural Science Foundation of China, Grant/Award Number: 51739009
Abstract
Climate change and rapid urbanization have increased pressure on drainage systems, posing new challenges to preventing and controlling urban waterlogging. In 2013, China proposed the Sponge City, a strategic measure for urban waterlogging control. This study quantifies the effects of stormwater management measures in runoff reduction for different levels of rainfall and conducts a one-dimensional visual analysis of urban waterlogging risks. At the same time, the best cost-effective scheme is determined based on life-cycle cost, analytic hierarchy process, and regret decision theory. The results showed stormwater management measures could realize the function of runoff control and waterlogging prevention, especially under low precipitation. However, these measures were still not enough to eliminate waterlogging risk. Combined measures have stronger runoff control capabilities than single measures. Considering economic, environmental, and operational impacts comprehensively, the combined measures of bio-retention (BR), permeable pavement (PP), and green roof (GR) were determined as the best cost-effective scheme because of the lowest regret value. The proposed method is helpful to provide reference and decision-making basis for the construction of sponge cities in the future.
1 INTRODUCTION
Urban waterlogging is a common natural disaster that adversely affects agriculture, transportation, cities, and industries, seriously affecting the lives and property safety of urban residents (Ma et al., 2020). It is generally believed that there are two main reasons for urban flooding: First, accelerated urbanization has led to an increase in impervious surface area, weakened infiltration process, changed the hydrological mechanism of the underlying surface, and increased pressure on the urban drainage system. Second, as the average surface temperature rises, the frequency and intensity of extreme precipitation have increased in most land areas (Wang et al., 2020).
China is located in the Asian monsoon region and is one of the countries with the most frequent rainstorms in the world. Studies have indicated that: in the past half-century, the intensity and frequency of extreme precipitation in China have shown a rising trend. Moreover, the rapid development of cities and concentration of population have made waterlogging more serious. The control of urban waterlogging disasters has attracted more and more attention under such circumstances. Traditional prevention measures mainly use basic drainage facilities to capture and transport runoff. Drainage measures are called gray infrastructures due to their single function and limited drainage capacity taking “Quick Elimination” and “End Concentration” control as implementation concepts. However, it cannot fundamentally solve the urban waterlogging, and the construction cost is very high. Facts have proved that it is expensive and unsustainable to alleviate urban waterlogging by expanding the drainage system alone, especially for urbanized areas in developed countries (Qin et al., 2013). Therefore, we need to explore a new and effective alternative method to deal with urban waterlogging.
Due to the requirements for ecological infrastructure construction and improvement of environmental protection awareness in recent years, some foreign academics have proposed a new type of infrastructure-Green Infrastructure (GI) taking “Slow-release” and “Source decentralized” control as the primary implementation principles. With the proposal of GI, various countries have proposed a variety of stormwater management measures that meet their own needs, such as North America and New Zealand's low impact development (LID), the United Kingdom's sustainable urban drainage system, Australia's water-sensitive urban design, and China's sponge cities. China first proposed Sponge City in 2013, which was not clearly defined until 2014. As a new generation of stormwater management concepts, the purpose is to infiltrate, retain, and release water through the LID principle to imitate pre-development hydrology (Wang et al., 2017). Unlike traditional technology, sponge city construction (SCC) follows the principles of ecological priority and combines natural and man-made activities. On the premise of ensuring the safety of urban drainage; it can accumulate, infiltrate, and purify stormwater to a maximum extent, promote utilization of stormwater resources, and protect of ecological environment. Commonly used stormwater management measures include bio-retention (BR), permeable pavement (PP), green roof (GR), grass ditch, rain barrel, and so on. Previous studies have shown that many contributions have been made to the development of stormwater management through multi-scale experiments and modeling (Gang & Dai Zong, 2020). Villarreal and Bengtsson (2004) found that a GR can effectively reduce the total runoff through multi-scale experiments. A detention pond has a prominent effect of weakening the flood peak in the event of rainfall in 10a. Rushton (2001) showed that full-scale PP can reduce 50% of surface runoff. Dietz (2007) found that GRs have retained a large percentage of rainfall (more than 50%) in different climates. A study by DeBusk and Wynn (2011) in parking lots found that BR can cumulatively reduce runoff by 97%. Lee et al. (2013) research show that the runoff volume was reduced by 33%–37% with a stormwater management measures system in Korea. Mao et al. (2017) designed four aggregate LID-BMPs; the best one showed a 40% reduction in flow volume.
Most of the above studies show the basic runoff reduction effect of stormwater management measures. However, the specific control effect of these measures on waterlogging disaster risks and risk visualization technology still lack relevant research. Moreover, in the practical application of stormwater management measures, the economic cost is also an essential factor in determining whether it can be widely used in the SCC. Some studies only consider construction costs when evaluating project costs (Caihong et al., 2019; Liu et al., 2015). Some studies applied a life-cycle cost method, which added the consideration of project maintenance costs. De Sousa et al. (2012) used life-cycle analysis to evaluate the combination of green and gray sewer scenarios; Liao et al. (2015) adopted Life cycle cost method to calculate the costs of these low-impact development measures; Rehan et al. (2018) conducted life cycle cost analysis on traditional and PPs; Li et al. (2020) judged the effect of each measure by comparing the hydrological effects and life cycle cost. Although hydrological benefits and implementation costs are the primary considerations when selecting the best stormwater management measure. Other impacts brought about by these measures, such as environmental impact and operational impact, will also affect the final decision (Martin et al., 2007). How to comprehensively evaluate the cost-effectiveness of stormwater management measures still needs consideration.
The SWMM software is widely used in urban flood research, and it is also essential to apply it to SCC. Therefore, this study selects a typical study area and a comprehensive evaluation system to evaluate the cost-effectiveness of stormwater management measures based on the SWMM model. The runoff control effect and waterlogging risk reduction effect of stormwater management measures are compared and analyzed, and the risk distribution is visualized. Based on life-cycle cost analysis, combined with the regret decision theory method and analytic hierarchy process, the hydrological benefits, economic costs, environmental impacts, operational impact of stormwater management measures are considered, and their cost-effectiveness was comprehensively evaluated. The optimal stormwater management measures scheme was determined, which provided a critical decision-making basis for constructing sponge cities in the future.
2 MATERIALS AND METHODS
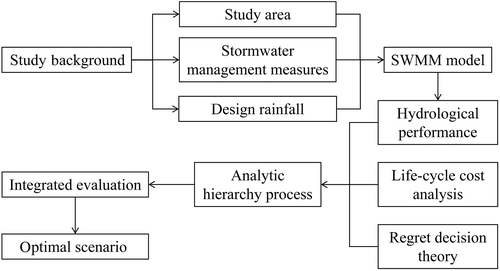
The research can be divided into five main stages: model calibration and verification, hydrological performance analysis, life-cycle cost analysis, analytic hierarchy process, and regret decision theory. The Research flowchart is shown in Figure 1.
2.1 Study area
The study area is the Gui'an New District Demonstration Zone, a SCC demonstration area in Gui'an New District, located between Guiyang City and Anshun City, Guizhou Province, China (Figure 2). Gui'an New District is China's first national-level new district guided by ecological civilization; the area experienced flooding in 1985, 1996, 2003, 2007, 2011, and 2014. Currently, the new district does not have a complete drainage system and is highly urbanized. The natural drainage pattern has changed, and the rainwater storage capacity has been reduced, incredibly aggravating the risk of urban waterlogging. The study area is located in the humid monsoon climate zone of the northern subtropical plateau, with an average annual precipitation of 1225.6 mm. The wet season is mainly concentrated from May to October, accounting for 87% of the annual rainfall. The emergence of extreme rainstorms caused by climate change will increase the risk of waterlogging disasters. The selection of this region for research is representative.
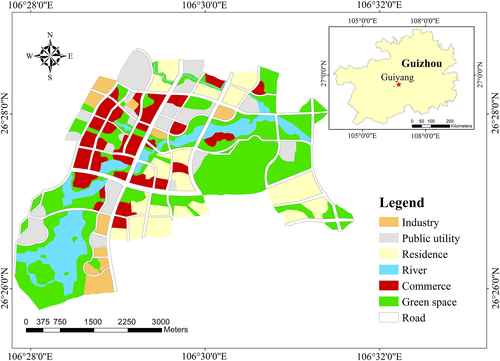
The study area has a planned land area of 19.1 km2. It has many different types of land use, including residential area (12.94%), business district (12.53%), public utilities (9.67%), industrial area (4.18%), green space (37.91%), water (10.92%), and roads (11.84%). The detailed location and land-use distribution map is shown in Figure 2.
2.2 Model application
This study used Storm Water Management Model 5.1 (SWMM 5.1) to simulate urban hydrological processes with stormwater management measures. There are various types of urban flood-related models. Yin et al. (2016) utilized the hydrodynamic model (FloodMap -HydroInundation2D) to simulate overland flow and flood inundation. Broekhuizen et al. (2019) studied the model structure differences of three models (SWMM, SHE, and MOUSE) used for urban floods and their impact on simulation results. Yang et al. (2020) proposed a new method for urban flood modeling by coupling a one-dimensional SWMM and a two-dimensional flood inundation model, proving that the simulation results are reliable. Research shows that the SWMM model is still the most widely used in the model in urban flood simulation (Hu et al., 2020). SWMM is a dynamic precipitation-runoff simulation model developed by the US EPA. More importantly, it has a module with eight kinds of stormwater management technologies. Different stormwater management types and design parameters can be set during modeling to study different stormwater management measure performances. The SWMM model has been widely used in stormwater management research and is more suitable for hydrological simulation in urban areas than other models. For instance, Limos et al. (2018) used SWMM to conduct research and showed that GRs significantly impact stormwater in urban areas. Ahiablame and Shakya (2016) assessed flood reduction capabilities of porous pavement, rain barrels, and rain gardens in central Illinois using the SWMM. Liong et al. (1995) took a community in Singapore as an example and found that simulation results of the SWMM model applied to this area have high accuracy.
2.2.1 Data availability and processing
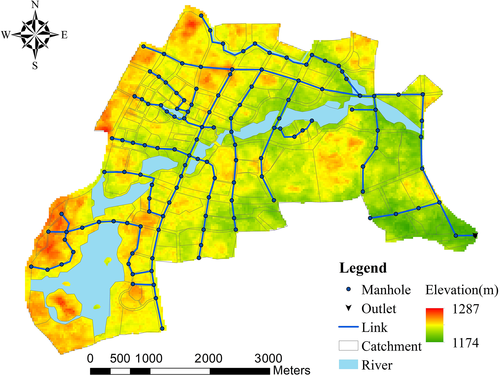
Model building requires four types of data: land use, drainage network, DEM data, and hydrological records. The land-use distribution was from the interpreted satellite remote sensing data and presented in ArcGIS. The pipe network data includes the basic information of pipes and nodes. Under the condition that the model is true and accurate, ArcGIS is used to ignore or merge the pipe network of branch roads and retain the pipe network of the main road. It generalizes the existing stormwater pipe network into a pipe network model. Hydrological records include measured rainfall and runoff data used to calibrate and validate models. After basic processing, these data can be used to build models. The drainage network of this model consists of 108 manholes, 105 pipes, 4 cisterns, and 1 outlet. The entire research area is divided into 143 sub-catchments according to street layout and pipe network, and each sub-catchment has a separate slope, impermeability, and connected drainage points. The generalized pipe network model is shown in Figure 3.
2.2.2 Model calibration and validation
The model calibration is mainly used to determine the following four uncertainty parameters: depression storage and manning coefficient in permeable and impervious areas. Depression storage refers to the initial loss of rainwater falling on the ground, reflecting the depth of depression in the catchment area, manning coefficient represents the roughness of the pipeline (Zhou et al., 2012). The empirical value range of the parameter can be obtained from the previous research, as shown in Table 3, but they need further calibration and verification.
2.3 Scenario design
This study conducted two types of scenario design, namely designing rainfall and stormwater management measures to increase the representativeness of results.
2.3.1 Design rainfall scenarios
The time-intensity-frequency curves of the 12 design rains are shown in Figure 4. Previous studies have shown that the rainfall characteristics in Gui'an New Area are most similar to those in Chicago. The Chicago pattern reflects a rainfall distribution pattern that the central government arbitrarily chose in the national standard. Therefore, using Formula (1) for the rainfall process in Chicago, four return periods (1a, 5a, 10a, and 20a) and three rainfall durations (1-, 2-, and 3-h) were calculated. The cumulative rainfall of the 1-h events was 33.5, 51.4, 59.1, and 66.8 mm at each return period. The cumulative rainfall of 2-h events was 40.2, 61.7, 70.9, and 80.1 mm at each return period. The cumulative rainfall of the 3-h events was 43.8, 67.1, 77.2, and 87.2 mm at each return period. By comparing the above data, the difference in total rainfall between the 1- and 3-h events under the same recurrence interval is relatively small.

2.3.2 Stormwater management measures
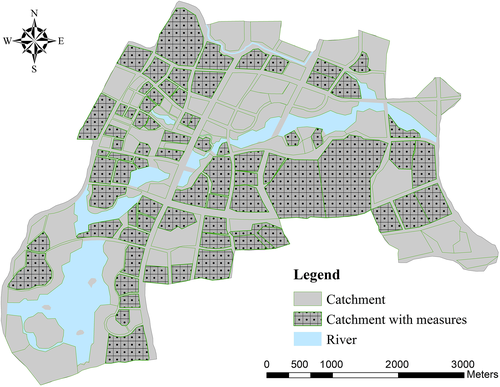
According to the national standard “Urban Land Classification and Planning and Construction Land Standard GB50137-2001” and “Guian New District Central Area Sponge City Special Plan,” three types of urban stormwater management have been determined: BR, PP, and GR. Seven scenarios can be obtained through combination, Table 1 listed the installation locations and overall installation dimensions; the specific installation location is shown in Figure 5.
| Measure options | Installing location | Installing dimension (km2) |
|---|---|---|
| BR | Green space, public land, commerce, industry | 2.13 |
| PP | Residence, commerce, public land, industry, green space | 2.01 |
| GR | Residence | 1.65 |
| BR + PP | Residence, commerce, public land, industry, green space | 4.14 |
| BR + GR | Residence, commerce, public land, industry, green space | 3.79 |
| PP + GR | Residence, commerce, public land, industry, green space | 3.66 |
| BR + PP + GR | Residence, commerce, public land, industry, green space | 5.79 |
2.4 Life-cycle cost analysis
After introducing the concept of green buildings in the early 1990s, it is necessary to use life-cycle cost accounting as a sustainable development assessment method to solve the economic pillar of sustainable development (Jianmin, 2017). The life-cycle cost includes three parts: expenditure of the construction phase, cost of operation and maintenance, and final residual value of the project (Yue & Tianyu, 2019).
2.5 Integrated evaluation
The comprehensive evaluation in this research includes two methods: the analytic hierarchy process (AHP) and regret decision theory.
2.5.1 Analytic hierarchy process
The AHP is an analysis method composed of qualitative and quantitative (Xie et al., 2017). Systematic and hierarchical are practical and effective in dealing with complex decision-making problems. It divides goals that need to be judged into multiple levels more conducive to understanding and calculation. Then, it evaluates these levels through the judgment matrix and calculates their respective weights (Saaty, 2008). This research divides performance evaluation into six targets from the four sides of technology, economy, environment, and operation, as shown in Table 2.
| Criteria | Technical | Economic | Environment | Operational | ||
|---|---|---|---|---|---|---|
| Indicator | Runoff volume reduction | Flow peak reduction | Time-to-peak delay | Life-cycle cost | Environment impact | Operational impact |
| Quantification | Objective calculation (%) | Objective calculation (%) | Objective calculation (%) | Objective calculation (Mil ¥) | Subjective evaluation, from 1 (low) to 6 (high) | Subjective evaluation, from 1 (low) to 6 (high) |
2.5.2 Regret decision theory
The regret value represents the performance of the evaluated stormwater management measures option among seven alternatives, and performance is better if the regret value is lower. But regarding the calculation of and , the calculation methods of different evaluation indicators are different. There are three technical evaluation indicators: runoff volume reduction (VR) rate, flow peak reduction (PR) rate, and time-to-peak delay rate (PD). The highest value among the seven stormwater management measure options was and lowest was . On the contrary, of the other three indicators was the lowest value among the seven stormwater management measure options, and the highest value was .
3 RESULTS AND DISCUSSION
3.1 Calibration and verification results
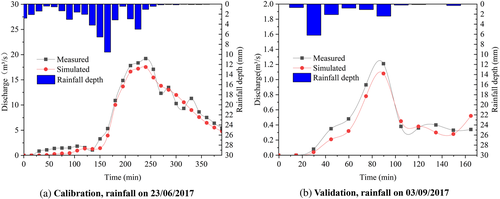
In this study, the automatic online monitoring of intelligent instruments was adopted to obtain continuous real-time runoff data. The drainage outlet is the actual runoff monitoring point that controls the entire study area. When the model is simulated, the flow process simulated by the SWMM model is compared with the measured flow process of the drainage outlet in the study area. Based on actual hydrological data, five measured rainfall and runoff events from the 23rd of May to the 3rd of September, 2017 were used to calibrate and verify the model. Among these, three events were used for calibration, and two were used for validation. The NSE values were 0.78 in the calibration process, and validation values were greater than 0.82. The relative error of flood peak flow was less than 15% which explained that the accuracy of the model could be accepted. Figure 6 shows the results of calibration and verification, and Table 3 lists the empirical ranges and optimal values of the parameters to be calibrated.
| Key parameters | Empirical value | Calibrated value | |
|---|---|---|---|
| Manning coefficient | Impervious zone | 0.015 | 0.016 |
| Permeable zone | 0.2 | 0.18 | |
| Pipeline | 0.011 | 0.015 | |
| River course | 0.03 | 0.026 | |
| Depression storage | Impervious zone | 3.5 | 3.2 |
| Permeable zone | 6.8 | 6.5 | |
3.2 Runoff control by stormwater management measures
Table 4 counts the specific data of the three indicators runoff VR, flow peak reduction (PR), and time-to-peak delay (PD). It can be seen from the changes in the data that stormwater management measures have a specific effect on runoff control. The results show that the performance of stormwater management measures on runoff control is affected by different rainfall scenarios. The effect is best for rainfall with a return period of 1 year and a duration of 180 min. The maximum runoff and peak flow reduction rates are 60.97% and 87.12%, with peak occurrence time extended to 90%.
| Design rainfall scenario | r (60.1) | r (120, 1) | r (180, 1) | r (60, 5) | r (120, 5) | r (180, 5) | r (60, 10) | r (120, 10) | r (180, 10) | r (60, 20) | r (120, 20) | r (180, 20) | |
|---|---|---|---|---|---|---|---|---|---|---|---|---|---|
| Cumulative rainfall (mm) | 33.5 | 40.21 | 43.78 | 51.37 | 61.65 | 67.13 | 59.07 | 70.89 | 77.19 | 66.76 | 80.13 | 87.25 | |
| Runoff volume reduction (%) | BR | 5.53 | 6.69 | 39.03 | 3.22 | 1.57 | 16.19 | 2.95 | 1.32 | 11.01 | 2.69 | 0.61 | 9.78 |
| PP | 3.28 | 0.92 | 20.75 | 2.16 | 1.04 | 7.47 | 1.31 | 1.99 | 4.84 | 1.86 | 1.26 | 3.82 | |
| GR | 4.36 | 3.48 | 25.17 | 1.90 | 1.16 | 5.09 | 1.70 | 2.71 | 0.99 | 1.34 | 1.51 | 1.47 | |
| BR + PP | 26.48 | 28.19 | 49.57 | 21.59 | 25.34 | 34.57 | 21.34 | 25.17 | 31.30 | 20.82 | 24.47 | 28.49 | |
| BR + GR | 21.49 | 22.49 | 51.11 | 14.82 | 18.58 | 30.31 | 14.36 | 18.19 | 26.09 | 13.57 | 17.39 | 24.27 | |
| PP + GR | 16.10 | 19.51 | 37.50 | 14.41 | 19.49 | 24.90 | 15.08 | 16.08 | 22.66 | 12.69 | 15.92 | 20.01 | |
| BR + PP + GR | 41.56 | 43.23 | 60.97 | 39.00 | 42.21 | 47.91 | 39.08 | 42.24 | 45.62 | 36.10 | 39.43 | 43.87 | |
| Flow peak reduction (%) | BR | 31.84 | 27.86 | 58.71 | 18.39 | 17.23 | 33.24 | 17.45 | 17.75 | 29.34 | 16.90 | 17.57 | 27.48 |
| PP | 9.74 | 9.15 | 31.06 | 4.52 | 6.26 | 11.87 | 5.92 | 8.50 | 10.06 | 5.59 | 7.05 | 9.26 | |
| GR | 19.84 | 18.10 | 43.18 | 11.58 | 11.57 | 22.86 | 11.84 | 12.71 | 19.87 | 10.86 | 11.87 | 17.13 | |
| BR + PP | 43.84 | 39.84 | 68.43 | 31.38 | 29.76 | 45.22 | 29.49 | 29.48 | 40.94 | 27.47 | 26.19 | 38.25 | |
| BR + GR | 51.31 | 47.53 | 73.61 | 37.57 | 35.42 | 52.33 | 35.68 | 34.18 | 48.78 | 33.48 | 32.76 | 45.83 | |
| PP + GR | 34.78 | 32.72 | 56.69 | 24.98 | 24.76 | 37.05 | 24.84 | 38.20 | 33.92 | 24.08 | 26.41 | 30.61 | |
| BR + PP + GR | 76.22 | 72.71 | 87.12 | 70.55 | 67.59 | 74.27 | 69.34 | 66.68 | 72.16 | 65.80 | 65.05 | 69.74 | |
| Time-to-peak delay (%) | BR | 16.10 | 12.77 | 27.36 | 7.92 | 5.51 | 15.34 | 6.12 | 1.59 | 12.5 | 4.79 | 1.36 | 10.03 |
| PP | 5.93 | 4.96 | 11.79 | 2.97 | 1.57 | 6.25 | 2.04 | 1.38 | 4.76 | 3.87 | −3.04 | 4.07 | |
| GR | 10.17 | 8.51 | 17.45 | 6.93 | 3.94 | 9.66 | 5.10 | 1.59 | 7.74 | 4.16 | 0.86 | 6.27 | |
| BR + PP | 21.19 | 16.31 | 36.79 | 10.89 | 7.09 | 19.32 | 9.18 | 3.17 | 15.48 | 8.98 | 1.05 | 13.71 | |
| BR + GR | 27.12 | 20.57 | 45.75 | 15.84 | 10.24 | 23.86 | 12.24 | 6.35 | 19.64 | 10.35 | 4.39 | 15.22 | |
| PP + GR | 15.25 | 11.35 | 25.47 | 9.90 | 5.51 | 14.20 | 8.16 | 6.35 | 11.31 | 8.01 | 0.78 | 9.93 | |
| BR + PP + GR | 57.63 | 42.55 | 90.09 | 35.64 | 25.20 | 47.73 | 29.59 | 19.05 | 40.48 | 27.75 | 14.08 | 37.55 | |
The control effect of stormwater management measures on runoff volume decreased with the increase of rainfall return period because of limited infiltration capacity. When the rainfall duration was 180 min, the runoff VR rate of BR decreased from 39.03% in 1a to 9.78% in 20a. In addition, from the data of the three indicators (VR, PR, and PD), it can be seen that measures are more effective for rainfall with a duration of 180 min. When the rainfall return period was 5-years, the flow PR rate of BR increased from 18.39% at 60 min to 33.24% at 180 min.
As seen in Table 4, the runoff control capacity of the combination of stormwater management measures is better than that of a single measure because they can complement each other's advantages and have an enormous scope of implementation. The combination of BR + PP + GR showed the best runoff control ability with the highest VR of 60.97%, highest PR of 87.12%, and PD of up to 90%. The role of BR is more critical in combination measures because it has a vital interception and infiltration capabilities. The effectiveness of BR on runoff reduction is greater than that of PP and GR, and the rate of VR, PR, and PD are 39.03%, 58.71%, and 27.36%, respectively. Overall, the runoff control capacity of stormwater management measures decreased with increasing rainfall grade, and the combination of BR + PP + GR has the best runoff control effect among the seven options.
3.3 Urban waterlogging risk reduction by stormwater management measures
Since the BR + PP + GR combination has the best runoff control effect, to further verify its ability to control urban waterlogging, waterlogging disaster simulations were performed on the current drainage systems. The new drainage system added stormwater management measures under 12 design rainfalls. The cumulative overflow of nodes in the results of the SWMM model can reflect the amount of water overflowing from the pipe network to the ground to a certain extent. The overflow point is marked as a ponding point. In addition, a comprehensive analysis of the overflow time and total overflow volume, the longer node overflow time, larger the overflow volume, and higher waterlogging risk caused by the ponding point. The node overflow volume and node overload time in every rainfall event is given the same weights, and a comprehensive ranking of the ponding points is calculated. According to the comprehensive ranking, the ponding points are divided into three levels, corresponding to the three levels of waterlogging risk. The waterlogging risk distribution of these two different systems is visualized in Figures 7 and 8, respectively. In these figures, different colored ponding points indicate different degrees of waterlogging risk. The ponding points are divided into three categories: low-risk points, medium-risk points, and high-risk points. The ground condition is presented by different colored surfaces indicating different land-use types.
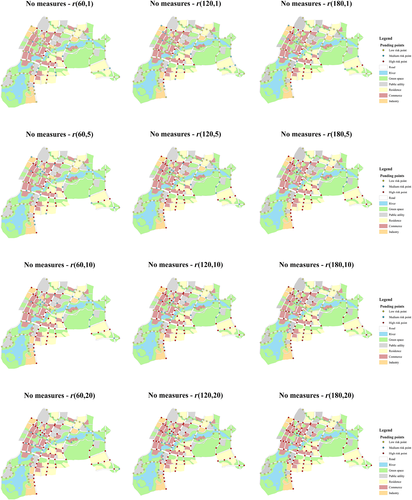

It can be seen from Figure 7 that relying only on current drainage capacity, and the waterlogging risk is still very high. The topography of the central and southern regions is relatively low; most of them are commercial and residential areas with high impermeability. Most of the runoff flows into and gathers in this area, which increases the burden of drainage, so the risk of waterlogging disaster is greater. In addition, the higher the return period and the longer the rainfall duration also higher the risk of waterlogging disaster. The rainfall with a return period of 20 years and 180 min has the highest risk of waterlogging.
From Figure 8, the waterlogging risk has been significantly reduced after implementing stormwater management measures (BR + PP + GR). Implementing the measures can increase penetration, and less surface runoff was generated. At the same time, some measures can hold a portion of runoff and reduce the burden on the drainage system. Combined with the installation location of stormwater management measures (Figure 5), the level of ponding points near the implementation of stormwater management measures has been reduced to a certain extent. In contrast, ponding points in other areas without stormwater management measures have been slightly reduced or unchanged.
The results show differences in the urban waterlogging control effects of stormwater management measures with different return periods and rainfall durations. The stormwater management measures were more effective under the rainfall event with a return period of 1 year and a duration of 180 min. Under this rainfall, stormwater management measures' VR, PR, and PD are the highest. The ability to control runoff is the strongest, which greatly reduces the risk of waterlogging. However, due to the limited capacity of stormwater management measures, the effect of urban waterlogging control under a higher return period and more extended rainfall duration events is not significant.
3.4 Life-cycle analysis
Based on the construction scale in Table 1 and empirical costs in Table 5, the life-cycle cost values of the seven scenarios are determined using the calculation formula of Equation (3). The empirical capital costs and the annual cost of stormwater management measures were summarized through recent research in Table 5. Simultaneously, according to domestic and international research on LID operation and maintenance costs, maintenance costs are usually taken as a percentage of the initial cost (Liao et al., 2015; Xie et al., 2017). This article uses this method, and the corresponding annual maintenance fee is 3%.
| Measures option | Installing dimension | Unit | Empirical capital cost (¥/unit) | Empirical annual cost (¥/unit) | Empirical lifespan (year) | Local land Price (¥/m2) | Assigned capital cost (¥/unit) | Assigned annual cost (¥/unit) | Assigned lifespan (year) | Salvage value (¥/unit) | Life-cycle cost (Mile ¥) |
|---|---|---|---|---|---|---|---|---|---|---|---|
| BR | 2.13 × 10⁶ | m2 | 40–50 | 1.2–1.5 | 20–50 | 1352 | 40 | 1.2 | 40 | 1.17 | 3011.02 |
| PP | 2.01 × 10⁶ | m2 | 60–200 | 1.8–6 | 8–40 | / | 120 | 3.6 | 40 | 3.51 | 371.60 |
| GR | 1.65 × 10⁶ | m2 | 100–300 | 3–9 | 20–50 | / | 120 | 3.6 | 40 | 3.51 | 305.04 |
| BR + PP | 4.14 × 10⁶ | 3382.62 | |||||||||
| BR + GR | 3.78 × 10⁶ | 3317.06 | |||||||||
| PP + GR | 3.66 × 10⁶ | 676.64 | |||||||||
| BR + PP + GR | 5.79 × 10⁶ | 3687.66 |
The land costs of different cities may also be quite different. This study determined the land price to be 1352 ¥/m2 based on the data released by the Land and Resources Bureau of Gui'an New District in 2018. The values of capital cost, annual cost, and empirical lifespan refer to the SCC projects that have been implemented in Beijing. To reduce the influence of variables on the research results, set the life of all measures to 40 years. Moreover, the sum of LCC values of single measures was equal to the value of combined measures.
3.5 Integrated evaluation
As mentioned in Section 2.5, the comprehensive assessment of stormwater management measures is a multi-index evaluation process involving six technical, economic, environmental, and operational indicators. In the case of a design rainfall event with a rainfall duration of 180 min and a return period of 1 year, numerical evaluation and simulation results were performed, and six indicator performance values for each scenario were determined, as shown in Table 6. The first three technical indicators directly use the simulated result value, and the economic indicator (LCC) uses the PVC calculation value of stormwater management measure options in Section 3.4.
| Measures option | VR (%) | PR (%) | PD (%) | LCC (Mil ¥) | EI | OI |
|---|---|---|---|---|---|---|
| BR | 39.03 | 58.71 | 27.36 | 3011.02 | 2 | 1 |
| PP | 20.75 | 31.06 | 11.79 | 371.60 | 1 | 2 |
| GR | 25.17 | 43.18 | 17.45 | 305.04 | 3 | 3 |
| BR + PP | 49.57 | 68.43 | 36.79 | 3382.62 | 3 | 3 |
| BR + GR | 51.11 | 73.61 | 45.75 | 3317.06 | 5 | 4 |
| PP + GR | 37.50 | 56.69 | 25.47 | 676.64 | 4 | 5 |
| BR + PP + GR | 60.97 | 87.12 | 90.09 | 3687.66 | 6 | 6 |
The values of EI and OI need subjective evaluation and determined their values by analyzing the structure of stormwater management measures. The EI describes how much stormwater management measures have changed the surrounding environment; it was determined according to the external characteristics of stormwater management measures. For instance, GR refers to a form of landscape roof built on the roof of the building, plants, and plant growth substrates are added to the roof, and external characteristics of the roof are entirely changed, so it was designated as the highest value of 3 in a single measure. In contrast, PP refers to the use of porous asphalt or concrete pavement with strong permeability, which does not change the appearance of the road; so it was designated as the lowest value of 1 in a single measure. The sum of EI values of single measures was equal to the value of combined measures.
The OI describes the amount of work required for the construction and maintenance of stormwater management measures; values are determined by analyzing the structural complexity of these measures. The typical structure of a GR consists of five layers, the surface layer is vegetation, the second layer is the base layer, the third layer is the drainable root barrier, the fourth layer is the heat insulation layer, and the fifth layer is waterproof. The construction structure of GR is more complicated; therefore, it was designated the highest value of 3 in a single measure. On the contrary, BR consists of only two layers (including aquifer and overburden), and the structure is relatively simple, so the lowest value of 1 in a single measure was taken. The sum of OI values of single measures was equal to the value of combined measures.
Since the value of EI and OI for each decision cannot exceed 6, a combination of measures includes multiple individual measures. For a single measure, the highest value of EI and OI is designated as 3. The specific values are shown in Table 6.
Using the AHP to calculate the relative weight of the six indicators indicates each indicator's importance. Hua et al. (2020) introduced the weight calculation method of different indicators in detail, and this article uses it as a reference for the weight of each indicator. Furthermore, through the calculation of regret decision theory, the value in Table 6 is converted into the regret value in Table 7. The regret value ranges from 0 to 1, indicating different levels of regret.
| Indicator | VR | PR | PD | LCC | EI | OI | Integrated regret value |
|---|---|---|---|---|---|---|---|
| Weight | 0.2622 | 0.2622 | 0.2622 | 0.1031 | 0.0663 | 0.044 | |
| Measures option | Regret value | ||||||
| BR | 0.55 | 0.51 | 0.80 | 0.80 | 0.20 | 0.00 | 0.58 |
| PP | 1.00 | 1.00 | 1.00 | 0.02 | 0.00 | 0.20 | 0.80 |
| GR | 0.89 | 0.78 | 0.93 | 0.00 | 0.40 | 0.40 | 0.73 |
| BR + PP | 0.28 | 0.33 | 0.68 | 0.91 | 0.40 | 0.40 | 0.48 |
| BR + GR | 0.25 | 0.24 | 0.57 | 0.89 | 0.80 | 0.60 | 0.45 |
| PP + GR | 0.58 | 0.54 | 0.83 | 0.11 | 0.60 | 0.80 | 0.60 |
| BR + PP + GR | 0.00 | 0.00 | 0.00 | 1.00 | 1.00 | 1.00 | 0.21 |
As demonstrated by the results, BR has a smaller regret value in terms of technical indicators, indicating that its performance is better among the single measures. In contrast, PP has a less environmental impact, and GR has the lowest economic cost. Among the combination options, BR + PP + GR has the best technical performance because the regret value in terms of technical indicators is 0.
Judging from the integrated regret value, the single measures have a greater value than the combination of multiple measures. It means that the combined use of stormwater management measures is better than single measures. The integrated regret value of BR + PP + GR is the lowest at 0.21, which is the best cost-effective scheme. Although it has the highest life-cycle cost, it brings the best hydrological performance, thus guaranteeing the best cost-effectiveness.
4 CONCLUSIONS
- Different stormwater management measures have different functions. Combined measures have a more substantial runoff control effect than a single measure. The BR + PP + GR combination shows the best runoff control ability, and the role of BR is more critical. The impact of BP on runoff reduction is greater than that of PP and GR because of the stronger permeability.
- Stormwater management measures have different control effects on urban waterlogging risk under different rainfall conditions. Using ponding points to visualize the risk of urban waterlogging by analyzing the overflow time and total overflow amount, it can be seen that implementing stormwater management measures can alleviate urban waterlogging. Still, its control effect will weaken with an increase in the rainfall return period. Stormwater management measures are more effective when the rainfall is small. However, the function of these measures is still not enough to eliminate waterlogging risk completely.
- Based on the life-cycle cost analysis, analytic hierarchy process, and regret decision theory, an integrated evaluation was used to assess the stormwater management measures performance in terms of technical, economic, environmental, and operational. Finally, the combination of BR + PP + GR was determined as the best option because of the lowest regret value.
Due to the model's generalization to the actual situation and the uncertainty of the data, simulation results may be different from the actual situation. The qualitative conclusion based on the comparison has a certain reference significance. This research has obtained the best SCC plan for the Gui'an New District Demonstration Zone by testing and analyzing the program in different scenarios. As a case study, the results of this study are not fully applicable to other areas with different features, but the modeling and evaluation methods used in this study can be used for decision-making in other projects. The measured rainfall data in this study is lacking, and waterlogging risk division is too subjective. Future research should focus on constructing refined urban flood models in areas lacking rainfall data and the objective division of risk areas.
CONFLICT OF INTEREST
The authors declare that they have no known competing financial interests or personal relationships that could have appeared to influence the work reported in this article.
Open Research
DATA AVAILABILITY STATEMENT
The data used in this study are the actual data detected by the experimental station set up by the Guizhou Province Science and Technology Support Plan Project. Restrictions apply to the availability of these data, which were used under license for this study.


