Plasma hsa-mir-19b is a potential LevoDopa therapy marker
Chis and Moatar contributed equally to this work.
Abstract
Parkinson's disease (PD) is the second most common neurodegenerative disorder among the elderly, the diagnostic and prognostic of which is based mostly on clinical signs. LevoDopa replacement is the gold standard therapy for PD, as it ameliorates the motor symptoms. However, it does not affect the progression of the disease and its long-term use triggers severe complications. There are no bona fide biomarkers for monitoring the patients’ response to LevoDopa and predicting the efficacy of levodopa treatment. Here, we have combined qPCR microRNA array screening with analysis of validated miRs in naïve versus Levodopa-treated PD patients. We have identified plasma miR-19b as a possible biomarker for LevoDopa therapy and validated this result in human differentiated dopaminergic neurons exposed to LevoDopa. In silico analysis suggests that the LevoDopa-induced miR-19b regulates ubiquitin-mediated proteolysis.
1 INTRODUCTION
Parkinson's disease (PD) is the second most common motor neurodegenerative disorder among the elderly. PD is characterized by the progressive loss of dopaminergic neurons in the substantia nigra pars compacta.1 Due to the lack of specific and sensitive tests or biomarkers, both the diagnostic and the prognostic of PD are based entirely on clinical features, such as the type and severity of symptoms, age, gender or response to therapy.2 The most commonly used pharmacological treatment for PD aims to ameliorate the motor symptoms by compensating for the dopamine deficit. This is mainly done through replacement therapy (LevoDopa) with inhibition of Monoaminoxidase (MAO) and Catechol O-methyltransferases (COMT) activity in the periphery (carbidopa, benserazide).3 Long-term LevoDopa usage associates almost invariably with additional motor side effects and cognitive and neuro-psychiatric events, while it does not affect or change the natural progression of cell degeneration towards non-dopaminergic neural circuits.4 LevoDopa's altered metabolism in PD patients governs the deleterious feedbacks between the main pathogenic axes, including mitochondrial dysfunction, toxic metabolites, proteasome alteration and alpha-synuclein aggregation, thus turning the PD cure into a curse in disguise.5
MicroRNAs (miRs) are a class of endogenous, small non-coding RNAs able to post-transcriptionally modulate gene expression by binding to complementary sequences in target messenger RNAs (mRNAs). One single miR may alter the stability of hundreds of targets, while several miRs may cooperatively interact with one single mRNA and thus regulate the expression of over one-third of the coding genes in humans.6 Due to their outstanding stability in various body fluids, miRs are ideal biomarker candidates in various diseases, including PD.7 Interestingly, in PD patients, most of the miRs were shown to be deregulated, with decreased levels in total blood, serum, and white blood cells, while most of the plasma miRs are up-regulated.8-24 However, there is a large discrepancy among these results, presumably due to several differences in their experimental setups. Moreover, many patients are treated with LevoDopa for several years, which could also affect the miRs levels. To shed light on these discrepancies, we aimed to investigate the levels of miRs in the plasma of LevoDopa-treated PD patients.
In our study, we made use of the sensitivity and specificity of the qRT-PCR technique to quantify in a two-step (discovery and validation) approach the mature miR species that are present in the plasma of LevoDopa-treated PD patients. Analysis of the validated miRs in naïve vs. LevoDopa-treated PD patients identified plasma miR-19b as a sensitive biomarker for LevoDopa therapy, a result further validated in mouse hippocampi and human differentiated dopaminergic neurons exposed to LevoDopa.
2 MATERIAL AND METHODS
The present study has been performed in concordance with the Declaration of Helsinki Code of Ethics and has been reviewed and approved by the local institutional ethics review board.
All Discovery- and Validation lots patients have been recruited through the Neurology Clinic of the County Hospital Timisoara and have signed informed consent. The diagnosis of PD was made following International Parkinson and Movement Disorder Society clinical diagnostic criteria for PD.25 Exclusion criteria included cognitive impairment, inability to sign the informed consent, an associated diagnostic of cancer and/or autoimmune disease, and a recent history of head or spinal cord trauma. Control patients are individuals that have addressed the Neurology Clinic and for whom, after clinical and paraclinical examination, a neurological pathology has been excluded.
The naive (and the corresponding post LevoDopa therapy) plasma samples have been provided by the Harvard NeuroDiscovery Center (Center for Neurological Diseases, Brigham & Women's Hospital) and the Neurology Clinic of the County Hospital Timisoara. The demographics and clinical characteristics of the discovery lot, the validation lot, and the post-therapy lot are presented in Table 1.
| Discovery lot | Validation lot | Naive lot | |||
|---|---|---|---|---|---|
| Patients | Controls | Patients | Controls | Harvard | |
| No. | 10 | 10 | 66 | 29 | 10 |
| Gender ratio | 6/4 | 6/4 | 35/31 | 14/15 | 7/3 |
| Median age (standard deviation) | 65.9 (6.1) | 68.1 (6.4) | 68 (9.1) | 63.5 (9.1) | 67.2 (6.6) |
| Average Y&H stage (standard deviation) | 1.9 (0.70) | - | 2.5 (0.8) | - | - |
Peripheral blood was collected between 9 AM and 12 AM in EDTA-coated vacutainers by puncture of the cubital vein; next, the blood was refrigerated at 4°C, processed by centrifugation within the next 2 h, and the plasma fraction stored at −80°C until further use. Plasma samples with signs of hemolysis, turbidity, hyperlipidemia or hyperbilirubinemia have been discarded. After thawing, all plasma samples were again centrifuged for 5 min at 1500 g and 4°C to eliminate precipitates and cell debris contaminants. Total RNA was extracted from 200 μl of plasma (100 μl in case of Harvard lot) using the miRNeasy Serum/Plasma kit (Qiagen), with Caenorhabditis elegans miR-39 miRNA mimic as a spike-in control for external normalization.
2.1 LevoDopa treatment of mice
The experiments involved two lots (experimental and control) of six one-year-old wild-type mice (three males, three females) of mixed genetic background, housed in Udel® polysulphone cages, on a 12-h light-dark cycle and fed ad libitum. L-DOPA (Sigma) and Benserazide hydrochloride (Sigma) solutions were prepared freshly (30 min before injections) in physiological saline and administered for 5 days, by two 12-h spaced intraperitoneal injections at 20 mg/kg and 12 mg/kg, respectively. The control lot was injected using the same protocol with equal amounts of Benserazide hydrochloride. The mice were sacrificed on the 6th day, and the hippocampi dissected and stored in RNAlater at −80°C. Total RNA was extracted using the miRVANA kit according to the manufacturer's indications and stored at −80°C until further use.
2.2 Dopaminergic cells culture
LUHMES cell differentiation to dopaminergic neural cells was performed as previously described.26 Briefly, LUHMES cells were cultured for 24 h in a Dulbecco's modified Eagle's medium (DMEM)/F12 with 1% N2-supplement and 0.04 μg/ml basic fibroblast growth factor then differentiated for 5 days in DMEM/F12 with 1% N2-supplement, 1 μg/ml tetracycline, 0.49 mg/ml dibutyryl cyclic AMP and 2 ng/ml glial cell-derived neurotrophic factor. Differentiated dopaminergic cells were exposed for 24 h to three different concentrations of LevoDopa (10 µM, 20 µM and 50 µM) and then washed with 1x PBS, collected and the pellet frozen at −80°C until further use. Total RNA was extracted using the miRVana kit according to the manufacturer's indications and stored at −80°C.
2.3 miRNA and target genes quantification
For discovery lot samples, reverse transcription by miScript II RT Kit, Qiagen (with identical RNA inputs) followed by qRT-PCR quantification of 1008 unique human miRNAs on a Human miRNome miScript miRNA PCR Array, Qiagen was performed according to the manufacturer's protocols. MiRs showing expression in all samples were used for data analysis by ∆∆CT method of relative quantification with normalization to C. elegans miR-39 miRNA spike-in.27 Validation step and LevoDopa-induced miR data set analysis.
For the validation lot, the naïve/post-therapy plasma samples, and the LUHMES cells experiments, reverse transcription was performed using the TaqMan® MicroRNA Reverse Transcription Kit (Thermo Fisher) followed by individual qRT-PCR quantification using TaqMan™ MicroRNA Assays (Thermo Fisher); all qRT-PCR reactions were performed in triplicate. For plasma miRs, fold changes were calculated by ∆∆CT method of relative quantification with both exogenous (to C. elegans miR-39 miRNA spike-in) and endogenous (hsa-miR-15b and hsa-miR-17) normalization. The two endogenous controls show Ct values that do not differ between experimental and control samples (p > 0.05), are expressed at levels comparable to those of our 5 target genes and display coefficients of variation below 15%. Of note, miR-15b has been highlighted as an endogenous control with very low overall variance, while miR-17 has been reported as one of the most stable and consistent miR expressed across 13 normal tissues.26, 27
For mouse hippocampi experiments, reverse transcription was performed using the TaqMan® MicroRNA Reverse Transcription Kit (Thermo Fisher) followed by individual qRT-PCR quantification using TaqMan™ MicroRNA Assays (Thermo Fisher). All qRT-PCR reactions were performed in triplicate. The fold changes were calculated by ∆∆CT method of relative quantification using RNU-44 for normalization.
For LUHMEs cells/dopaminergic neurons microRNA experiments, reverse transcription was performed using the TaqMan® MicroRNA Reverse Transcription Kit (Thermo Fisher) followed by individual qRT-PCR quantification using TaqMan™ MicroRNA Assays (Thermo Fisher). For target genes experiments, reverse transcription was performed using the High-Capacity cDNA Reverse Transcription Kit followed by individual qRT-PCR quantification using inventoried TaqMan™ Assays (Thermo Fisher). All qRT-PCR reactions were performed in triplicate. The fold changes were calculated by ∆∆CT method of relative quantification using hsa-RNU-44 (for miR calculations) and hsa-Gapdh (for mRNAs calculations) for normalization.
2.4 Statistics
In the discovery lot, differentially expressed miRs were identified by two tails, heteroscedastic Student's t-test and ranked according to their corrected p-values (p = 0.05 as cut-off).
In the validation lot, after checking the normalized Ct values for normality of distribution, we evaluated the differential miR expression's statistical significance between patient and control groups using either a 2-tailed t-test with Welch correction (for normal distribution) or a 2-tailed Mann–Whitney U test for non-normal distribution (statistical cut-off: 0.05).
The differential miR expression's statistical significance between naïve and post-therapy patients’ groups was assessed using the 2-tailed Wilcoxon signed-ranks test (p < 0.05) for the Harvard lot.
The statistical significance of the differentially expressed miR in the cultured dopaminergic neural cells exposed to LevoDopa was calculated using a two-way anova test with Dunnett correction. The statistical significance of the differentially expressed target genes in the cultured dopaminergic neural cells exposed to LevoDopa was calculated using a two-way, unpaired, heteroscedastic t-test with Welch's correction (p < 0.05).
The statistical significance of the differentially expressed miR in the mouse hippocampi challenged with LevoDopa was calculated using a two-way, heteroscedastic, unpaired t-test (p < 0.05).
All statistical calculations were performed using Prism 8 for MacOS, version 8.3.0.
The diagnostic test parameters for the three miRs were estimated using the MedCalc online software (https://www.medcalc.org/calc/diagnostic_test.php).
2.5 Bioinformatics analysis
Target predictions (against 3′UTR, 5′UTR and CDS regions) for miR-19b were computed using the miRWalk 3.0 machine learning algorithm, with a p ≤ 0.05 (Bonferroni adjusted) as a cut-off. The miR-19b targets were cross-referenced against the differentially expressed genes retrieved after Geo2R analysis (Benjamini and Hochberg adjusted false discovery rate, FDR <0.05) of GSE55096 data set representing the TRAP analysis of striatal neurons’ response to LevoDopa therapy in a 6-hydroxydopamine (6-OHDA) mouse Parkinson's disease model.28 The miR-19b targets of the differentially expressed genes were subjected to Gene Ontology analysis on the DAVID platform using adjusted FDR of 0.05 as cut-off.29
3 RESULTS
3.1 MicroRNA profiling
Out of the 1008 miRs profiled in the discovery group, only 15 were expressed in all plasma samples and exhibited corrected p-values below the 0.05 threshold, with fold changes (FC) varying between 1.5 and 5.1 (Table 2).
| miR | Mapping | FC | p Value |
|---|---|---|---|
| hsa-miR-19b |
chr13: 91351192-91351278 [+] chrX: 134169671-134169766 [−] |
5.10 | 0.0412 |
| hsa-miR-19a | chr13: 91350891-91350972 [+] | 4.45 | 0.039 |
| hsa-miR-16 | chr13: 50048973-50049061 [−] | 3.83 | 0.012 |
| hsa-miR-92a | chr13: 91351314-91351391 [+] | 3.73 | 0.021 |
| hsa-miR-195 | chr17: 7017615-7017701 [−] | 3.67 | 0.019 |
| hsa-miR-93* | chr7: 100093768-100093847 [−] | 3.64 | 0.037 |
| hsa-miR-363 | chrX: 134169378-134169452 [−] | 3.27 | 0.019 |
| hsa-let-7b | chr22: 46113686-46113768 [+] | 3.10 | 0.049 |
| hsa-let-7e | chr19: 51692786-51692864 [+] | 3.00 | 0.033 |
| hsa-miR-454 | chr17: 59137758-59137872 [−] | 2.99 | 0.023 |
| hsa-let-7c | chr21: 16539828-16539911 [+] | 2.74 | 0.038 |
| hsa-miR-16-2* | chr3: 160404745-160404825 [+] | 2.53 | 0.016 |
| hsa-miR-576-5p | chr4: 109488698-109488795 [+] | 2.30 | 0.010 |
| hsa-miR-941 |
chr20: 63919449-63919520 [+] chr20: 63919505-63919576 [+] chr20: 63919561-63919632 [+] chr20: 63919756-63919827 [+] chr20: 63919868-63919939 [+] |
1.70 | 0.018 |
| hsa-miR-1976 | chr1: 26554542-26554593 [+] | 1.51 | 0.0435 |
- * Belongs to the name of the microRNA.
3.2 MicroRNA validation
The differential expression of five of the discovery miRs (miR-16, miR-19b, miR-19a, miR-92a and miR-195) was further validated in an additional set of 66 treated PD patients and 29 controls using TaqMan assays. Similar to the discovery lot, all five discovery miRs were up-regulated in PD patients, with fold changes between 1.31 and 1.72 (Table 3). However, after gender stratification, only miR-19a, miR-19b and miR-195 were found differentially expressed in both male and female patients (miR-16 and miR-92a are significantly expressed only in males), thus being further taken into consideration as putative bona fide PD biomarkers. There were significant differences in miR-16 and miR-92a plasma levels of control males versus control females, while miR-19a, miR-19b and miR-92a are significantly lower in the plasma of PD male patients compared to PD female patients (Table S1).
| Fold change (p-Value) | M + F | M | F |
|---|---|---|---|
| hsa-miR-16 | 1.31 (0.026a) | 1.72 (0.003a) | 1.31 (0.944b) |
| hsa-miR-19b | 1.50 (0.001b) | 1,52 (0.001b) | 1.50 (0.041b) |
| hsa-miR-19a | 1.52 (0.001b) | 1.64 (0.002a) | 1.52 (0.042b) |
| hsa-miR-92a | 1.55 (0.009b) | 1.88 (0.009b) | 1.55 (0.114b) |
| hsa-miR-195 | 1.72 (0.0008a) | 1.91 (0.0075a) | 1.72 (0.043a) |
- Abbreviations: F, females; M, males.
- a Two-tailed Mann–Whitney test.
- b Two-tailed Welch's t-test.
Next, we asked whether the normalized Ct of the five miRs correlate with the age of the probands and the Hoehn–Yahr (H-Y) stage of Parkinson's disease. Two-tailed parametric Pearson correlation analysis of PD data indicates that age and H&Y stage do not correlate with, and most probably do not influence the normalized Ct values of any of the validated miRs (Table S2).
3.3 Mir-19a, miR-19b and miR-195 as diagnostic biomarkers
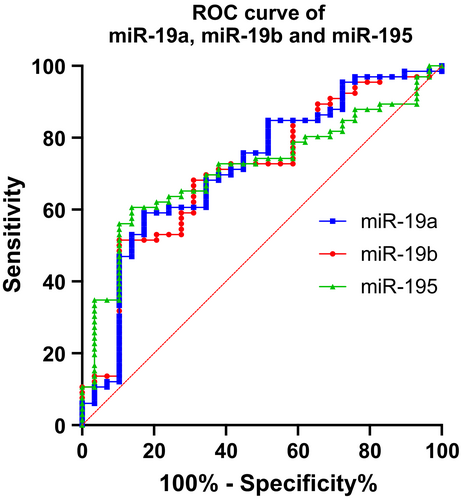
To evaluate the validated miRs’ ability to discriminate between PD and controls, we performed ROC analyses for all five miRs (Table S3 and Figure 1). This analysis revealed that the five miRs exhibit relatively modest performances, with miR-19a, miR-19b and miR-195 having the highest areas under the curve and the lowest p values.
3.4 MicroRNA responders to LevoDopa
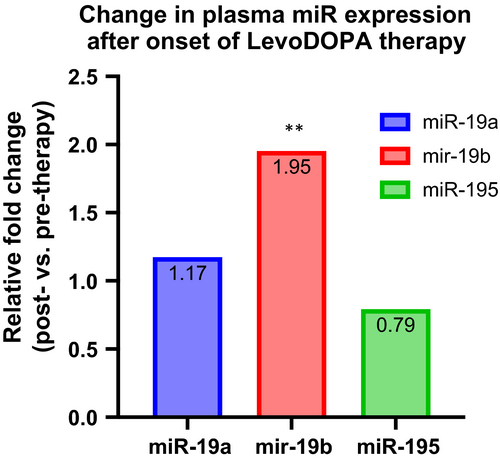
Since all the PD patients enrolled in the validation lot were under replacement/combined therapy, which, as reported, might associate changes in circulating miR levels, we have further compared the miR-195, miR-19a and miR-19b plasma levels in 10 patients (Harvard Neurodiscovery Center) before and after the onset of anti-Parkinson medication.12, 30 A Wilcoxon matched-pairs signed-ranks test analysis showed a significant change in treated patients for miR-19b (p = 0.0059) but not for miR-19a and (p = 0.9218) and miR-195 (p = 0.1934). Our data indicate a possible role of miR-19a and mir-195 in PD biology, while miR-19b could be considered as a therapy-responder (Figure 2).
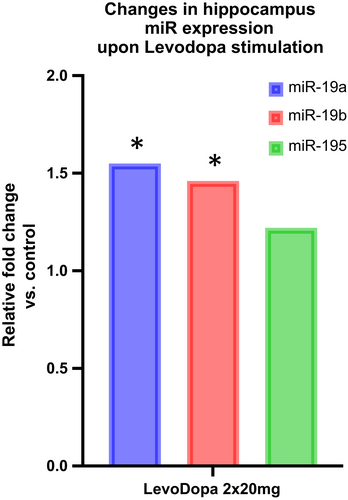
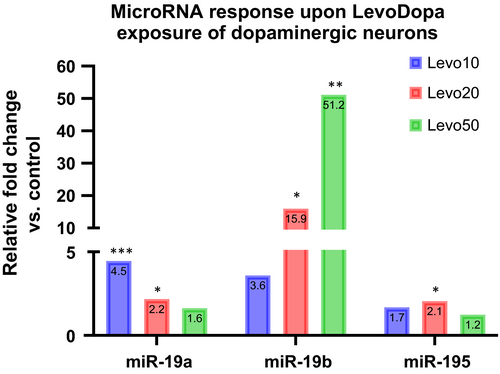
To further substantiate the possible role of LevoDopa in modulating miR-195/miR-19a/miR-19b expression in tissues relevant for PD pathology, we evaluated their expression in the hippocampi of one-year-old, wild type, mixed background mice subjected to five-day LevoDopa stimulation. The expression of all three miRs increased, however, only miR-19a and miR-19b changes were statistically significant (Figure 3). Next, we asked whether the change in miR expression could be specifically reproduced in dopaminergic neurons and monitored the response of cultured LUHMES-derived dopaminergic neurons to three different levels of LevoDopa. Interestingly, miR-19a and miR-195 responded by gradually decreasing their expression upon augmentation of LevoDopa concentration, while miR-19b showed a dose-dependent upregulation of expression (Table S4 and Figure 4).
3.5 MicroRNA targets
miR-19b has been proposed as a diagnostic and/or prognostic marker in a wide array of pathologies, from adenoviral and bacterial infections to heart failure, cancer and PD. Mature miR-19b is exceptionally well conserved in vertebrates (Figure S1), and experiments in mice and rats provided important mechanistic pathogenic details of its involvement in these pathologies.
To gain insight into the possible biological role of miR-19b upregulation upon LevoDopa exposure, we retrieved and analysed the published transcriptome data of two LevoDopa regimen supplementation experiments in a mouse model of 6-hydroxydopamine (6-HODA)-induced striatal dopamine depletion.28 Geo2R analysis (false discovery rate <0.05, Benjamini and Hochberg adjusted) of hemiparkinsonian conditions on LevoDopa therapy versus chronic saline identified 5722 (high LevoDopa regimen) and 2999 (low Levodopa regimen) unique differentially expressed genes (DEG), of which 651 (11.38%) and 378 (12.61%), respectively, are putative 5′-UTR/CDS/3′-UTR miR-19b targets, as predicted using miRwalk3.0 machine learning algorithms.31 KEGG Pathway enrichment analysis (FDR < 0.05) of the miR-19b DEG targets using the DAVID 6.8 platform (https://david.ncifcrf.gov/) identified Ubiquitin-mediated proteolysis (UDP) pathway as possibly altered by miR-19b deregulation during LevoDopa supplementation (Table 4 and Figure S2).29 Of note, out of the 16 UDP target genes (FBXW8, CUL3, CUL2, UBE2D3, HUWE1, WWP1, KEAP1, NEDD4L, CBL, UBE2J2, UBE2R2, NEDD4, UBR5, BIRC6, TRIM37, ANAPC1), UBE2D3 and TRIM37 have already been validated as miR-19b targets (MIRT505252 and MIRT500676, respectively) (File S1). CUL3, UBE2D3 and WWP1 have been indexed as miR-19b targets in miRDB (target scores 74, 87 and 80, respectively), while UBE2D3 (TargetScan probability of conserved targeting: 0.29) and WWP1 (TargetScan probability of conserved targeting: 0.58) have conserved miR-19b binding sites.
| Term | Count | % | p | Fold Enrichment | Bonferroni | Benjamini | FDR |
|---|---|---|---|---|---|---|---|
| hsa04120: Ubiquitin-mediated proteolysis | 16 | 2.46 | 1.53E-04 | 3.138 | 3.46E-02 | 3.52E-02 | 3.49E-02 |
| mmu04120: Ubiquitin-mediated proteolysis | 16 | 2.46 | 7.04E-05 | 3.372 | 1.58E-02 | 1.59E-02 | 1.58E-02 |
Next, we analysed 22 Parkinson-related transcriptome data deposited in the Gene Expression Omnibus (GEO) for changes (Geo2R analysis, adjusted FDR < 0.05) in the expression levels of the 16 UDP miR-19b-target genes: GSE110716 (fibroblasts, iPSCs, and neurons), GSE68719 (brain tissue), GSE43490 (dorsal nucleus vagus, substantia nigra, locus coeruleus), GSE28894 (frontal cortex, cerebellum, striatum, medulla oblongata), GSE19587 (dorsal motor nucleus of vagus, inferior olivary nucleus), GSE20333 (brain), GSE20295 (prefrontal area, putamen, substantia nigra), GSE20146 (globus pallidus), GSE20141 (substantia nigra pars compacta), GSE6613 (whole blood), GSE72267 (blood), GSE20153 (lymphoblasts) and GSE22491 (peripheral blood mononuclear cells, PBMCs). To our surprise, except for GSE22491 (PBMCs from patients with LRRK2 mutations), none of the GEO data sets survived the Geo2R analysis, adding yet another layer to the well-known lack of consensus between Parkinson transcriptomes. However, with two exceptions (GSE43490 substantia nigra and locus coeruleus), all data sets (File S2) are consistent in showing decreased expression of ANAPC1 (72.7% of the datasets), UBE2D3 (68.2%), CUL2, CUL3 and KEAP1 (63.6%), while FBXW8 and UBE2J2 are downregulated in only 22.7% of the data sets analysed.
Next, we asked whether the predicted transcriptional impact on UDP pathway genes could be reproduced in our LUHMES-derived dopaminergic neurons model and quantified the expression of five of the UDP target genes found most consistently downregulated in our GEO data analysis. We found that of Cul2, Cul3 and UBE2D3 are all downregulated, while WWP1 and ANAPC1 expression levels are not changed or even increased in LUHMES-derived dopaminergic neurons (Figure 5).
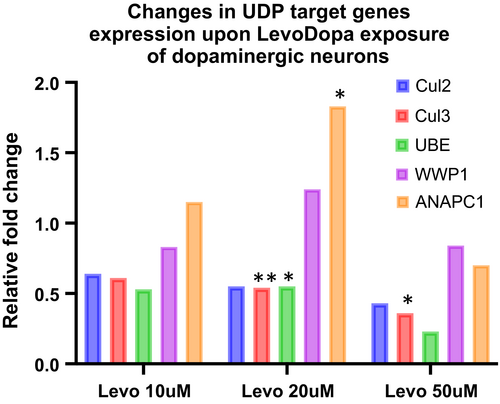
Overall, these data indicate a consistent and concordant downregulation of target UDP-genes transcripts in tissues harvested from PD patients under replacement therapy, mice hippocampi and cultured dopaminergic neural cells challenged with LevoDopa, which might translate into an altered proteasome activity mediated by the LevoDopa-induced augmentation of miR-19b.
4 DISCUSSION
There is a bewildering lack of consensus between the circulating miRs expression reports, regardless of their origin: plasma, serum or PBMCs of Parkinson's patients32; this might reflect not only differences in tissue source, cohort sizes, experimental design (from RNA isolation to validation) but also, in the light of our data, differential individual responses to different LevoDopa therapy dosages.33 However, one should also remember there are considerable quantitative and qualitative differences between the miRs’ expression levels in plasma, serum, and white blood cells (WBCs), with high serum levels of miRs rather reflecting the release of miRs associated with the coagulation.20, 34 From this perspective, one might argue that plasma miRs better reflect the real repertoire of PD-associated circulating miRs.
Most of the studies that investigated the levels of miRs in serum (including exosomes), PBMCs, and cerebrospinal fluid showed a decreased levels of miR-19b in PD patients compared to control subjects8, 13, 35-37; Marques et al. (2017) could not find any significant change, while Burgos et al. (2014) described statistically significant upregulations of miR-19b in PD patients.14, 38 Furthermore, analysis of plasma miRs showed increased levels of miR-19b in Parkinson's patients versus healthy controls.39 Interestingly, global analysis of plasma exosomes did not identify differences in miR-19b expression, thus excluding exosomes as possible contributors to miR-19b PD-associated changes.40 It is also worth noting that with very few exceptions, the brain-enriched miRs investigated so far show increased plasma levels in PD patients, suggesting that the actual miR source might influence the plasma levels in pathological conditions.15, 24
Very few studies investigated the miR response to LevoDopa therapy in Parkinson's disease, all using a targeted approach and focusing on miR expression in peripheral blood cells. However, the results show the same disconcerting lack of consensus: Alieva et al. described a significant increase of miR-7, miR-9-3p, miR-9-5p, miR-129 and miR-132, Serafin et al. showed overexpression of miR-103a, miR-30b, and miR-29a, while Caggiu et al. found an upregulation of miR-155 and downregulation of miR-146 in the PBMC of LevoDopa-treated Parkinson's patients.12, 30, 41 Of note, except for miR-146, all miRs analysed are up-regulated, including the brain-enriched miR-7 and miR-132.
Our data are too preliminary to support a role for miR-19b in predicting PD onset in individuals, regardless of their sex and age, an aspect worth exploring in much larger cohorts of probands, which allow proper stratification. Furthermore, we found no correlation between any of the five plasma miRs and the age or H&Y stage of PD patients. Male gender has been highlighted as one of the risk factors for PD development. This aspect seems to be mediated by SRY expression in dopaminergic striatal neurons and strongly reflected at both clinical and molecular/transcriptome levels.42-44 Interestingly, plasma miR-16 gender-dependent differential expression is lost in PD patients, miR-92a retains its gender-biased expression, while miR-19a and miR-19b are gender-biased only in PD. Of note, miR-19a and miR-19b are considered ‘male-specific’ miRs, while miR-195 is rather female-specific.45
An aspect worth investigating would be the mechanism leading to mature miR upregulation upon LevoDopa exposure. While the human plasma and mouse hippocampi show concordant changes in mature miR-19b and miR-19a levels, consistent with a common, transcriptional regulation of the miR-17~92 cluster, the cultured dopaminergic neurons’ response diverges as the intensity of LevoDopa exposure increases, suggesting that different regulatory events might also be at work. Given that miR-19b is less accessible to Drosha processing from pri-miR-17~92 than miR-19a, it is tempting to speculate that LevoDopa post-transcriptionally alters the miR expression ratios within this cluster.46 Whether this LevoDopa-induced change in miR-19a/miR-19b ratio scenario also applies to the miR-106a-303 cluster (the chromosome X source of miR-19b) and which is its significance for dopaminergic neurons’ biology remains to be established.
Analysis of PD transcriptome data shows a striking lack of consensus at the level of differentially expressed genes across all tissue sources; however, despite intra- and inter-experimental cell population's heterogeneity, the concordance improves when transcriptome comparisons focus on signalling pathways. Proteasome activity has been reported being altered in transcriptome studies of nigral and extra-nigral brain regions, blood, or CSF, suggesting a systemic alteration of this pathway in PD.47 The proteasome is essential for neuronal survival, and a reduction of the proteasome activity has been correlated with brain ageing and neurodegenerative diseases.48 Furthermore, a large body of evidence shows that Dopamine can induce neural cell death, an effect observed in a dose- and time-dependent manner and associated with alteration of proteasome activity.49-53 Although restricted to transcript level analysis, our data suggest that this alteration might actually reflect the response to LevoDopa therapy through modulation of miR-19b levels.
The relationship between miRs and UDP has been explored in multiple in vivo and ex vivo experimental and clinical setups, including the heart, osteosarcoma cells and neurodegenerative disease.54, 55 Various components of the UDP system were described as miR targets: for example E2 isoforms UE2A, UBE2B, UBE2D3 and UBCH10 are targeted by miR-7, miR-455-5p, miR-21-5p and miR-631, respectively.56-59 The E3-ubiquitin ligase Parkin associated with familial PD is regulated by miR-181a in ageing muscles, miR-103a-3p levels are increased in an in vitro and in vivo MPTP model of Parkinson's disease, miR-146a levels are up-regulated in a rotenone neurodegeneration model, and miR-218 expression is increased in HEK293 cells.60-64 It would be interesting to investigate whether the proposed miR-19b impact on UDP transcripts translates into an altered neuronal proteasome activity through coordinated alterations of the activity of E2 Ubiquitin-conjugating enzyme, E3 Ubiquitin ligase system, and Cullin-2, Cullin-3 and Cullin-7 complexes. This would pave the way towards a possible anti-miR-19b neuroprotective therapy, since buffering the augmentation of miR-19b might be an efficient way to prevent or at least diminish the LevoDopa-associated neurotoxicity.
Although we show that the level of mature miR-19b increases in the mouse hippocampi and the dopaminergic neurons challenged with LevoDopa, the exact source of the plasma miR-19b in LevoDopa-treated patients is yet to be determined. Nevertheless, whether validated in larger, more heterogeneous lots, mir-19b might serve as an important response biomarker in LevoDopa therapy, opening a new avenue in PD clinical research.
ACKNOWLEDGEMENTS
This work was supported grants from the Executive Unit for Financing Higher Education, Research, Development and Innovation of Romania (UEFISCDI): PNII-ID-PCE-2012-4-0575 to IOS and CB; PN-III-P2-2.1-PED-2016-0735 to IOS, CB and MS; PNII-ID-PCE-2012-4-0279 to CM.
We thank Dr. Loredana Balacescu, Dr. Ovidiu Balacescu and Dr. Mara Pitulescu for their careful and critical reading of our manuscript.
The Harvard Biomarkers Study (‘HBS’); https://www.bwhparkinsoncenter.org) is a collaborative initiative of Brigham and Women’s Hospital and Massachusetts General Hospital, co-directed by Dr. Clemens Scherzer and Dr. Bradley T. Hyman. The HBS Investigators have not participated in reviewing the current manuscript. The HBS Study Investigators are: ‘Harvard Biomarkers Study. Co-Directors: Brigham and Women’s Hospital: Clemens R. Scherzer, Massachusetts General Hospital: Bradley T. Hyman; Investigators and Study Coordinators: Brigham and Women’s Hospital: Yuliya Kuras, Karbi Choudhury, Michael T. Hayes, Aleksandar Videnovic, Nutan Sharma, Vikram Khurana, Claudio Melo De Gusmao, Reisa Sperling; Massachusetts General Hospital: John H. Growdon, Michael A. Schwarzschild, Albert Y. Hung, Alice W. Flaherty, Deborah Blacker, Anne-Marie Wills, Steven E. Arnold, Ann L. Hunt, Nicte I. Mejia, Anand Viswanathan, Stephen N. Gomperts, Mark W. Albers, Maria Allora-Palli, David Hsu, Alexandra Kimball, Scott McGinnis, John Becker, Randy Buckner, Thomas Byrne, Maura Copeland, Bradford Dickerson, Matthew Frosch, Theresa Gomez-Isla, Steven Greenberg, Julius Hedden, Elizabeth Hedley-Whyte, Keith Johnson, Raymond Kelleher, Aaron Koenig, Maria Marquis-Sayagues, Gad Marshall, Sergi Martinez-Ramirez, Donald McLaren, Olivia Okereke, Elena Ratti, Christopher William, Koene Van Dij, Shuko Takeda, Anat Stemmer-Rachaminov, Jessica Kloppenburg, Catherine Munro, Rachel Schmid, Sarah Wigman, Sara Wlodarcsyk; Data Coordination: Brigham and Women’s Hospital: Thomas Yi; Biobank Management Staff: Brigham and Women’s Hospital: Idil Tuncali.’
CONFLICT OF INTEREST
The authors declare no conflicts of interest.
AUTHOR CONTRIBUTIONS
Aimee Rodica Chis: Data curation (equal); Formal analysis (equal); Investigation (equal); Validation (equal); Writing-original draft (equal); Writing-review & editing (equal). Alexandra Ioana Moatar: Data curation (equal); Investigation (equal); Validation (equal). Cristina Dijmarescu: Data curation (equal); Project administration (equal); Resources (equal). Cecilia Rosca: Data curation (equal); Resources (equal). Ruxandra Julia Vorovenci: Data curation (equal); Resources (equal). Inge Krabbendam: Investigation (equal); Validation (equal). Amalia Dolga: Resources (equal); Supervision (equal); Writing-review & editing (equal). Cristina Bejinar: Data curation (equal); Investigation (equal); Project administration (equal). Catalin Marian: Formal analysis (equal); Funding acquisition (supporting); Methodology (equal); Writing-review & editing (equal). Ioan Ovidiu Sirbu: Conceptualization (lead); Formal analysis (lead); Funding acquisition (lead); Methodology (equal); Supervision (equal); Writing-original draft (lead); Writing-review & editing (lead). Mihaela Simu: Data curation (equal); Resources (equal); Supervision (equal); Writing-review & editing (equal).
Open Research
DATA AVAILABILITY STATEMENT
Data sharing not applicable – no new data generated.


