Synchronization of repolarization after cardiac resynchronization therapy: A combined clinical and modeling study
Nienke J. Verzaal and Caroline J. M. van Deursen contributed equally to this study.
Disclosure: Kevin Vernooy has received research grants from Medtronic and Abbott, consultancy agreement with Medtronic, Philips, and Abbott; Angelo Auricchio is a consultant to Boston Scientific, Cairdac, Corvia, MicroportCRM, EPD Philips, Radcliffe Publishers, received speaker fees from Boston Scientific, Medtronic, and Microport, participates in clinical trials sponsored by Boston Scientific, Medtronic, EPD-Philips, and has intellectual properties with Boston Scientific, Biosense Webster, and Microport CRM; Frits W. Prinzen has received research grants from Medtronic, Abbott, Microport CRM, EBR systems, and Biotronik. Other authors: No disclosures.
Abstract
Introduction
The changes in ventricular repolarization after cardiac resynchronization therapy (CRT) are poorly understood. This knowledge gap is addressed using a multimodality approach including electrocardiographic and echocardiographic measurements in patients and using patient-specific computational modeling.
Methods
In 33 patients electrocardiographic and echocardiographic measurements were performed before and at various intervals after CRT, both during CRT-ON and temporary CRT-OFF. T-wave area was calculated from vectorcardiograms, and reconstructed from the 12-lead electrocardiography (ECG). Computer simulations were performed using a patient-specific eikonal model of cardiac activation with spatially varying action potential duration (APD) and repolarization rate, fit to a patient's ECG.
Results
During CRT-ON T-wave area diminished within a day and remained stable thereafter, whereas QT-interval did not change significantly. During CRT-OFF T-wave area doubled within 5 days of CRT, while QT-interval and peak-to-end T-wave interval hardly changed. Left ventricular (LV) ejection fraction only increased significantly increased after 1 month of CRT. Computer simulations indicated that the increase in T-wave area during CRT-OFF can be explained by changes in APD following chronic CRT that are opposite to the change in CRT-induced activation time. These APD changes were associated with a reduction in LV dispersion in repolarization during chronic CRT.
Conclusion
T-wave area during CRT-OFF is a sensitive marker for adaptations in ventricular repolarization during chronic CRT that may include a reduction in LV dispersion of repolarization.
1 INTRODUCTION
Cardiac resynchronization therapy (CRT) is a nonpharmacological therapy recommended by clinical practice guidelines in heart failure patients with reduced left ventricular (LV) ejection fraction and QRS duration >130 ms.1 CRT significantly reduces mortality and heart failure hospitalizations. This beneficial effect is clearly linked to resynchronization of electrical activation, recoordination of contraction, and accompanying improvement in pump function and cardiac reserve.
Electrocardiographic changes of depolarization after CRT have been studied in considerable detail; in contrast, less is known about changes in repolarization caused by CRT. A few studies in both animal tissues and humans reported increased dispersion of repolarization during CRT, possibly suggesting an increased risk for ventricular arrhythmias.2, 3 On the other hand, large clinical trials and multiple registries showed a significantly lower risk of ventricular tachycardia or ventricular fibrillation in CRT patients, in particular in those patients who show significant reverse remodeling.4-6 These clinical observations suggest that adaptations in ventricular repolarization may occur after CRT. However, little is known about longitudinal changes of ventricular repolarization and their relation to reverse remodeling induced by CRT.
To address this gap in evidence, a multimodality approach including electrocardiography (ECG), vectorcardiography (VCG), and echocardiography, supplemented by patient-specific modeling was considered. In the present study, we investigated in a cohort of consecutive CRT patients: (1) the time course and extent of changes in T-wave markers recorded using sequential 12-lead ECGs in patients after the start of CRT; (2) the potential mechanisms behind these T-wave changes using a personalized computer model of activation and repolarization.
2 MATERIALS AND METHODS
2.1 Patients
Patients who were referred to Maastricht University Medical Centre between March 2010 and May 2012, who were 18 years of age or older; had an indication for CRT; did not have any known condition that could limit life expectancy to less than 6 months as of referral; and were capable of giving informed consent were asked to participate. In this publication only data are included of a subgroup of 33 patients who agreed to frequently return to the hospital to record ECGs and echocardiograms at several time points after CRT implant. The study conforms to the Declaration of Helsinki. The protocol was approved by the ethics committee of Maastricht University Medical Centre (project number 10-2-090). All patients gave written informed consent before inclusion.
2.2 Study protocol
The 12-lead ECG was obtained before and 1 day, 5 days, 2 weeks, and 1, 3, and 6 months after implantation. Echocardiography was performed 3 months to 1 day before and 1 and 14 days as well as 6 months after implantation. Postimplant ECG and echocardiographic measurements were obtained with both CRT-ON and while the CRT device was briefly switched off (CRT-OFF).
2.3 VCG analysis
QT interval was measured automatically using the tangent method8 and subsequently corrected for heart rate (QT-corrected [QTc]) using Fridericia's formula.9 Median T peak-to-end interval (Tp-e) as well as precordial QT dispersion (standard deviation of start Q to precordial T ends) of all leads were determined.
2.4 Echocardiography
Echocardiograms were obtained using an iE33 system (Philips Medical Systems). Left ventricular end-systolic volume (LVESV) and ejection fraction (LVEF) were calculated using the biplane (modified Simpson's rule) or monoplane method in the apical four-chamber window if the apical two-chamber view was of insufficient quality. Mean values from three consecutative beats are reported. CRT response was defined as a reduction of LVESV ≥ 15% or an absolute increase of LVEF ≥ 5%, after 6-months CRT.
Using speckle tracking analysis (QLAB version 8.1; Philips Medical Systems) septal strain was determined on apical four chamber views, focussed on the interventricular septum. These focussed views of the interventricular wall are most optimal for showing paradoxical motion before CRT.10 Systolic rebound stretch of the septum (SRSsept), a strong indicator of CRT response, was defined as the total amount of stretch during systole that occurred after initial shortening.11
2.5 In silico modeling
In this study, we considered a single anatomical model from a patient with no history of scar, who was participating in an earlier study performed at the Center for Computational Modeling in Cardiology (Università della Svizzera italiana, Lugano, Switzerland).14 cardiac magnetic resonance (CMR) data were used to construct the heart-torso model, comprising ventricles with valve plane and outflow tracts, atrial blood cavities, aorta and major vessels, lungs, torso, and electrodes position. Patient ECG was used to fit the baseline computer model, by iteratively adjusting the parameters (EASs, CV, APD, and ) until differences between measured and simulated ECG were minimal in the least-squares sense.14 CV, APD, and repolarization rate were adjusted in six myocardial compartments: LV and RV endocardium, mid-myocardium, and epicardium. Mid-myocardium and epicardium respectively covered 30% and 20% of the transmural thickness.
Acute CRT was simulated by biventricular pacing, with manually placed leads on LV epicardium and RV apex and no interventricular delay. Changes in RT during chronic CRT was modeled by locally decreasing the APD proportionally to the difference between depolarization time after and prior CRT: . The factor was varied between 0.5 and 0.8 to find the best match with the measured T-wave parameters. The ECGs of four scenarios (baseline, acute CRT-ON, chronic CRT-ON, and chronic CRT-OFF) were analyzed with the same workflow adopted for the clinical cohort (see above). Simulated baseline T-wave area value was multiplied by a normalization factor to match the average baseline T-wave area value in the patient cohort. All other simulated T-wave and QRS area values were multiplied by the same factor. APD90 was defined as the time at which the action potential reached 90% of its resting potential during the repolarization phase.
2.6 Statistical analysis
All analyses were carried out in GraphPad Prism 8 (GraphPad Software). Analysis was performed either by fitting a mixed model, a one-way repeated measures analysis of variance (ANOVA) or two-way mixed effects ANOVA, as appropriate, followed by a Bonferroni's multiple comparisons test. We applied the Geisser-Greenhouse correction during ANOVA to account for possible violations of the assumption of sphericity. Parameters with only baseline and one follow-up value (e.g., LVEF) were assessed using a paired t-test. For comparison of continuous variables between subgroups, an unpaired t-test was employed. Categorical variables were compared using Fisher's exact test, except for LV lead locations, due to low patient numbers in multiple categories. For NYHA class comparison between the two subgroups, classes I & II and III & IV were combined to increase the number of patients per category. Two-sided p-values ≤.05 were considered statistically significant. Data are shown as mean ± SD or median (interquartile range).
3 RESULTS
Baseline characteristics of the cohort are presented in Table 1 and show a typical population of CRT patients.
| Age (years) | 67 ± 8 |
| Female (n, %) | 10 (30) |
| BMI (kg/m2) | 27 ± 5 |
| NYHA class | |
| I (n, %) | 6 (18) |
| II (n, %) | 12 (36) |
| III (n, %) | 12 (36) |
| IV (n, %) | 3 (9) |
| Ischemic cardiomyopathy (n, %) | 19 (58) |
| AF (n, %) | 8 (24) |
| LBBB (n, %) | 28 (85) |
| Previous RV pacing (n, %) | 4 (12) |
| ACE-inhibitor/ARB (n, %) | 30 (91) |
| Beta blocker (n, %) | 31 (94) |
| Aldosterone antagonist (n, %) | 8 (24) |
| Loop diuretic (n, %) | 21 (64) |
| CRT responders (n,%) | 18 (60) |
| Biventricular pacing (%, median [IQR]) | 98.8 (97.4–99.4) |
| LV lead location (n,%) | |
| Basal inferolateral | 1 (3) |
| Basal anterolateral | 9 (27) |
| Mid inferior | 2 (6) |
| Mid inferolateral | 8 (24) |
| Mid anterolateral | 10 (30) |
| Apical lateral | 3 (9) |
- Note: Variables are shown as mean ± SD or as number of patients (percentage of patients).
- Abbreviations: ACE, angiotensin converting enzyme; AF, atrial fibrillation; ARB, angiotensin receptor blocker; CRT, cardiac resynchronization therapy; IQR, interquartile range; LBBB, left bundle branch block; LV, left ventricular; RV, right ventricular.
3.1 Electrical and echocardiographic parameters over time
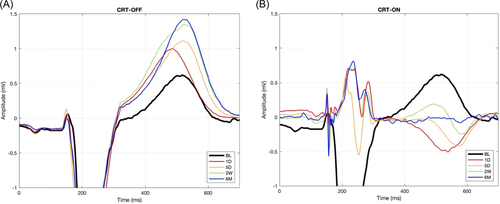
Figure 1 shows examples of ECG lead V2 of a patient during both CRT-OFF (A) and CRT-ON (B) at various time points. CRT-ON caused immediate amplitude reduction and narrowing of the QRS complex, as well as reduction in QRS area (Figure 2A, Table 2), indicating resynchronization of activation. Although Figure 1 shows considerable changes in the T-wave during CRT-ON and CRT-OFF, changes in two conventional indicators of repolarization (QTc and Tp-e) were insignificant during CRT-ON and only moderately increased during CRT-OFF (Figure 2C,D, Table 2). In contrast, T-wave area and amplitude decreased by approximately 40% during CRT-ON while almost doubling during CRT-OFF (both p < .05). Notable was that the values of T area reached the plateau after approximately 5 days (Figure 2B).

| BL | 1D | 5D | 2W | 6M | |
|---|---|---|---|---|---|
| Heart rate (bpm) | |||||
| OFF | 69 ± 9 | 67 ± 13 | 66 ± 10 | 65 ± 10 | 61 ± 7* |
| ON | 68 ± 10 | 67 ± 8 | 68 ± 9 | 65 ± 10 | |
| QRS duration (ms) | |||||
| OFF | 187 ± 17 | 189 ± 17 | 185 ± 14 | 185 ± 22 | 179 ± 17 |
| ON | 156 ± 18* | 151 ± 17* | 151 ± 20* | 157 ± 24* | |
| QRS amplitude (mV) | |||||
| OFF | 1.5 ± 0.4 | 1.8 ± 0.5* | 1.8 ± 0.5* | 1.7 ± 0.5* | 1.7 ± 0.5* |
| ON | 1.2 ± 0.4* | 1.2 ± 0.4* | 1.1 ± 0.3* | 1 ± 0.3* | |
| T amplitude (mV) | |||||
| OFF | 0.5 ± 0.2 | 0.6 ± 0.2 | 0.8 ± 0.2* | 0.8 ± 0.2* | 0.8 ± 0.2* |
| ON | 0.4 ± 0.2* | 0.3 ± 0.1* | 0.3 ± 0.1* | 0.3 ± 0.1* | |
| QRS/T area ratio | |||||
| OFF | 1.5 ± 0.3 | 1.3 ± 0.2* | 1 ± 0.1* | 0.9 ± 0.2* | 0.9 ± 0.1* |
| ON | 1.6 ± 0.8 | 1.7 ± 0.7 | 1.7 ± 0.9 | 1.5 ± 1.1 |
- Abbreviations: 1D, 1 day; 5D, 5 days; 2W, 2 weeks; 1M, 1 month; 3M, 3 months; 6M, 6 months; BL, baseline; CRT, cardiac resynchronization therapy.
- * p ≤ .05 versus BL.
Of the echocardiographic measures, SRSsept decreased immediately upon start of CRT (Figure 2E), but it took approximately 2 weeks before LVEF started to increase (Figure 2F). LVEF remained unchanged after temporarily halting CRT, in contrast to SRSsept (CRT-OFF, Figure 2E,F). Sixty percent of patients were echocardiographic CRT responders.
3.2 In silico results
Figure 3A displays the patient-specific heart-torso model, derived from CMR measurements. Figure 3B displays the AP morphologies at baseline, indicating that the optimal match between measured and simulated ECG coincided with shorter APs in the RV than in the LV and with a more triangular AP shape in the RV and LV epicardium and RV endocardium than in the other layers. Figure 3C,D shows the recorded baseline ECG as well as the simulated baseline and follow-up ECG (lead V2) during CRT-ON and CRT-OFF.
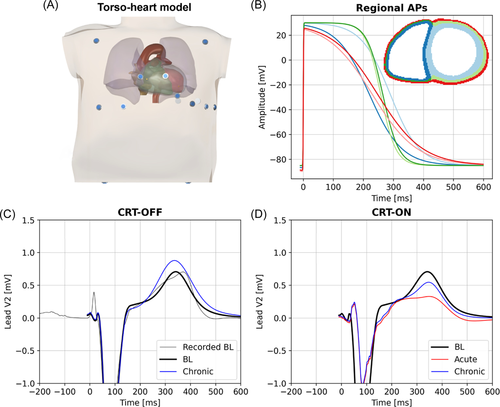
To obtain the best fit of simulated and measured baseline ECG of the patient, the patient-specific activation model included four EASs along the RV endocardium (two basal-septal and two RV free wall, Figure 4A, TOP panel), thus indicating a left bundle branch block (LBBB)-like depolarization sequence. Simulated and recorded baseline ECG of the patient correlated very well (Pearson's correlation r = .96). Simulated ECGs at the four time points also closely resembled the measured ones presented in Figure 1, both showing an increase in T-wave size over time during CRT-OFF (Figure 3C) and a partial return of the T-wave polarity toward baseline during chronic CRT-ON (Figure 3D).
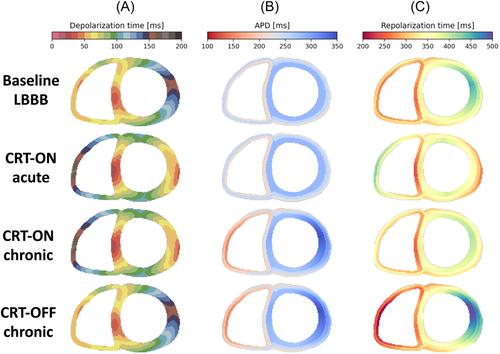
The depolarization and repolarization maps during acute CRT (Figure 4, second row, obtained using the baseline APD distribution), showed resynchronization of depolarization and, to some extent, also repolarization.
The best match between the measured and simulated relative increase in T-wave area was achieved by assuming that APD during chronic CRT changed according to an inverse relation between the CRT-induced change in AT and change in APD with a slope of 0.6 (see Section 2; Figure 3). The model also recapitulated the minor changes in QT time. The adaptation in APD resulted in an increase in APD in the LV lateral wall and a reduction in RV APD (Figure 4B,C, middle two panels), coinciding with an increase in overall dispersion of APD. During chronic CRT-OFF, so returning to the LBBB-like activation pattern, the adaptation-induced distribution of APD resulted in considerably delayed repolarization in the LV free wall (Figure 4, bottom row), which was associated with an increase in T-wave area derived from the patient-specific simulation (from 76 to 139 mV·ms).
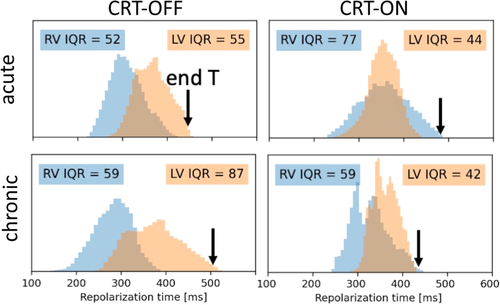
The finite difference model allowed to calculate both RV and LV dispersion of repolarisation in all 350 000 computational vertices, with a spatial resolution of 1 mm (Figure 5). At baseline, overall RV repolarization preceded that of the LV. Acute CRT led to reduction of interventricular differences in RT, but mean RV repolarization preceded that of the LV again after chronic CRT. Acute CRT reduced LV repolarization dispersion, but increased RV repolarization dispersion. After chronic CRT RV dispersion returned to almost baseline values while LV dispersion further decreased. Turning CRT off increased both inter- and intraventricular repolazation dispersion to values above baseline. The black arrows, representing the last ventricular repolarization, indicate that acute CRT slightly prolongs the time of last repolarization, that this time becomes shorter between acute and chronic CRT-ON, and prolongs considerably when returning from chronic CRT-ON to CRT-OFF, resembling the changes observed in QTc (Figure 2C).
4 DISCUSSION
The main findings of this study are that (1) T-wave area during transient halting of CRT (CRT-OFF) seems to be a more sensitive marker for adaptations in ventricular repolarization than conventional measures such as QTc and Tp-e; (2) T-wave area changes reach a plateau within a week of CRT, preceding the increase in LVEF; and that 3) patient-specific computer simulations indicate that these T-wave changes may be explained by an inverse relation between changes in AT and APD that coincide with a reduction in RV and LV dispersion of repolarization during chronic CRT.
4.1 T-wave changes following longer lasting CRT
The observed T-wave changes during CRT appear in line with previously described T-wave changes after development of LBBB or start of RV pacing. Under such conditions the T-wave increases immediately upon the change in activation sequence, while its size decreases during subsequent days to weeks,14, 15 a time span similar to that observed in our CRT study. However, during continuining CRT (with CRT-ON) the ~50% reduction in T-wave area over time occurred quickly, reaching a plateau phase within a day. In contrast, the T-wave area during CRT-OFF doubled, provided a stronger biological signal, while it took about a week to reach the plateau phase.
Such relatively slow T-wave changes during CRT-OFF are comparable to the phenomenon of cardiac memory, which is observed when returning to normal activation after a period of (single) ventricular pacing or ventricular conduction abnormality.16 When pacing is switched off, the T-wave shape remains abnormal despite the return to the baseline QRS complex. In the context of CRT, interruption of pacing lets the heart return to the abnormally activated baseline state (i.e., LBBB), allowing comparison of the T-wave during CRT-OFF and baseline with a (major) difference in the QRS complex.
4.2 Changes in APD
Studies have shown that the T-wave changes during cardiac memory occur due to regional changes in APD, that is, APD prolongation in early activated regions and APD shortening in regions of late activation during the dominant activation sequence.17, 18 The model simulations presented in this study indicate that this way of adaptation may also occur in CRT patients. Comparable differences in APD between early and late activated regions have also been observed in animal hearts during longer lasting periods of ventricular pacing,17, 19, 20 although one study showed APD lengthening in the very latest activated regions.19
Contrary to these findings Chen et al.21 found that CRT shortened the activation recovery interval (ARI, a surrogate measure of APD) measured within ~1 cm from the LV pacing site. Also, APD measurements in isolated cells from dogs with chronic LBBB showed longer APD in late activated regions.22 While these observations may have been affected by the experimental conditions used, also limitations in our approach should be noted. The present findings in the patient-specific computer model were obtained using T-wave area measurements, which provide an integral measurement of ventricular repolarization. A match between measured and modeled T area during chronic CRT-OFF could only be achieved by the use of an inverse relation between AT and APD for all ventricular elements. However, this first order approximation does not exclude regional differences in this relation, such as between base and apex as well as transmurally. Moreover, APD shape was kept the same between baseline and the chronic CRT conditions.
A recent study by Elliot et al. used ECG imaging to determine ventricular repolarization and ARIs in 11 patients following CRT. This study focused on ARI dispersion, which these investigators showed to be increased following CRT.23 This finding is concordant with our results from the modeling study (Figure 4B), which showed decreases in RV ARI and increases in LV ARI. However, these authors were not able to show a reduction in overall dispersion of repolarization, possibly due to the smaller study size and because ECG imaging is largely based on electrical behavior of the epicardium of the RV and LV free walla, whereas the computer model provides a true complete ventricular information, including that of the interventricular septum.
The present study does not allow speculation about the molecular mechanisms involved in the process of T-wave changes during CRT OFF. Extensive work of Dr. Rosen's group showed involvement of stretch-induced local release of angiotensin II, modulation of transcription factors and changes in IKr and ICa,L.24 Regional differences in stretch, coinciding with abnormal activation, appear to be crucial for inducing cardiac memory. Sosunov et al.18 showed that mechanical unloading of the LV or blocking excitation–contraction coupling attenuated the development of cardiac memory. Based on this information Kuijpers et al.25 proposed that T-wave memory is mediated by mechanoelectrical feedback, aiming at homogenization of myocardial work. Their computer simulations indicated that such mechano-electrical coupling leads to a prolonged APD near the LV pacing region and lower overall dispersion of repolarization, thus in line with the results from the present study. Data from the experimental tachy-LBBB-induced dyssynchronous heart failure model showed among others, changes in the L-type calcium channel22 which plays an important role in regulation of both APD and contraction.
4.3 Limitations of the study
The present work should be considered as a proof of principle study. It was performed in a relatively small group of patients from a single center, which precludes investigating the relation between the relatively rare occurrence of arrhythmia and T-wave changes in CRT patients. Other studies in a similar patient population showed an incidence of arrhythmia of 14%4 and 20%,26 which would have resulted in a maximum of six cases in our study. Future studies may focus on this relation, by including a brief halt of CRT at follow-up (CRT-OFF) to measure T-wave area next to device read outs.
The computer simulation was performed using data of a single patient. Future studies should include a larger number and variety of patients, including those with scar and a variation in LV pacing sites. Moreover, AP shape may be varied. Finally, physiologically based action potential models could be used to explain the electric remodeling at the level of ion channels conductivities.
5 CONCLUSIONS
T-wave area is a sensitive marker for adaptations in ventricular repolarization that occur within a week of CRT. The T-wave changes appear explained by an inverse relation between activation and RT changes that lead to a reduction in RV and LV dispersion of repolarization during chronic CRT.
ACKNOWLEDGMENT
This study was sponsored by grants from the Swedish Heart-Lung Foundation and the Swedish Society of Medicine. The computational part was supported by the CSCS-Swiss National Supercomputing Centre (Production Grant No. s1074).


