
The value of tunneling: Evidence from master limited partnership formations
Abstract
Shareholders of publicly traded subsidiaries are potentially susceptible to expropriation (tunneling) by parent companies (Atanasov et al., 2010). A recent study suggests that this is particularly true among US master limited partnerships (MLPs), where there is often a substantial divergence between the control rights and cash-flow rights of parent firms, through their general partner interests (Atanassov & Mandell, 2018). Although the negative impact of tunneling on controlled firms is documented in the literature, little is known about the valuation consequences of tunneling for shareholders of parent corporations. Changes to the MLP agency environment over the prior two decades—namely, the allowance of modifications to a fiduciary duty under Delaware law and the introduction of incentive distribution rights—have likely increased the incentive and opportunity for tunneling and provide a rich setting for addressing this question. I examine the effects of changing tunneling incentives on stock returns of parent corporations announcing the formation of MLPs and document significantly higher announcement period returns for MLP formations after these changes, amounting to roughly $188 million of additional value for shareholders of forming corporations, on average. Considered in concert with additional testing, this suggests that parent corporation shareholders benefit from the increased ability to tunnel MLP assets.
1 INTRODUCTION
“Tunneling” refers to the transfer of assets out of a company to its controlling shareholder(s) and/or manager(s) (Johnson et al., 2000). Tunneling can take many forms, with controlling shareholders potentially extracting rents from the firm through misappropriations of cash, tunneling of assets through self-dealing or related party transactions or conveying to themselves the equity of the firm at below-market prices (Atanasov et al., 2011). Large shareholders, and the potential for tunneling that accompanies them, are frequently associated with developing economies. However, recent studies suggest that blockholder ownership is at least as pervasive in the United States as it is in economies abroad (Holderness, 2009),1 and that controlled US firms are not immune to the deleterious effects of tunneling previously observed in emerging markets. Specifically, Atanasov et al. (2010) find that US firms that are minority-owned by corporate blockholders experience negative abnormal operating returns and are valued at a discount, compared to their peers. They attribute these findings to blockholder opportunism (tunneling) atthe expense of minority shareholders.
Although the costs of tunneling to controlled firms abroad—and more recently in the US—have received attention, little is known about the effects of tunneling on parent corporations and their shareholders. This is principally because the valuation effect of tunneling on controlling shareholders is often unobservable—prior research generally focuses on tunneling by individuals, families, private firms and government entities, for whom financial information is frequently unavailable. Whether tunneling has valuation consequences for shareholders of parent corporations in the United States is the focus of this study. Specifically, I consider whether market participants are aware of the tunneling opportunities of parent corporations; and if they are, how they value such opportunities. To do this, I examine the equity valuation consequences of master limited partnership (MLP) formation announcements by corporate parents over time.
MLPs are limited partnerships or limited liability companies (LLCs) whose units are traded publicly on US exchanges. MLPs have an external governance structure, where the general partner (GP)—which is frequently controlled by a corporate parent—wields control over the partnership,2 largely free from oversight by the limited partners.3 MLP formations are a rich setting for the study of the valuation effects of tunneling for two reasons. First, prior literature suggests that parents of MLPs may tunnel resources from MLP limited partners through the over-distribution of cash, which accrues disproportionately to the parent (Atanassov & Mandell, 2018). Second, structural changes to the MLP and its operating environment over the past two decades may have increased the incentive and opportunity for tunneling among MLP parent corporations, providing a quasi-natural experiment to study the valuation effects of tunneling. The most prominent of these changes are (1) the reduction of the GP's fiduciary duty to the limited partners—with Delaware law permitting modifications to this duty starting in the 1990s, and its full waiver beginning in 2004—and (2) the introduction of incentive distribution rights (IDRs), provisions that allocate to the GP an increasingly disproportionate share of cash distributions as the magnitude of those distributions increases. These provisions, as well as the governance structure of MLPs in general, are discussed in greater detail in the next section.4
Leveraging this setting, I partition MLP formations into two time periods, or “waves,” around the structural changes to the MLP operating and legal environment noted above (1980–1987 and 1988–2011, respectively) and compare the equity valuation effects of MLP formation announcements across the two waves, controlling for other factors known to affect the valuation of equity carve-outs and spin-offs. I find support for a positive relation between tunneling opportunities and the market response to MLP formation announcements. Specifically, in primary testing, I find that cumulative abnormal returns (CAR) over the 5-day window surrounding the announcement date are 3.24% higher for second-wave formations than for first-wave formations and that the difference is statistically significant. When controls for factors previously found to affect MLP announcement returns are included, I find that 5-day CAR is 4.40% higher for second-wave formations.5 The results indicate a statistically and economically significant increase in value to parent corporations from an MLP formation. In particular, based on the average announcement date of market capitalization among forming corporations of $4.28 billion, these results suggest an incremental valuation effect of roughly $188 million from the announcement of an MLP formation during the second wave.6 Existing research on corporate reorganizations, generally, does not evidence a similar upward trend in equity valuation over this time period. Krishnaswami and Subramaniam (1999) find mean 3-day abnormal returns to spin-off announcements of 3.28% during the period 1979–1993, and Neuhierl et al. (2013) document abnormal returns of 0.4% for spin-off announcements from 2006 to 2009—far lower than the abnormal returns from MLP spin-off and carve-out announcements documented here .7 This lends credence to the present study capturing an MLP-specific effect.
I next examine whether changes to the MLP agency environment between the first and second waves affected firms differently depending on the nature of the MLP's activities. Wolfson (1985) describes the unique susceptibility of oil and gas partnerships of the 1980s to conflicts of interest, specifically relating to the ability of the GP to use partnership assets to “prove-up” properties held on its own account and to pursue suboptimal drilling strategies for its own benefit. Though MLPs of today are not identical to early oil and gas partnerships, many MLPs that engage in oil and gas exploration and production (E&P)—as opposed to midstream or other activities—could have the ability to avail themselves of similar conflicts of interest. I expect that these firms are particularly susceptible to tunneling and are more sensitive to changes in agency costs. Indeed, I find that the increased returns to MLP formation from the first to the second wave are particularly pronounced for exploration MLPs, suggesting that increased tunneling incentives have made these firms in particular more attractive to parent company shareholders. Additionally, I find that the level of ownership interest in the MLP retained by the corporate parent is negatively associated with announcement returns for E&P MLP formations and that this negative relation is driven by second-wave E&P MLP formations. Because the benefits of tunneling realized by the corporate parent are decreasing in the level of retained ownership—that is, the greater the parent's ownership in the subsidiary, the more the tunneling represents the parent “picking its own pocket”—this finding provides additional support for positive valuation effects of tunneling.
Next, I examine the effect of a change in Delaware alternative entity law, effective August 1, 2004, allowing the full waiver of fiduciary duty by partnerships and LLCs. Such a law change should increase the tunneling opportunities stemming from forming an MLP, as it further limits the recourse of limited partners in cases of GP malfeasance. Partitioning second-wave MLP formations into two groups—those formed prior to 2004 and those formed after 2004—and comparing announcement period returns reveals that 5-day CAR around the announcement date is 4.45% higher for post-waiver formations than for pre-waiver formations and that the difference is statistically significant. However, when controls for MLP size and parent ownership are included, the increase in CAR during the post-fiduciary waiver period falls short of statistical significance in two-tailed testing. This finding provides additional limited evidence that shareholders of the parent corporation are benefiting from increases in the parent's ability to tunnel the assets of the MLP.
In sum, I find that announcement period returns are significantly higher for second-wave MLP formations. This suggests that increases in the incentive and opportunity for tunneling, arising from changes to the MLP agency and operating environments, have enhanced the value impact of MLP formation for parent firms. I also show that the positive valuation effect is focused among firms having comparatively high agency costs and that the level of retained ownership in these firms by the parent is negatively related to announcement returns. Finally, I find some evidence that the allowance of full fiduciary waiver under Delaware law positively impacted the market response to MLP formations. Together these findings are consistent with investors in parent corporations expecting, ex-ante, that increased agency costs enhance the ability of the parent company to tunnel in the resources of the MLP subsidiary.8
MLPs themselves are economically significant—with a total market cap of roughly $400 billion as of October 20189—but the potential impact of tunneling within the United States is likely much farther reaching. The findings of Atanasov et al. (2010) provide empirical support for this notion, and the increasingly diverse governance structures employed by recent, high-profile initial public offerings (IPOs) of US corporations highlight the point further. For example, Snapchat, Facebook, Google and, most recently, Dell10 have established ownership structures that are increasingly unfavorable to minority shareholders, offering limited voting rights akin to those of MLP limited partnership units. The implications of these governance structures are unknown, and the present study may provide a window into their consequences.
The paper makes several contributions to the literature. Principally, it provides insight into the share price effects of tunneling to parent corporation shareholders in the United States. The study also sheds light on the valuation of second-wave MLP formations, generally—prior studies of MLP formations predate the structural changes outlined here. These issues are of importance to investors and regulators as the number and economic significance of the second wave of MLPs persists. Such issues are also of interest to regulators who may consider whether to continue the favorable tax treatment afforded to MLPs as the controversy around MLPs builds. The agency environment of MLPs and some recent corporate issuers is also of general interest to researchers, as it provides an opportunity to examine new and existing questions about the role of agency costs in firms’ management, accounting and financial policy setting. Finally, by examining the link between Delaware alternative entity law changes and price effects of MLP formation, the study contributes to the ongoing debate among legal scholars on whether contractual bargaining over governance measures can substitute for traditional fiduciary duty.
2 BACKGROUND AND LITERATURE REVIEW
2.1 Tunneling
Large shareholders can play conflicting roles in the governance of firms. On one hand, large shareholders are frequently associated with increased monitoring and higher quality governance (Jensen & Meckling, 1976), particularly when minority shareholders enjoy robust legal protection. On the other hand, Shleifer and Vishny (1997) posit that these blockholders can leverage their controlling interests to acquire private benefits—and have incentive to do so—particularly when the blockholder's cash flow rights and control rights diverge. In this latter case, the extraction of rents on the part of a controlling shareholder (or manager) is frequently referred to as “tunneling,” a term that was coined in the Czech Republic during the 1990s, when controlling shareholders removed assets from firms through an underground tunnel (Johnson et al., 2000). Atanasov et al. (2011) describe three distinct forms of tunneling: (1) cash flow tunneling—the diversion of operating cash from the firm; (2) asset tunneling—the conveyance of assets from the firm at below-market rates or to the firm at above-market rates and (3) equity tunneling—the shifting of equity ownership to the controlling shareholder/manager through dilutive share issuances, for example.
The methods and effects of tunneling have been studied extensively, particularly in the developing world. Examining the effects of economic shocks on controlled groups, Bertrand et al. (2002) identify widespread tunneling in India.11 In China, prior research has identified myriad forms of tunneling, including through inter-company loans (Jiang et al., 2010), dividend payments (D. Chen et al., 2009), non-operational fund occupancy (Jiang et al., 2015) and the non-repayment of loans from newly formed subsidiaries (Aharony et al., 2010), among others. In Chile, Urzua (2009) finds evidence of tunneling through compensation of the board of directors and its chair. In the developed world, Johnson et al. (2000) present case studies on how tunneling manifests in civil-law countries, such as France, Belgium and Italy. In Korea, Bae et al. (2002) find that acquisitions by chaebol-affiliated firms are value-destroying to the acquiring firm, yet increase overall value for the chaebol's controlling family by enhancing the value of other firms in the business group. Chang (2003) finds that controlling shareholders of Korean firms use private information to target firms from which they may shift profits to other controlled firms.
Compared to the breadth of literature on tunneling in emerging economies, the evidence of tunneling in the United States is scant. Setting the stage for such a study, Holderness (2009) examines ownership concentration in the United States, finding that 96% of public firms sampled have at least one blockholder and that these blockholders control an average of 39% of the equity of the firms. Motivated by the findings of Holderness (2009), Atanasov et al. (2010) study the ownership levels of parent corporations in publicly traded US subsidiaries. They find that subsidiaries with parents holding a substantial, but non-majority, ownership interest experience negative abnormal operating performance. Such underperformance is not observed among subsidiaries whose parent firms hold less than 5% or more than 50% of the firm's shares. They interpret these findings as evidence of tunneling. Specifically, they posit that a parent corporation's ability to tunnel the assets of the subsidiary is increasing in ownership interest, while its incentive to tunnel is decreasing in ownership interest. Thus, a parent firm holding cash flow interests of less than 50%, while still holding sufficient voting shares to wield control over the subsidiary (> 5%), is most likely to engage in tunneling.
Johnson et al. (2000) argue that tunneling arises out of a breach of fiduciary duty, which typically holds controlling shareholders and managers accountable to minority owners. In the United States, corporations are bound by this duty. However, under Delaware law, the GPs of MLPs—and by extension, the MLPs’ corporate parents—can modify, or waive entirely, their fiduciary duty to the limited partners of the MLP. That the ability to modify fiduciary responsibility came about between the first and second waves of MLP formations, as described in the proceeding section, creates a quasi-natural experiment to study the valuation effects of tunneling to parent corporations in the United States—a topic about which little is known. Indeed, the extant literature described in this section uniformly examines the effects of tunneling on controlled firms. The present study extends the literature on tunneling to its effects on controlling firms, a distinction that is illustrated in Figure 1.

2.2 MLPs
The first wave of MLP formations took place during the 1980s—beginning with the formation of Apache Petroleum in 1981 and effectively ending in 1987, with the passage of The Revenue Act of 1987 (TRA 1987). This Act limited the tax benefits of the MLP form to firms generating revenues principally from passive activities and from the exploration, refining and transportation of natural resources. Coupled with the technology bull market of the 1990s, TRA 1987 rendered natural resource MLPs afterthoughts in the minds of investors and academics. During the last two decades, however, the boom in energy production and transportation in the United States has reignited the use of, and interest in, the MLP. Indeed, this “second wave” of MLP formations—beginning as a trickle in the 1990s and becoming a flood by the early 2010s—has proven even more robust than the first. The total market capitalization of MLPs, as of October 2018, amounts to roughly 400 billion dollars, with a growth of roughly $50 billion during the 2 years prior.12 With the United States becoming the world's largest oil producer as of late 2018, the launch of MLPs by integrated major oil producers, such as Royal Dutch Shell, and the rise of MLP-related capital market products, such as exchange traded funds (ETFs), the economic significance of the MLP is likely to persist.
The organizational and governance structures of MLPs make them uniquely susceptible to conflicts of interest. The GP of an MLP carved out from corporate assets is typically owned by the parent corporation, and the parent corporation typically appoints the GP's management team and directors without a vote from the limited partners (Goodgame, 2005). This structure concentrates control of the MLP in the GP but also protects the limited liability of limited partners by restricting their participation in the management of the firm. Because MLPs formed by corporate parents generally operate in an industry that is either the same as, or related to, the industry in which the parent operates, this governance structure can lead to conflicts of interest. These conflicts of interest are not a new phenomenon—Wolfson (1985) describes the misuse of subsidiaries’ assets by parent companies of oil and gas partnerships in the 1970s and 1980s—but are exacerbated by changes in the governance structure of MLPs, which could affect the parent corporation's ability and incentive to tunnel resources from its MLP subsidiary.
First, beginning August 1, 1990, MLPs organized under Delaware alternative entity law are granted the authority to modify the fiduciary responsibility of the GP—which is frequently controlled by the corporate parent—to the MLP's limited partners through the terms of their partnership agreements. On August 1, 2004, Delaware law was clarified to allow the full waiver of fiduciary duty. Manesh (2012) finds that nearly all MLPs (∼88%) in existence as of July 2011 take advantage of their ability to modify the GP's fiduciary responsibility, with roughly half waiving fiduciary duty altogether. That these modifications of fiduciary duty might allow the GP to avail itself of certain opportunities to the detriment of limited partners is acknowledged in the operating agreements and annual reports of many MLPs. In its 2012 Form 10-K, Blueknight Energy Partners, LP states the following:
“Our partnership agreement contains provisions that reduce the fiduciary standards to which our General Partner would otherwise be held by state fiduciary duty laws. For example, our partnership agreement…permits our General Partner to make a number of decisions in its individual capacity, as opposed to in its capacity as our General Partner. This entitles our General Partner to consider only the interests and factors that it desires, and it has no duty or obligation to give any consideration to any interest of, or factors affecting, us, our affiliates or any limited partner.”
This decreased fiduciary standard could embolden the GP, and its parent corporation, to engage the assets of the MLP for its own accord to the detriment of the limited partners. Indeed, since the allowance of fiduciary modification, rating agencies and the financial press have both highlighted the potential for abuse within the MLP-parent relationship. In July 2014, Moody's issued a report identifying MLPs as particularly risky to investors because of loose corporate governance standards and greater conflicts of interest.13 As an example of these potential conflicts, in the wake of Enron's collapse, the Financial Times reported that consultants and analysts believed that parent corporations were taking advantage of their relationship with MLPs by overcharging them for risky assets, citing specifically the April 2002 sale by Williams Companies of $1 billion of pipeline assets to its MLP.14 In sum, changes to Delaware law with respect to fiduciary duty likely increase the agency costs associated with MLP formations during the second wave.
Second, the use of IDRs increased significantly from the first wave to the second.15 IDRs are cash distribution agreements that entitle the GP to receive an increasingly disproportionate share of cash distributed as the level of distributions increases. In some cases, GPs may receive close to 50% of distributed cash, despite holding only a 2% ownership interest.16 IDRs arose at least in part as a reaction to perceived abuses by GPs—such as inadequate disclosures of conflicts of interest and large up-front fees for MLP organizers—during the mid-1980s (Ciccotello & Muscarella, 2001). By tying the cash incentives of the GP directly to the ongoing cash distributions to the limited partners, IDRs were believed to encourage focus on long-term cash flow maintenance and growth. However, a possible side effect of this tiered incentive structure is the diversion of cash away from positive net present value (NPV) investments and necessary maintenance and capital expenditures and toward maximizing the GP's share of cash distributions. This possibility has received recent media, analyst and academic attention. For example, one analyst covering Kinder Morgan Energy Partners, LP, the second largest oil and gas MLP at the time, accused the firm of “starving” its assets of needed maintenance in order to maximize distributable cash,17 an accusation upon which at least one shareholder lawsuit was also based.
MLPs themselves are not bashful about the potential conflicts arising from IDRs as described in the prospectus of Quest Energy Partners, LP:
“Our general partner has incentive distribution rights entitling it to receive up to 23% of our cash distributions above certain target distribution levels in addition to its 2% general partner interest. This increased sharing in our distributions creates a conflict of interest for the general partner in determining whether to distribute cash to our unitholders or reserve it for reinvestment in the business and whether to borrow to pay distributions to our unitholders. Our general partner may have an incentive to distribute more cash than it would if its only economic interest in us were its 2% general partner interest. Furthermore, because of the commodity price sensitivity of our business, the general partner may receive incentive distributions due solely to increases in commodity prices as opposed to growth through development drilling or acquisitions.”
In the presence of a controlling shareholder, tunneling often manifests in the movement of assets from one firm in which the controlling shareholder has low cash flow rights to another firm in which the controlling shareholder's cash flow rights are greater (for detailed discussion, see Bertrand et al., 2002). Considering corporate parents of MLPs hold a median limited partner interest of 27.2% in the MLP (Atanassov & Mandell, 2018) and a 100% interest in the GP, IDRs represent an efficient way of tunneling cash to the parent via its interest in the GP. Recent academic research supports the notion that GPs may tunnel resources from MLPs through disproportionate sharing of cash distributions as cautioned in the prospectus excerpt above. Specifically, Atanassov and Mandell (2018) find that, among MLPs, governance quality and dividend yield are inversely related and that for poorly governed MLPs, high dividend levels reduce firm value and the value of cash. They attribute this finding to GPs directing cash to themselves at the expense of limited partners—that is, eschewing positive NPV projects, the majority of the benefit that accrues to limited partners, in favor of higher distributions, which accrue mostly to the GP.18 Whether such tunneling has valuation consequences for shareholders of corporate parents is the focus of this study.19
3 HYPOTHESIS DEVELOPMENT
- H1: Announcement period abnormal returns for the second wave of MLP formations are more positive than those for the first wave.
There are two primary reasons why I may not find support for H1. First, conflicts of interest, though generally outlined in the risk disclosures of MLP operating agreements, prospectuses and annual reports, could give rise to legal action, requiring costly resolution on the part of the GP and the parent corporation.20 Indeed, according to Latham & Watkins LLP, claims by unitholders against MLPs have become a growing subject of litigation.21 On this subject, one analyst covering Kinder Morgan Energy Partners, LP accused the firm of “starving” its assets of needed maintenance in order to maximize distributable cash.22 Relatedly, Kinder Morgan recently faced a shareholder lawsuit alleging that it had “allocate[d] cash flow for distributions in bad faith,” taking $3.2 billion since 2010 through its IDRs that the suit alleged was needed for the maintenance of the firm's pipeline assets.23 If, in forming an MLP, management is seen by investors as underestimating the potential costs of increased litigation stemming from MLP formation and the potential conflicts of interest arising therefrom, announcement period returns could be decreased during the second wave.
Second, tunneling may have negative reputational costs for parents of MLPs. Prior literature suggests that misdeeds on the part of a corporation or its managers can have negative valuation consequences, whether those deeds are illegal or simply unethical. In the former case, Karpoff and Lott (1993) find that allegations of fraud against corporations lead to negative abnormal stock returns of 1.34% (5.05% if the fraud is committed against the government), a penalty that cannot be attributed to the magnitude of expected regulatory penalties. Karpoff et al. (2008) find that the reputational losses of firms targeted by U.S. Securities and Exchange Commission (SEC) enforcement actions for financial fraud are 7.5 times greater than the imposed legal penalties. Similarly, in the United Kingdom, Armour et al. (2017) find that firms that engage in financial misconduct against customers or investors are subject to reputational costs that exceed the fines assessed by regulators by a factor of nine.
Corporate or managerial actions that fall short of illegality can still result in an erosion of trust on the part of investors, leading to decreased firm value. Cline et al. (2018) find that personal indiscretions of managers, such as lying about biographical information or having extramarital affairs, also have negative consequences for the firm. They find that these firms not only experience negative valuation effects but also are more likely to be subject to unrelated shareholder lawsuits and to lose business partners. In the taxation literature, Hanlon and Slemrod (2009), Dhaliwal et al. (2021) and Austin and Wilson (2017) find evidence that tax avoidance activities, while not illegal, have negative reputational effects on the firm. Specifically, Hanlon and Slemrod (2009) find that stock prices react negatively to news that firms are engaged in tax shelters. Dhaliwal et al. (2021) find that during 2011—when numerous corporations faced protests over tax avoidance behavior—firms that avoided less tax experience positive abnormal returns, compared to firms that avoided more tax. Austin and Wilson (2017) find that firms that are most sensitive to reputational costs are less likely to avoid taxes (i.e., they have higher effective tax rates).24 In the present study, the willingness of parent company management to tunnel the assets of the MLP subsidiary, though not illegal in the eyes of Delaware law, could represent a negative governance signal to the shareholders of the parent. That is, investors may ask whether management, if willing to expropriate MLP unitholders, might also be willing to extract benefits from corporate shareholders.
In addition to these two potentially deleterious effects of tunneling on announcement returns, another change to the operating structure of MLPs over the period in question could also lead to lower second-wave formation returns. Moore et al. (1989) point to improved asset management, stemming from a reduction in the diversity of tasks required of managers, as a positive share price effect of MLP formation. Comment and Jarrell (1995) and Daley et al. (1997) support the assertion that increased managerial focus positively affects firm value, and Ciccotello and Muscarella (2001) show that restrictions in operating scope are prevalent among operating agreements of first-wave MLPs. Specifically, they find that 69% of first-wave MLPs formed between 1981 and 1986 contain such restrictions. However, they find that only 24% of MLPs formed between 1988 and 1995 have provisions in their partnership agreements that similarly restrict the scope of their operations. With the shift toward a more growth-focused model among MLPs in recent years (Creswell, 2003), I expect that this trend away from scope restrictions has continued.25 This suggests that the gains in efficiency of asset management observed during the first wave of MLPs may not persist through the second wave. If the absence of restrictions of scope outweighs the positive valuation effects of tunneling opportunities described above, abnormal returns around MLP formation announcements could be less positive during the second wave.
3.1 Cross-sectional hypotheses
I interpret a finding in support of H1 as evidence of increased agency costs that enable (or further enable) tunneling by the GP and sponsor corporation. However, an alternative explanation exists. Despite the concerns of rating agencies and class-action litigants and the findings of Atanassov and Mandell (2018), it is possible that the market views the contractual freedom granted by Delaware law and by the use of IDRs as reducing agency costs. That is, consistent with Jensen (1986), the market could view IDRs not as enabling managerial shirking but instead as minimizing agency costs through the timely disbursement of excess cash. Further, because the ownership structure of MLPs is inherently susceptible to conflicts of interest (Wolfson, 1985), the market could view fiduciary modifications as limiting the GP's litigation exposure. The following hypotheses are aimed at parsing whether support for H1 evidences an increase or decrease in agency costs and tunneling.
Increased potential for conflicts of interest likely affects different types of firms unequally. Wolfson (1985) describes how conflicts of interest arise in oil and gas exploration partnerships, highlighting the ability of GPs to “prove-up” their own properties using the resources of the partnership. In this setting, GPs may adopt suboptimal drilling strategies in one partnership in order to acquire information useful for assessing the prospects of nearby drilling properties the GP holds on its own account or through another partnership where it has a more beneficial revenue-sharing agreement. Wolfson (1985) presents the following excerpt from the prospectus of 1981–1982 Damson Development Drilling Program:
“Should a Partnership acquire or lease or participate in drilling or producing operations on a Prospect in proximity to that of the General Partner or its Affiliates, the results of such activity by the Partnership may gratuitously benefit the General Partner or its Affiliates…. [This may] result in profits to the General Partner or its Affiliates, and any such profits will not be paid to the partnership.”
Similar opportunities exist among MLPs involved in the exploration of oil and gas resources, and conflict of interest provisions contained within MLP formation documents do little to protect limited partners from the abuse of such opportunities by the GP. MLPs not engaged in exploration activities also face conflicts of interest, stemming from the pricing of related party transactions, competition between the MLP and the GP and its affiliates for acquisitions, disposition of free cash flow and so on. However, these conflicts are ubiquitous across MLPs, including those involved in oil and gas exploration. So although the potential for conflicts of interest and tunneling is present across MLPs, I expect that this potential is highest for firms involved in oil and gas exploration as compared to firms operating in midstream sectors.26
- H2: Parent corporations announcing the formation of an exploration MLP will have more positive announcement period abnormal returns than firms forming non-exploration MLPs.
- H3: The market reaction to post-2004 formations is more positive than to pre-2004 MLP formations.
4 SAMPLE AND DESCRIPTIVE STATISTICS
4.1 Sample selection
The sample of MLPs and parent corporations is derived from several sources. Twenty-two unique first-wave MLP formations are identified by Moore et al. (1989) and Martin and Kensinger (1990). One of these, McCormick Oil and Gas Partnership, does not have stock price data available through the Center for Research on Securities Prices (CRSP) and is excluded. Four first-wave MLPs are formed through a total conversion of the corporation into a partnership. Because this type of formation is fundamentally different from a spin-off or carve-out and occurs only during the first wave, I exclude these four observations. A list of all MLPs formed between 1988 and 2011, of which there are 112, was obtained from Alerian,27 an independent provider of MLP data. Of these, 47 were determined, through a search of the Security and Exchange Commission EDGAR Online database and Factiva, to be formed from the assets of a publicly traded corporate parent and to have identifiable announcement dates in press releases or Forms 8-K. The resulting sample consists of 64 MLP formations from 1982 to 2011.
Table 1 presents the number of sample MLP formations by year and by industry. Panel A shows steady formation activity during the first wave, with a lull beginning in the late 1980s, persisting through the early 1990s. During the second wave, formations reached a local maximum in the years leading up to the financial crisis, with the crisis causing a temporary halt in MLP carve-outs. An upswing in MLP formations begins in 2010 and generally persists through the time of this writing. Panel B of Table 1 presents the distribution of first- and second-wave sample firms across industries. The plurality of first-wave sample firms is engaged in oil and gas exploration, with the remaining firms split between midstream energy and other industries. This is somewhat surprising, given the more volatile nature of exploration firms’ cash flows, which is not traditionally thought to be well-suited to the MLP organizational form. However, of the four first-wave formations that were formed by total conversion and excluded from the sample, only one is engaged in exploration activities. Second-wave firms follow expectations more closely, with 29 firms in the midstream energy sector and another five firms engaged in water transportation, possibly including transportation of crude oil or liquefied natural gas. Five second-wave MLPs operate in oil and gas exploration.
| Panel A: Distribution by year | |||
|---|---|---|---|
| Calendar year | MLP formations | Calendar year | MLP formations |
| 1982 | 2 | 1997 | 0 |
| 1983 | 1 | 1998 | 2 |
| 1984 | 2 | 1999 | 1 |
| 1985 | 8 | 2000 | 3 |
| 1986 | 2 | 2001 | 3 |
| 1987 | 2 | 2002 | 1 |
| 1988 | 1 | 2003 | 1 |
| 1989 | 2 | 2004 | 3 |
| 1990 | 0 | 2005 | 3 |
| 1991 | 1 | 2006 | 7 |
| 1992 | 1 | 2007 | 8 |
| 1993 | 0 | 2008 | 0 |
| 1994 | 1 | 2009 | 0 |
| 1995 | 1 | 2010 | 1 |
| 1996 | 3 | 2011 | 4 |
| Total | 64 | ||
| Panel B: Distribution by industry | ||
|---|---|---|
| Industry type | First wave | Second wave |
| Chemicals | 0 | 1 |
| Midstream–oil (crude and refined) | 3 | 15 |
| Midstream–natural gas | 2 | 14 |
| Oil and gas exploration | 8 | 5 |
| Petroleum refining | 0 | 1 |
| Propane retail sales | 0 | 2 |
| Water transportation | 0 | 5 |
| Other | 4 | 4 |
| Total | 17 | 47 |
- Note: MLP industries are determined through a review of annual reports, registration statements and press releases, as Standard Industrial Classification codes are frequently unreliable when distinguishing between operational sectors within the oil and gas industry. First-wave MLPs formed by total conversion operate in additional industries, including land management services, real estate development and residential cleaning services.
4.2 Descriptive statistics
Table 2 describes the characteristics of MLP formations and parent corporations during the first and second waves. First-wave MLP formations are, on average, larger than second-wave formations, when measured in proportion to the market value of the parent. First-wave parent corporations also tend to retain a larger percentage ownership in the newly formed MLP. However, neither of these differences is statistically significant at traditional levels. The spread between individual and corporate tax rates is smaller during the second wave, after the passage of TRA 1987. Second-wave MLPs are less likely to engage in E&P activities than are first-wave MLPs. First- and second-wave parent firms are of comparable size, have similar leverage ratios and experience similar operating performance in the year prior to MLP formation. Second-wave parent companies have higher market-to-book ratios, on average—mirroring historical trends in market-to-book ratios—but this difference is not statistically significant.
| Panel A: Summary statistics for first-wave sample (1980–1987) | ||||||
|---|---|---|---|---|---|---|
| Variable | N | Mean | Median | Std. Dev. | Q1 | Q3 |
| EXPLORE | 17 | 0.65 | 1.00 | 0.49 | 0.00 | 1.00 |
| REL_SIZE | 17 | 0.79 | 0.39 | 1.17 | 0.26 | 1.02 |
| RETAIN | 16 | 0.64 | 0.75 | 0.32 | 0.49 | 0.90 |
| TAX_DIFF | 17 | 0.03 | 0.04 | 0.02 | 0.04 | 0.04 |
| SIZE | 15 | 7.32 | 7.26 | 1.47 | 6.01 | 8.59 |
| LEVERAGE | 15 | 0.33 | 0.31 | 0.20 | 0.16 | 0.43 |
| ROA | 14 | 0.04 | 0.05 | 0.06 | 0.01 | 0.08 |
| MTB | 15 | 1.59 | 1.23 | 1.80 | 0.83 | 1.52 |
| Panel B: Summary statistics for second-wave sample (1988–2011) | ||||||
|---|---|---|---|---|---|---|
| Variable | N | Mean | Median | Std. Dev. | Q1 | Q3 |
| EXPLORE | 47 | 0.11 | 0.00 | 0.31 | 0.00 | 0.00 |
| REL_SIZE | 47 | 0.48 | 0.18 | 0.70 | 0.11 | 1.00 |
| RETAIN | 46 | 0.57 | 0.60 | 0.21 | 0.48 | 0.71 |
| TAX_DIFF | 47 | 0.01 | 0.00 | 0.03 | 0.00 | 0.04 |
| SIZE | 42 | 7.80 | 7.62 | 1.75 | 6.56 | 9.25 |
| LEVERAGE | 42 | 0.37 | 0.35 | 0.18 | 0.23 | 0.46 |
| ROA | 42 | 0.04 | 0.04 | 0.05 | 0.01 | 0.08 |
| MTB | 42 | 2.19 | 1.83 | 2.71 | 1.18 | 2.66 |
- Note: All variables are measured at the end of the fiscal year prior to the announcement of MLP formation. REL_SIZE is the size of the MLP (market value of equity) relative to the size of the parent (market value of equity). RETAIN is the percentage ownership in the MLP retained by the parent corporation. SIZE equals the log of total assets. LEVERAGE is the ratio of total debt to total assets. ROA is earnings before taxes divided by total assets. MTB is the market-to-book ratio of equity. Retained ownership data could not be obtained for the formation of Kaneb Services LLC and Pope & Talbot Inc. Eight sample firms were missing at least some Compustat data required above (three first waves and five second waves) and are excluded here; these firms are included in subsequent testing, as Compustat data is required only in untabulated robustness testing, as described throughout the study. Eight parent firms form multiple MLPs during the sample period and are each included multiple times in the above analysis, with data drawn from the appropriate time period for each formation.
5 EMPIRICAL RESULTS
5.1 Market reaction to MLP formation
In primary testing, I analyze the market reaction to first- and second-wave announcements of MLP formations. Following the methodologies of Sikes et al. (2014) and Kaniel et al. (2012), among others, I calculate the cumulative abnormal return (CAR) as the firm's cumulative return during 3-day and 5-day announcement windows less the equal-weighted CRSP return over the same period.28 In preliminary testing, mean CAR is calculated for the first- and second-wave formation announcements separately. Prior literature reveals systematic valuation differences between publicly traded firms formed by spin-off and by carve-out—see Moore et al. (1989), Denning and Shastri (1993) and Michaely and Shaw (1995). As a result, I further bifurcate the sample based on the method of formation. In subsequent testing, formations by carve-out and spin-off are pooled and a control for the method of formation is included.29 Sample differences between the first- and second-wave formations are computed for each method of formation, with a t-test applied to assess the statistical significance of any difference in mean CAR.30
Table 3 presents the results of this analysis. Panel A (panel B) gives the results of testing using a 3-day (5-day) announcement window. For MLP formations by carve-out, the market response to first-wave MLP formations is characterized by positive abnormal returns of 0.15% (0.20%) during the 3-day (5-day) window surrounding the announcement of MLP formation. However, these returns are not statistically significant. This finding contradicts Moore et al. (1989), who document significantly positive mean 2-day announcement period returns of 2.41% for MLP carve-outs. This inconsistency appears to arise from differences in specifications around computing event windows and abnormal returns.31 Low power may also be a factor, given the small sample of first-wave MLP carve-outs (12 firms). With respect to second-wave MLP carve-outs, the results indicate a significant positive market reaction to the announcement of MLP formation during both the 3-day (2.99%; p = 0.004) and 5-day (2.94%; p = 0.009) event windows. For both the 3-day and 5-day event windows, the market reaction is more positive for second-wave MLP formations, and t-tests reveal the difference to be statistically significant for both announcement windows (p = 0.061 and 0.074, respectively).32
| Panel A: 3-day CAR for first- and second-wave MLP formations | ||||||
|---|---|---|---|---|---|---|
| Carve-out formations | Spin-off formations | |||||
| Period | N | CAR | p-value | N | CAR | p-value |
| First wave | 12 | 0.15% | 0.890 | 5 | 6.67% | 0.275 |
| Second wave | 45 | 2.99% | 0.004 | 2 | 9.80% | 0.551 |
| Difference | 57 | 2.84% | 0.061 | 7 | 3.13% | 0.835 |
| Panel B: 5-day CAR for first- and second-wave MLP formations | ||||||
|---|---|---|---|---|---|---|
| Carve-out formations | Spin-off formations | |||||
| Period | N | CAR | p-value | N | CAR | p-value |
| First wave | 12 | 0.20% | 0.850 | 5 | 3.06% | 0.352 |
| Second wave | 45 | 2.94% | 0.009 | 2 | 9.57% | 0.566 |
| Difference | 57 | 2.74% | 0.074 | 7 | 6.51% | 0.678 |
- Note: The event date (day zero) is the date on which the parent corporation announces its plans to form an MLP. The T-test of sample difference is based on the assumption that variances are different across the two samples. Reported p-values are based on a two-tailed test.
- Abbreviation: CAR, cumulative abnormal return, defined as return (ret)–equal-weighted CRSP return (ewrtd).
As with announcements of MLP carve-outs, abnormal returns around MLP spin-off announcements are positive during both the first and second waves, using both a 3-day and 5-day announcement period. However, despite a higher magnitude, these returns are not statistically significant. This is possibly a result of low power resulting from a small population of MLP spin-offs over the sample period—five first waves and two second waves.
Table 4 gives the correlations among test variables in the full model of announcement period abnormal returns and presents the results of this multivariate analysis. Martin and Kensinger (1990) find that the market response to MLP formation varies positively with the size of the MLP relative to the market value of the parent and varies inversely with the proportion of MLP ownership retained by the parent. Christensen and Christensen (1991) find that announcement returns are positively related to the share of limited partner (LP) interest retained by the parent corporation. Accordingly, I include REL_SIZE and RETAIN as controls for each of these factors, respectively. REL_SIZE is computed as the market value of equity of the MLP scaled by the market value of equity of the parent corporation. Because the fair market value of the newly formed MLP is unobservable at the time of the formation announcement, perfect foresight is presumed. That is, the fair market value of the MLP's equity is obtained using the first available CRSP stock price data.33 RETAIN is computed as the proportion of ownership in the MLP retained by the parent after the IPO. When the percentage to be retained is disclosed along with the formation announcement, such disclosure is used. In other cases, perfect foresight is again presumed, and ownership information is acquired from the prospectus or from subsequent press releases.
| Panel A: Correlation among test variables | ||||||||
|---|---|---|---|---|---|---|---|---|
| Variable | (1) | (2) | (3) | (4) | (5) | (6) | (7) | |
| Dependent variable | ||||||||
| (1) | CAR5 | 1.00 | ||||||
| Independent variables | ||||||||
| (2) | SEC_WAVE | 0.14 | 1.00 | |||||
| (3) | TAX_DIFF | –0.04 | –0.38*** | 1.00 | ||||
| (4) | REL_SIZE | 0.06 | –0.16 | –0.05 | 1.00 | |||
| (5) | RETAIN | 0.13 | –0.13 | 0.12 | 0.04 | 1.00 | ||
| (6) | CARVEOUT | –0.12 | 0.36*** | –0.24* | 0.02 | 0.34*** | 1.00 | |
| (7) | EXPLORE | 0.15 | –0.55*** | 0.24* | –0.00 | 0.31** | –0.14 | 1.00 |
| Panel B: Multivariate regression of CAR around announcements of MLP formations | ||||
|---|---|---|---|---|
| Predicted | (1) | (2) | (3) | |
| Variable | Sign | CAR | CAR | CAR |
| SEC_WAVE | + | 0.032** | 0.029** | 0.044*** |
| (0.036) | (0.039) | (0.010) | ||
| TAX_DIFF | – | –0.141 | –0.182 | |
| (0.272) | (0.216) | |||
| REL_SIZE | + | 0.006 | 0.006 | |
| (0.289) | (0.243) | |||
| RETAIN | ? | 0.059 | 0.063 | |
| (0.149) | (0.176) | |||
| CARVEOUT | – | –0.042 | –0.042 | –0.039 |
| (0.126) | (0.131) | (0.138) | ||
| MTB | ? | 0.001 | ||
| (0.624) | ||||
| N | 64 | 62 | 58 | |
| R2 | 5.06% | 5.98% | 10.06% | |
- Note: The dependent variable is announcement firm CAR over the 5-day window around the announcement of MLP formation. CAR = return (ret) – equal-weighted CRSP return (ewrtd). SEC_WAVE equals one if the formation takes place during the second wave and zero otherwise. EXPLORE equals one if the MLP being formed is engaged in oil and gas exploration and zero otherwise. TAX_DIFF equals the individual tax rate minus the corporate tax rate at the time of MLP formation. REL_SIZE is the size of the MLP (total assets) relative to the size of the parent (market value of equity). RETAIN is the percentage ownership in the MLP retained by the parent corporation. CARVEOUT equals one if the MLP was formed by carve-out of corporate assets and zero otherwise. MB is the market-to-book ratio of the MLP in the year following formation. Coefficient estimates and p-values (in parentheses) are computed using robust standard errors clustered by the firm and are based on one-tailed tests when directional prediction is made and based on two-tailed tests otherwise.
- *** and ** indicate that the difference is statistically significant at the 1% and 5% levels, respectively.
Because tax rates on equity income fluctuated during the sample period, I also control for the changing valuation effect of avoiding double taxation. Ideally, separate controls for individual, corporate and dividend tax rates would be included in the model to capture these tax effects. However, because tax legislation frequently increases or decreases these rates jointly, this results in severe multicollinearity (condition number of 245.634).35 I next explore a single variable amalgamating the three relevant rates, the after-tax value of one dollar earned through a partnership less the after-tax value of one dollar earned through a corporation (facing both corporate and dividend tax rates). This transformation mitigates but does not alleviate the multicollinearity problem resulting in a condition number of 18.6. The failure of this specification appears related to the abrupt drop in the dividend tax rate—from 38.6% to 15%—in 2003, making it highly negatively correlated with the indicator variable for the second wave. Given these constraints, I control for the valuation effects of tax rates by including the control variable TAX_DIFF, which is computed as the individual tax rate less the corporate tax rate at the time of the formation announcement. Because the tax rate on dividend income was decreased significantly during the second wave, its omission from the model can be expected to bias the valuation effect from the first to the second wave downward. The inclusion of these controls reduces the sample by two observations, one during the first wave and one during the second.36
Table 1 reveals an increase in market-to-book ratios of MLPs from the first to the second wave. Although this increase mirrors overall market trends, it is possible that this also reflects a trend toward a more growth-focused strategy among MLPs. During the late 1990s, Kinder Morgan Energy Partners LP set an example of growth through acquisitions that were followed by many subsequent MLPs (Creswell, 2003; Kendall & Rogers, 2017; Mandell & Atanassov, 2018). Whether new, second-wave MLPs will be content to hold and operate existing mid-stream assets or will seek to expand—organically or through acquisitions—is difficult to assess ex-ante. However, to allay, at least in part, concerns that the new focus on growth among second-wave MLPs is responsible for valuation changes, I include MLP market-to-book ratio (MTB)—computed in the first fiscal year post-formation, in multivariate testing. This results in the loss of four additional observations, two first waves and two second waves.
As described in the Appendix, several other factors may also influence the valuation of MLP carve-outs. These include information signaling, improved managerial efficiency, reduced information asymmetry and changes in administrative costs. Some of these factors are specific to MLP formations, while others apply to carve-outs broadly. In either case, I expect that these factors apply uniformly across the first and second waves (e.g., a subdivision of assets across entities likely reduces information asymmetry to a similar degree both before and after structural changes to the MLP environment). As a result, I do not include controls for these factors, to the extent that measures for such factors are observable and quantifiable. Further, as with any long-horizon study, it is possible that other factors that may affect valuation—such as disclosure practices or regulations other than those studied here—have changed over time. This is a limitation of the present study and should be considered when interpreting results.
Table 4, panel B, reports multivariate results using 5-day CAR around MLP formation announcements.37 Column 1 first reports pooled results, controlling only for the method of formation. Consistent with the univariate results presented in Table 3, I find that 5-day announcement returns are 3.2% higher during the second wave of MLP formations. This result persists with the inclusion of valuation controls—with the second-wave returns 4.4% higher (p = 0.010) when all controls are present. Based upon a mean market capitalization among second-wave parent corporations of roughly $4.28 billion (untabulated), this increase in abnormal returns equates to an additional $188 million of value creation, on average, from the announcement of MLP formation during the second wave, when compared to first-wave announcements. Consistent with the findings of Christensen and Christensen (1991), and contrary to the findings of Martin and Kensinger (1990), I find a positive coefficient on RETAIN; however, this result is not significant in two-tailed testing (p = 0.176).
The results in Tables 3 and 4 support H1. That is, they are consistent with two potential ex-ante investor beliefs: (1) overall agency costs are increased, enhancing the ability of the parent company to tunnel the assets of the MLP, with benefits accruing to the parent firm's shareholders; or (2) agency costs are reduced by the presence of fiduciary modification and IDRs, and shareholders of the parent corporation benefit from reduced litigation exposure. Subsequent tests examine the market response to MLP formation in more detail and could help distinguish between the two scenarios.
5.2 Formation of oil and gas exploration MLPs
| Panel A: Exploration versus non-exploration MLP formations across waves (−2, 2) | ||||
|---|---|---|---|---|
| Predicted | (1) | (2) | (3) | |
| Variable | Sign | CAR | CAR | CAR |
| SEC_WAVE | + | 0.024 | 0.007 | –0.000 |
| (0.154) | (0.408) | (0.502) | ||
| EXPLORE | + | 0.003 | –0.019 | 0.100 |
| (0.446) | (0.298) | (0.144) | ||
| SEC_WAVE x EXPLORE | + | 0.096** | 0.117** | 0.107** |
| (0.024) | (0.016) | (0.024) | ||
| RETAIN x EXPLORE | – | –0.168** | ||
| (0.039) | ||||
| TAX_DIFF | – | –0.020 | –0.019 | |
| (0.467) | (0.469) | |||
| REL_SIZE | + | 0.004 | 0.005 | |
| (0.370) | (0.350) | |||
| RETAIN | ? | 0.052 | 0.087** | |
| (0.198) | (0.011) | |||
| CARVEOUT | – | –0.046 | –0.042 | –0.022 |
| (0.109) | (0.127) | (0.305) | ||
| N | 64 | 62 | 62 | |
| R2 | 19.51% | 21.77% | 27.75% | |
| Panel B: Retained ownership of exploration and production MLPs and CAR across waves (−2, 2) | ||||
|---|---|---|---|---|
| Variable | Predicted sign | First wave | Second wave | Difference(p-value) |
| EXPLORE | + | –0.0641 | 0.4519*** | 0.000*** |
| (0.168) | (0.000) | |||
| RETAIN | ? | –0.0409 | 0.1534*** | 0.001*** |
| (0.613) | (0.001) | |||
| RETAIN x EXPLORE | – | 0.0577 | –0.5660*** | 0.000*** |
| (0.715) | (0.000) | |||
| N | 16 | 46 | ||
| R2 | 40.23% | 52.56% | ||
| Controls | YES | YES | ||
- Note: The dependent variable is announcement firm CAR over the 5-day window around the announcement of MLP formation. CAR = return (ret) – equal-weighted CRSP return (ewrtd). SEC_WAVE equals one if the formation takes place during the second wave and zero otherwise. EXPLORE equals one if the MLP being formed is engaged in oil and gas exploration and zero otherwise. TAX_DIFF equals the individual tax rate minus the corporate tax rate at the time of MLP formation. REL_SIZE is the size of the MLP (total assets) relative to the size of the parent (market value of equity). RETAIN is the percentage ownership in the MLP retained by the parent corporation. CARVEOUT equals one if the MLP was formed by carve-out of corporate assets and zero otherwise. Coefficient estimates and p-values (in parentheses) are computed using robust standard errors clustered by firm and are based on one-tailed tests when directional prediction is made and based on two-tailed tests otherwise.
- *** and ** indicate that the difference is statistically significant at the 1% and 5% levels, respectively.
To this point, the coefficient on RETAIN has been positive but insignificant across all tests where it is included. If parent corporations are engaged in tunneling the MLP's assets, I expect a negative relation between retained ownership and announcement returns because, as the parent's LP interest in the MLP increases, tunneling increasingly represents the parent corporation expropriating assets over which it also holds substantial cash flow rights. In the MLP setting, the parent corporation holds full control over the MLP as long as it owns the GP interest. As a result, the gains to tunneling are decreasing as the parent's LP interest increases. To more closely examine the effect of retained ownership on announcement CAR, I include the interaction term RETAIN*EXPLORE in column 3. If tunneling opportunities have increased from the first to the second wave and E&P MLPs present corporate parents with the greatest ability to tunnel, then the level of retained ownership should have a more negative effect on announcement returns for this subset of MLP formations. Consistent with this expectation, I find that the coefficient on the interaction term is negative (−0.168) and p = 0.039.
To parse this result further, I next study whether the relation between retained ownership and formations of E&P MLPs has changed as the agency environment has changed—from the first to the second wave. Panel B of Table 5 presents the results of this analysis. Here, I find that the negative relation between RETAIN and CAR for E&P formations is driven entirely by second-wave observations. That is, the coefficient on RETAIN*EXPLORE is 0.058 (p = 0.715) in the first wave and −0.566 (p = 0.000) in the second wave, and the difference in coefficients is statistically significant (p = 0.000). This suggests that increases in the incentive and opportunity for tunneling arising between the first and second waves have materially affected the way in which corporate shareholders value MLP formations and provides additional support for a positive valuation of tunneling opportunities.39
In sum, the results presented in Table 5 indicate that investors positively value the ability of parent corporations to tunnel the assets of the MLP subsidiary. Specifically, the positive and significant coefficients on the interaction terms provide evidence that parents forming exploration MLPs benefitted more from the structural changes to the MLP environment than did parents forming non-exploration MLPs, in terms of the market's response to their formation announcements.
5.3 The role of fiduciary waiver in market reaction to MLP formation
If changes to Delaware alternative entity law affect the agency costs associated with MLP formation, the allowance of full waiver of fiduciary duty beginning August 1, 2004, will influence announcement period returns by increasing these costs. Because the Act was approved on June 24, 2004, and debated for some time prior, I eliminate MLPs announced during 2004 from this analysis, as it is unclear whether investors might anticipate the possibility of fiduciary waiver for these firms. This reduces the sample by three observations. I also exclude first-wave formations from this analysis in the interest of comparability between groups. The resulting sample consists of 44 second-wave MLP formations, of which 21 (23) are formed before (after) the allowance of fiduciary waiver.
Table 6 presents the results of this analysis. In testing controlling only for formation method—reported in column 1—5-day CAR is 4.5% higher during the post-fiduciary waiver period (p = 0.016). When additional controls are included,40 the positive coefficient on POST_WAIVER persists but has reduced statistical significance (p = 0.125).
| Predicted | (1) | (2) | |
|---|---|---|---|
| Variable | Sign | CAR | CAR |
| POST_WAIVER | + | 0.045** | 0.039 |
| (0.016) | (0.125) | ||
| REL_SIZE | + | 0.027*** | |
| (0.006) | |||
| RETAIN | ? | 0.047 | |
| (0.593) | |||
| CARVEOUT | – | –0.089 | 0.006 |
| (0.157) | (0.554) | ||
| N | 44 | 43 | |
| R2 | 12.44% | 21.20% |
- Note: The dependent variable is announcement firm CAR over the 5-day window around the announcement of MLP formation. CAR = return (ret) – equal-weighted CRSP return (ewrtd). POST_WAIVER equals one if the formation takes place after 2004 and zero otherwise. REL_SIZE is the size of the MLP (market value of equity) relative to the size of the parent (market value of equity). RETAIN is the percentage ownership in the MLP retained by the parent corporation. CARVEOUT equals one if the MLP was formed by carve-out of corporate assets and zero otherwise. Coefficient estimates and p-values (in parentheses) are computed using robust standard errors clustered by firm and are based on one-tailed tests when directional prediction is made and based on two-tailed tests otherwise.
- *** and ** indicate that the difference is statistically significant at the 1% and 5% levels, respectively.
The results of Table 6 provide weak support for H3. The increase in announcement period returns after the allowance of fiduciary waiver, reported in column 1, supports a positive market valuation of conflicts of interest. However, care should be used when interpreting this finding, as it is confounded by the impact of exploration activities on market response. That is, all five oil and gas exploration firms formed during the second wave are formed in 2005 or later—after the passage of full fiduciary waiver. However, when these firms are removed, tests of mean CAR (untabulated) reveal a difference between post- and pre-waiver firms of 2.56% during the 5-day announcement window (p = 0.088). While the exclusion of exploration firms weakens the results in terms of economic and statistical significance, it is possible that the change in Delaware law to allow fiduciary waiver was a factor in the decision of these firms to form exploration MLPs. Indeed, three of the four forming corporations included a full fiduciary waiver in the partnership agreements of their newly formed exploration MLPs.41
5.4 Valuation effects of changes to MLP legal environment
If parent corporations and their shareholders benefit from increased tunneling opportunities and legal protection during the second wave, then negative shocks to that legal protection could have deleterious effects on parent company valuation. To examine this possibility, I leverage the resolution of a lawsuit brought against El Paso Corp. (El Paso), the parent corporation of El Paso Pipeline Partners (the MLP), on April 20, 2015, in the Delaware Court of Chancery.42 This case centered on a two-phase, $2.4 billion acquisition by the MLP of a natural gas subsidiary of El Paso—a purchase price that some MLP unitholders alleged benefitted El Paso at the expense of the MLP.43 The committee established by the GP of the MLP—a subsidiary of El Paso—to evaluate the deal on behalf of the MLP approved it despite expressing reservations privately. The Court's Vice Chancellor ruled that the committee had violated its subjective good faith obligation to the limited partners and instead acted simply to “appease” El Paso and its interests.
This ruling was likely unanticipated by market participants, given that prior, similar lawsuits against parents of MLPs ended in dismissal. Indeed, Reuters described the decision as “a ruling that could bolster the legal power of investors in an increasingly popular investment vehicle used in the energy sector.”44 If investors in the corporate parents of MLPs value the parent's ability to tunnel the assets of the MLP, this ruling should be viewed as value-destroying to the parent. With this in mind, I examine the market's response to the Delaware Court of Chancery's ruling on April 20, 2015. I first identify all MLPs in existence on the date of the ruling that have publicly traded parent corporations, finding 43. I then compute 1-day abnormal returns for the parent corporations of this population of MLPs, following the methodology described in the testing of H1.45 This results in a sample of 39 parent corporations, as four corporations are parents to two MLPs. The results of this testing, presented in Table 7, panel A, reveal that these corporations experienced negative abnormal returns of (0.72%; p = 0.005) on the date of the ruling.46 Because this testing involves only one trading date and the vast majority of the sample operates in the energy industry, I also compute industry-size-adjusted abnormal returns, finding negative CAR of (0.74%; p = 0.009) in panel B.47
| Panel A: 1-day CAR using equal-weighted CRSP return | |||
|---|---|---|---|
| Variable | N | Coefficient | p-value |
| CAR | 39 | –0.0072 | 0.005*** |
| Panel B: 1-day CAR using industry-size-adjusted portfolios | |||
|---|---|---|---|
| Variable | N | Coefficient | p-value |
| CAR | 39 | –0.0074 | 0.009*** |
- Note: The event date (day zero) is the date on which the decision was rendered in re El Paso Pipeline Partners, L.P. Derivative Litigation, C.A. No. 7141-VCL (Del. Ch. Apr. 20, 2015). Coefficients and p-values are computed using an intercept-only OLS regression model. Reported p-values are based on a two-tailed test.
- Abbreviation: CAR, cumulative abnormal return, defined in panel A as return (ret)–equal-weighted CRSP return (ewrtd) and in panel B as return (ret)–industry-size-adjusted portfolio return.
Taken in combination with the results presented in prior sections, the negative abnormal returns experienced by MLP parent corporations on the date of the Delaware Court's ruling suggest that parent company shareholders positively value the parent's ability to tunnel the assets of the MLP and view the buttressing of MLP limited unitholder rights as value-destroying.
5.5 Supplemental testing
MLPs and their corporate parents are primarily clustered in the energy sector, particularly during the second wave. The boom in US energy production and transportation during the last two decades caused stock returns in the energy sector to frequently outperform that of the market as a whole. Because of this, it is possible that the increase in abnormal returns from the first to the second wave documented in the previous subsection may be biased upward. With this in mind, I repeat the testing described earlier with CAR now computed using returns on industry-size-matched portfolios in place of equal-weighted market returns. Industry-size returns are calculated from portfolios based on terciles of the market value of equity and three-digit Standard Industrial Classification (SIC) codes. Where the intersection of these groups includes fewer than five unique firms, I use two-digit SIC codes. If a size-industry group using two-digit SIC codes has fewer than five unique observations, one-digit SIC codes are used to construct the portfolio return.
In untabulated testing, I find results that are generally consistent with those presented above. Specifically, in multivariate tests of H1, I find that second-wave MLP formation announcements enjoy 3-day abnormal returns that are 2.4% higher (p = 0.048) than first-wave formation announcements and 5-day returns that are 2.3% higher (p = 0.091). In tests of H2, I again find support for E&P MLP formations as particularly benefitted by increased tunneling opportunities from the first wave to the second—coefficients on the interaction term in the industry-adjusted specification of equation (1) are 0.150 (p = 0.009) and 0.095 (p = 0.051) in 3-day and 5-day testing, respectively. In tests of H3, I continue to find positive coefficients on POST_WAIVER in 3-day (3.6% CAR, p = 0.082) and 5-day (3.1% CAR, p = 0.101) testing.
In this study, the second wave of MLP formations is defined as those formed between 1988 and 2011. However, the modification of fiduciary duty under Delaware alternative entity law was not allowed until August 1, 1990, with full waiver of fiduciary duty only allowed since 2004. This raises concern that the structural changes presented in this study are not well captured by the time periods specified. However, I persist in specifying 1988 as the start of the second wave for two reasons. First, all three MLPs formed in the period 1988–1990 have IDRs provisions, which are at the heart of the agency conflict described in this study, and are infrequently employed by first-wave MLPs. Second, Ciccotello and Muscarella (2001) find that the drop-off in restriction of scope provisions in MLP operating agreements occurred during the period 1988–1995. So despite the inability of GPs to limit their fiduciary responsibility to the limited partners during the 1988–1990 period, these MLPs share the other important governance and agency conditions with other second-wave MLPs.
Nevertheless, in untabulated testing, I study whether the results are sensitive to an alternative specification of “second wave.” Restricting the second wave to formations of MLPs occurring after the allowance of fiduciary modification—August 1, 1990—and excluding the three formations between 1988 and 1990, I find results that are nearly identical to those presented in Table 3, in both economic and statistical significance.
The tunneling of assets from the MLP could be constrained by monitoring from third-party stakeholders, such as creditors of the MLP. With this in mind, I assume perfect foresight of MLP borrowing activities in the first year of operations and examine whether primary results are robust to the inclusion of MLP leverage as an additional control variable. I find that results under this specification (untabulated) are nearly identical to those presented in Table 4, in terms of both economic and statistical significance. Finally, Table 1, panel B, reveals that nine MLPs formed during the second wave operate in industries that are not represented in the sample of first-wave MLP formations. To examine whether this industry participation influences the results of primary testing, I perform the analysis excluding these nine observations. The results of this testing (untabulated) are again substantially similar in economic and statistical significance.
6 CONCLUSION
This study examines whether tunneling has valuation consequences for shareholders of parent corporations. Changes to the MLP agency environment over the prior two to three decades make MLP formations a rich setting, and quasi-natural experiment, to carry out such a study. Most prominent among these changes is the allowance of modifications to fiduciary responsibility under Delaware partnership law, beginning in 1990, and the popularization of IDRs around the same time. I document significantly higher announcement period returns for second-wave MLP formations, suggesting that changes to the MLP agency and operating environments have enhanced the value impact of MLP formation. I also find support for the assertion that parent corporations benefit from opportunities to tunnel the assets of the MLP. Specifically, I show that the positive valuation effect of structural changes is focused among formations of MLPs with comparatively high agency costs and that the level of retained ownership by parent corporations is negatively associated with stock returns around the announcement of formations of these MLPs. Further, I find some evidence that the allowance of full fiduciary waiver under Delaware law positively impacted the market response to MLP formations. This is consistent with investors in parent corporations expecting, ex-ante, that increased agency costs enhance the ability of the parent company to tunnel the assets of the MLP.
MLPs are themselves economically significant. However, the study of the valuation consequences of their formation in this context could provide inferences that are farther reaching. This is particularly true considering recent high-profile IPOs for corporations with similar governance structures to MLPs. Specifically, Snapchat, Facebook, Google and, most recently, Dell have established ownership structures that are increasingly unfavorable to minority shareholders, offering limited voting rights akin to those of MLP limited partnership units. The implications of these governance structures are unknown, and the present study may provide a window into their consequences. Further, as non-corporate entities become an increasingly important part of the US economy, the study of MLPs could provide researchers with valuable insight into organizational forms for which financial data is not generally publicly available. Finally, future research may be directed toward the prediction of Moore et al. (1989) and others that MLP formation results in improved information flow between the parent corporation and its shareholders. Recent studies—specifically, Balakrishnan et al. (2019) and C. Chen et al. (2018)—suggest that tax-motivated transactions may increase organizational complexity and information asymmetry. Whether MLP formations have similar informational effects is an open question.
ACKNOWLEDGMENTS
I appreciate valuable comments from Ryan Wilson, David Guenther, Linda Krull, Steven Matsunaga, Wesley Wilson, Karly Mandell, the anonymous referee and workshop participants at the University of Oregon, the University of Wisconsin-Madison and the University of Wisconsin-Milwaukee. I acknowledge financial support from the AICPA Accounting Doctoral Scholars program, the Lundquist College of Business Accounting Department and the Sheldon B. Lubar School of Business. All errors and omissions are my own.
REFERENCES
EXHIBIT
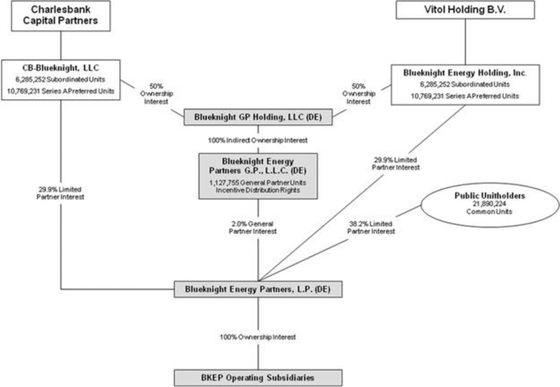
Exhibit 2
Sample Incentive Distribution.
Section 5.4 of Third Amended and Restated Agreement of Limited Partnership of Kinder Morgan Energy Partners, L.P.
5.4 DISTRIBUTIONS OF CASH FROM OPERATIONS. An amount equal to 100% of Available Cash with respect to any calendar quarter that is deemed to be Cash from Operations pursuant to the provisions of Section 5.3 or 5.5 shall be distributed in accordance with Section 5.7(a) as follows, except as otherwise required by Section 4.1(c) in respect of additional Partnership Securities issued pursuant thereto:
(a) First, 99% to all Limited Partners, Pro Rata, and 1% to the General Partner until there has been distributed in respect of each Unit Outstanding as of the last day of such quarter an amount equal to the Minimum Quarterly Distribution;
(b) Second, 99% to all Limited Partners, Pro Rata, and 1% to the General Partner until there has been distributed in respect of each Unit Outstanding as of the last day of such quarter an amount equal to the excess of the First Target Distribution over the Minimum Quarterly Distribution;
(c) Third, 85.8673% to all Limited Partners, Pro Rata, and 14.1327% to the General Partner until there has been distributed in respect of each Unit Outstanding as of the last day of such quarter an amount equal to the excess of the Second Target Distribution over the First Target Distribution;
(d) Fourth, 75.7653% to all Limited Partners, Pro Rata, and 24.2347% to the General Partner until there has been distributed in respect of each Unit Outstanding as of the last day of such quarter an amount equal to the excess of the Third Target Distribution over the Second Target Distribution; and
(e) Thereafter, 50.5102% to all Limited Partners, Pro Rata, and 49.4898% to the General Partner;
provided, however, if the Minimum Quarterly Distribution, the First Target Distribution, the Second Target Distribution and the Third Target Distribution have been reduced to zero pursuant to the second sentence of Section 5.6, the distributions of Available Cash that is deemed to be Cash from Operations with respect to any quarter will be made solely in accordance with Section 5.4(e)
- 1 According to Holderness (2009), virtually all (96%) publicly traded corporations have one or more blockholders, with average aggregate ownership of 39%.
- 2 See Exhibit for an example of a typical MLP organizational structure.
- 3 Limited partners of MLPs typically do not have voting rights over the board of directors of the MLP or its GP (Manesh, 2012).
- 4 I note that cash flow tunneling among MLPs in this setting, through the use of IDRs and fiduciary waivers, does not represent an illegal activity. Indeed, the ability of the GP to engage in such activity is clearly outlined in the operating agreements of MLPs as discussed later.
- 5 The results of testing throughout the paper are quantitatively and qualitatively similar when using a 3-day announcement window in place of the 5-day window presented here.
- 6 It is important to note that this valuation increase cannot be directly attributed to increases in tunneling activity or opportunity. On one hand, positive changes in announcement returns could be attributable to factors unrelated to tunneling that are not captured by the present study. On the other hand, not all gains from tunneling will accrue to parent company shareholders, as management may capture some of these benefits.
- 7 Given the small sample size of this study and lack of direct testing, the reader should use caution in interpreting this difference, which likely arises from tunneling and non-tunneling factors.
- 8 As with any small-sample study, the reader should use caution when interpreting these results, particularly those relating to secondary testing in which the sample is further restricted below the initial 64 observations.
- 9 According to Alerian (2018).
- 10 See Bebchuk and Kastiel (2019) for a detailed discussion of Dell's planned IPO and multi-class structure.
- 11 Siegel and Choudhury (2012) contradict this finding, however, using a revised methodology and new data.
- 12 According to Alerian (2018).
- 13 “Moody's: MLP's Corporate Governance Can Sideline Creditors.” Moody's investors service press release, July 22, 2014.
- 14 “Williams address concerns over MLPs.” Financial Times, November 18, 2002.
- 15 Only one MLP formed from corporate assets between 1981 and 1987, based on the samples of Moore et al. (1989) and Martin and Kensinger (1990), employed an IDR, compared to 39 out of 47 sample firms formed between 1988 and 2011.
- 16 See Exhibit 2 for a sample incentive distribution provision.
- 17 Driver, A. 9/10/2013. “Upstart analyst says Kinder ‘starves’ assets for investors.” Reuters.
- 18 See Exhibit 2 for a sample IDR structure, which directs a disproportionate share of cash distributions to the GP.
- 19 The valuation effects of first-wave MLP formations received broad academic attention during the 1990s and early 2000s. The Appendix presents a detailed discussion of MLP formation and of the potential benefits and costs arising therefrom, which are documented in prior research.
- 20 See, for example, Allen v. Encore Energy Partners, L.P., No. 534-2012 (Del. July 22, 2013) and Hite Hedge LP v. El Paso Corp., No. 7177-VCG, 2012 WL 4788658 (Del. Ch. Oct. 9, 2012), both of which employ fiduciary waivers; and Brinckerhoff v. Enbridge Energy Co., No. 5526-VCN, 2011 WL 4599654 (Del. Ch. Sept. 30, 2011) and Gerber v. Enterprise Products Holdings, LLC, No. 5989-VCN, 2012 WL 34442 (Del. Ch. Jan. 6, 2012), which modify, but do not waive, fiduciary duty.
- 21 See http://www.lw.com/mlp-Portal/caselaw.
- 22 Driver, A. 9/10/2013. “Upstart analyst says Kinder ‘starves’ assets for investors.” Reuters.
- 23 Slotoroff v. Kinder Morgan Inc., CA9318, Delaware Chancery Court (Wilmington).
- 24 It should be noted that several studies examining market responses to tax avoidance do not find evidence of costly reputational effects. See, for example, Gallemore et al. (2014) and Nesbitt et al. (2017).
- 25 Recent studies of MLP governance support this expectation, as restrictions of scope provisions are excluded from the analyses of Goodgame (2005, 2012), Ribstein (2009)s and Manesh (2012).
- 26 As midstream MLPs have increasingly pursued a growth-focused strategy during the second wave (Creswell, 2003; Kendall & Rogers, 2017), the line between midstream and upstream MLPs has somewhat blurred. This convergence of business models does not impact the relative conflicts of interest facing each MLP type and should bias downward the differential returns from forming E&P MLPs, compared to traditional, midstream MLPs.
- 27 See http://www.alerian.com/education/figures-and-tables/.
- 28 Untabulated tests using value-weighted CRSP returns to compute CAR arrive at similar conclusions.
- 29 The results reported throughout the paper are robust to the inclusion of carve-outs only, of which there are 12 in the first wave and 45 in the second.
- 30 A Welch–Aspin t-test is used, as Levene tests reject the null hypothesis of equal variances across first- and second-wave CAR. The Levene test of variance equality is used because Shapiro–Wilk tests reveal non-normality in the sample CAR.
- 31 Moore et al. (1989) measure abnormal returns using prediction errors computed with parameter estimates from market model regressions over a 200 trading day estimation window. Further, CAR are calculated over a 2-day window (Day 1 and Day 0), which does not capture post-announcement price reversion. In untabulated testing, I replicate Moore et al. (1989) with results matching theirs. Untabulated tests also reveal positive abnormal returns for a combined sample of all first-wave MLP formations, irrespective of formation type, consistent with prior literature.
- 32 Prior research helps allay concerns that the increased market response to the MLP carve-out announcement from the first to second wave may be part of an upward trend in announcement returns for equity carve-outs and spin-offs generally. Specifically, Krishnaswami and Subramaniam (1999) find 3-day CAR around spin-off announcements of 3.28% for the period 1979–1993, and Neuhierl et al. (2013), using a sample of spin-off announcements from 2006 to 2009, find 7-day CAR of 2.92% and 2.56% depending on whether the announcement reveals intent or certainty regarding the spin-off decision, respectively. Furthermore, Bergh et al. (2008) document CAR of roughly 2% for corporate restructurings over the period 1990–1997.
- 33 Tests are robust to replacing the market value of equity of the MLP with the book value of MLP assets from the first available balance sheet. However, doing so reduces the sample size by five observations as a result of balance sheet data limitations during the first wave.
- 34 Condition number refers to the square root of the ratio of the largest and smallest eigenvalue of X. A condition number in excess of 15 generally indicates some multicollinearity concern, while a condition number in excess of 30 indicates severe multicollinearity concern.
- 35 Untabulated testing is robust to this specification in both sign and significance; however, coefficients on SECOND_WAVE are inflated beyond a reasonable range.
- 36 Retained ownership data could not be obtained for the formation of Pope Resources, LP by Pope & Talbot, Inc. or for the formation of Kaneb Services, LLC by Kaneb Services, Inc.
- 37 Results of testing using 3-day CAR are substantially similar to those using 5-day CAR. Because inferences persist irrespective of announcement window, only results using 5-day CAR are tabulated going forward, in the interest of clarity and brevity.
- 38 See Table 1, panel B, for a breakdown of sample MLP formations by industry, including oil and gas exploration.
- 39 As noted throughout, the reader should exercise caution in drawing inferences from small sample tests. Table 5, panel B, column 1, reports an analysis of 16 observations, so due care is again warranted.
- 40 TAX_DIFF is excluded from this model due to a lack of variation during the post-waiver period.
- 41 One firm, Atlas America, Inc., formed two of the E&P MLPs during the post-waiver period.
- 42 In re El Paso Pipeline Partners, L.P. Derivative Litigation, C.A. No. 7141-VCL (Del. Ch. Apr. 20, 2015)
- 43 I note that the issues of this case more closely resemble asset or equity tunneling, as opposed to cash flow tunneling. These forms of tunneling are not unique to MLPs (Atanasov, et al, 2011). However, a finding against El Paso in this case indicates a willingness on the part of Delaware courts to challenge the protections afforded by fiduciary exculpation, which affects the GP's ability to tunnel the assets of the MLP in any capacity.
- 44 Hals, T. 4/20/2015. “Delaware judge hits El Paso pipeline deal with $171 mln judgment.” Reuters.
- 45 I use 1-day returns, as I do not expect information leakage in this litigation setting. However, results are similar when using 3-day CAR.
- 46 On December 20, 2016, the Delaware Supreme court overturned the Chancery Court's judgement, ruling that, the claim was a derivative lawsuit and because the MLP and El Paso were acquired by Kinder Morgan, Inc. prior to the lawsuit's filing, the plaintiff lacked sufficient standing to sue. If investors anticipated a successful appeal of the original decision, this should bias against my finding of negative equity returns around the ruling date.
- 47 The methodology for computing industry-size portfolios is discussed in detail in the supplemental testing section.