Learning curve in the Cut and Paste method for surgery of primary pterygium
Abstract.
Purpose: To evaluate the learning curve for the surgery of primary nasal pterygium with conjunctival autograft using fibrin adhesive (the Cut and Paste method).
Methods: The outcomes of the first consecutive 120 primary pterygium surgery cases for two surgeons (groups A and B) were investigated retrospectively and compared with the first (group C) and second (group D) 120 cases of GK. A and B were previously inexperienced in pterygium surgery. Outcome variables were surgery time, complications, the number and the temporal distribution of the recurrences. The statistics used were moving averages of the recurrences, Scheffé’s test of means, learning curve analysis according to Wright and logarithmic curve fitting to operation time data. The impact of age and sex on recurrences was tested using t-tests and chi-square tests.
Results: The mean surgery time was 17 min for A, 13 min for B and 13 min for GK. There was a certain learning curve slope in operation time in groups A and C. The postoperative complications were few and acceptable. There were ten (8.9%) recurrences in group A, eight (6.8%) in group B, six (5.5%) in group C and five (4.6%) in group D. The temporal distribution of the recurrences did not show any learning curve. Age and sex had no significant correlation with recurrence rate or surgery time (data not shown).
Conclusions: Our study indicates that the Cut and Paste technique is easy to learn and master. We did not find a significant learning curve regarding surgery time, recurrences or complications. In a clinical setting, it is beneficial to let a few, otherwise experienced eye surgeons learn the technique.
Introduction
Pterygium surgery has evolved tremendously in the recent years (Hirst 2003). Today, patients expect easy, safe, short surgery with minimal postoperative discomfort, good cosmetic results and low recurrence rate. Conjunctival autografting has emerged as a safe and effective procedure, and the method of choice (Hirst 2003), because adjunctive therapies such as beta irradiation and mitomycin C may be associated with serious complications (Mackenzie et al. 1991; Rubinfield et al. 1992). Using fibrin sealant to secure the graft, the surgery is now easier and takes less time to perform compared with suturing. Patient discomfort also diminished (Koranyi et al. 2004).
The recurrence rates reported for conjunctival autografting vary in the literature between 0.4% and 39% (Lewallen 1989; Shaw 1992; Chen et al. 1995; Tan et al. 1997; Dadeya et al. 2002; Syam et al. 2003; Hirst 2008). The best results, 2% and 0.4%, are reported by single, experienced, devoted surgeons (Tan et al. 1997; Hirst 2008). We have also reported a low recurrence rate (5%) in a long term, controlled study performed by a single surgeon (Koranyi et al. 2005).
A learning curve is a graphical representation of the effort needed to learn certain information or acquire special skills or master an activity. It can be measured by the changes in elapsed time for a procedure. Peroperative and postoperative complications, that is, recurrences, can also serve as statistical variables.
In medicine, this term is often used to describe how difficult a procedure is to master, and the outcome measures are often complication rate and failure rate. Thus, in these cases, the proper term may be success rate rather than learning curve.
In this retrospective study, we combined these definitions and analysed the development in surgery time along with the temporal occurrence of recurrences and complications in conjunctival autografting with fibrin glue. We also discuss factors that may affect the success of this procedure.
Methods
Two ophthalmologists, A (in 2001) and B (in 2003), were trained by GK who has previously performed more than 500 procedures with conjunctival autograft since 1994 and who invented the Cut and Paste method (Koranyi et al. 2004) in 1999. Neither A nor B had any previous experience of pterygium surgery; A was experienced in eyelid surgery, while B was mainly a cataract surgeon. The training was performed as two surgeons sessions with about six patients on each occasion.
All patients who underwent excision of pterygium by A, B and GK were identified. Hospital charts were obtained and clinical details recorded. Data concerning only one (the first operated) eye of the first consecutive patients for each surgeon were analysed. Recurrent, pseudo- or temporally situated pterygia were excluded. One hundred and twenty charts were selected for analysis in each group A, B and C. Patients in group A and group B were operated on by surgeon A and surgeon B, respectively, while those in group C were the first 120 consecutive patients operated on by GK. Group D, the second 120 series of suitable cases operated on by GK, served as a reference group. This group was considered not to show any learning curve.
The course of the surgery was as previously published (Koranyi et al. 2004). Neither adjuvants nor sutures were used. The postoperative topical treatment was exactly the same in all groups. Rimexolone eye drops six times daily and fucidic acid ointment two times daily were started. After 1 week, fucidic acid was stopped and rimexolone tapered out during 5 weeks.
As a routine, all patients were given an appointment 1 week, 6 and 12 months after surgery, and extra examinations were carried out in case of complaints. Complications were defined as all remarks in the medical charts that deviated from the expected postoperative appearance.
Recurrence was defined as a fibro-vascular lesion developing at the site of the previous excision and encroaching onto the cornea.
Surgery times were analysed by fitting of logarithmic curves to data, as the data points appeared to follow a logarithmic line. The temporal distribution of the recurrences was analysed using the calculation of moving averages. This statistic method, commonly used with time-series data, analyses a set of data points by creating a series of averages of different subsets of the full dataset in order to smooth out short-term fluctuations and highlight longer-term trends or cycles.
Learning percentages according to Wright were calculated. The theory of learning states that repetition of the same operation results in less time or effort expended on that operation. If the rate of improvement is 20% between doubled quantities, then the factor known as the learning per cent would be 80% (100−20 = 80). High learning percentage means little improvement, no learning curve.
Scheffe’s test is a parametric multicomparison procedure, a method for adjusting significance levels in a linear regression analysis to account for multiple comparisons. It tests the hypotheses that the means of each pair of groups are equal.
Chi-square tests were used to analyse the correlations between sex and recurrences, and t-tests were performed to investigate the correlations between age and recurrences.
Results
Four hundred and eighty patient records were analysed and divided into the four groups: A, B, C and D (Table 1). The distribution of age and sex, the follow-up time and the number of patients after drop-outs were not significantly different between the groups.
| Groups | A | B | C | D |
|---|---|---|---|---|
| Female/male | 66/54 | 68/52 | 60/60 | 70/50 |
| Age | 48.6 (25–85) | 49.4 (26–97) | 47.2 (23–84) | 44.2 (23–74) |
| Follow-up (months) | 32 (6–96) | 20 (6–58) | 31 (6–107) | 38.4 (6–62) |
| Lost | 9 (7.5%) | 5 (4.2%) | 11 (9.2%) | 12 (10%) |
| Surgery time | 17.1 (10–29) | 13.1 (7–20) | 12.6 (5–23) | 12.8 (7–21) |
| Complications at 1 week and 6 months, respectively | 13 12 | 30; 13 | 24; 14 | 16; 10 |
| Recurrences | 10 (9.0%) | 8 (7.0%) | 6 (5.5%) | 5 (4.6%) |
| Recurrence at no. procedures | 4, 6, 10, 39, 47, 51, 82, 104, 107 | 17, 42, 47, 74, 77, 95, 101, 111 | 36, 45, 91, 103, 107, 108 | 77, 88, 104, 109, 120 |
| Recurrences at months | 4, 6, 6, 6, 6, 6, 6, 6, 6, 6 | 3, 5, 5, 6, 6, 6, 12, 16 | 3, 5, 6, 6, 9, 13 | 3, 5, 6, 6, 8, 9 |
| Reoperations | 2/10 (20%) | 2/8 (25%) | 1/6 (17%) | 1/5 (20%) |
| Transplant haematoma | 5 | 15 | 13 | 8 |
| Dellen | 2 | 8 | 4 | 6 |
| Shrunken transplant | 3 | 2 | 6 | 1 |
| Tenon prolaps | 2 | 0 | 0 | 0 |
| Partial transplant dehiscence | 1 | 0 | 0 | 0 |
| Pyogenous granuloma | 0 | 2 | 1 | 1 |
| Transplant loss | 0 | 2 | 0 | 0 |
| Keratitis | 0 | 1 | 0 | 0 |
| Remarks 6 months | ||||
| Painful eye | 0 | 1 | 0 | 0 |
| Dry eye complaints | 0 | 1 | 0 | 4 |
| Pyogenous granuloma | 0 | 1 | 0 | 0 |
| Conjunctival fibrosis | 2 | 4 | 10 | 4 |
| Recurrence | 10 | 6 | 4 | 2 |
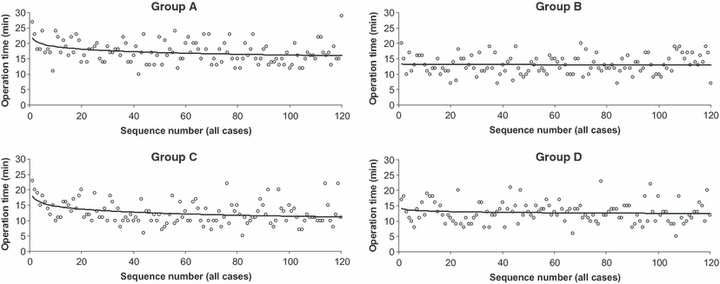
Logarithmic curve fitting to surgery time data showed a slow initial slope in group A and somewhat steeper in group C. There was no slope in groups B and D (Fig. 1).

Operation time data with logarithmic curve fitting. Weak learning curve effect in groups A and C.
Learning percentage according to Wright was A = 96%, B = 99%, C = 93% and D = 98%, when analysing surgery times.
Scheffé’s pairwise multiple comparison was made after splitting each group both into quarters and thirds. Significant differences showing a learning curve were found only in groups A (p = 0.042) and C (p = 0.006 and p = 0.018).
Statistical analysis of postoperative complications was not meaningful because of the uncertainty of data in this retrospective study.
Recurrence rates were 8.9% in group A, 6.8% in group B, 5.5% in group C and 4.6% in group D. Chi-square tests comparing each group with group D showed significant difference only for A (p = 0.035), while we found p = 0.17 for B and p = 0.53 for C.
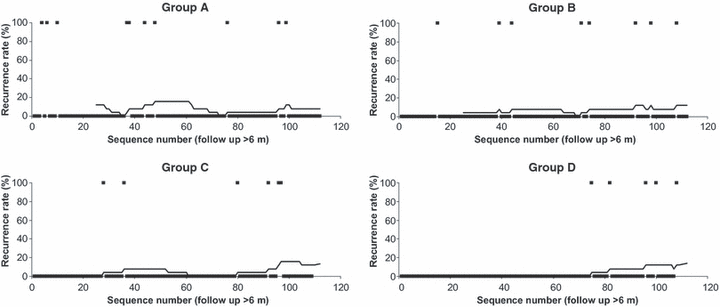
Moving averages (order 25) of recurrences (Fig. 2) were considered to show a learning curve if the averages decreased. No group showed a learning curve.

Moving averages (order 25) of recurrence rates. Dots at the 100% line indicate the recurrences. Decreasing trends suggesting a learning curve were not found. Long periods of zero recurrence rates were found.
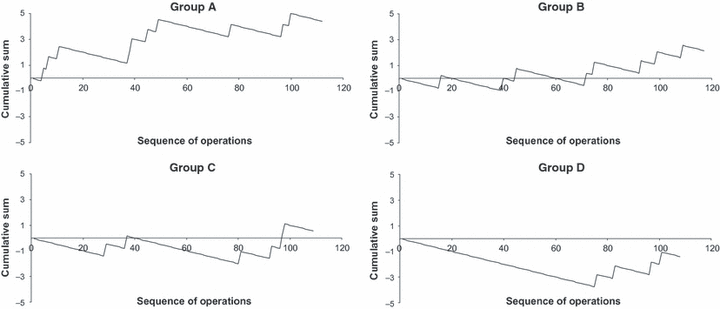
The true success rates were also presented as cumulative sum charts of recurrences at 90% proficiency. These curves were decreasing in all groups, indicating better success rates than 90% in all groups. When tested at 95% proficiency, the chart of group A increased only until operation no. 50, showing that the expected success rate had been achieved at that observation point. In group B, the curve was flat for more than 90 cases and increased slightly after that. For groups C and D, the curves were essentially flat (Fig. 3).

Cumulative sum charts of recurrences (at 95% proficiency). A learning curve effect may be detected only for the first 40–50 cases in group A.
Reoperation rates of the recurrences were low (17–25%), with no significant differences between the groups.
Discussion
Kenyon et al. (1985) documented a recurrence rate of 5.3% in their primary pterygium group operated with conjunctival autograft. Since then, numerous papers have been published on the success of conjunctival grafting, with varying success rates up to 39% (Lewallen 1989; Chen et al. 1995; Tan et al. 1997).
Conjunctival autografting has been considered difficult to master and time-consuming and was first advocated only for recurrent pterygia (Kenyon et al. 1985; Starck et al. 1991; Allan et al. 1993). Despite this, pterygium surgery is often seen as a trivial procedure and delegated to less experienced surgeons (Sebban & Hirst 1991; Ti et al. 2000; Hirst 2003; Farrah et al. 2006).
Some authors have tried to define the factors behind the variability in success rates. Lewallen states in her study (Lewallen 1989) that younger patients are more likely to develop recurrences. Tan et al. (1997) found that patients with fleshy pterygia experienced more recurrences and even developed a scoring system on this respect.
Few studies discuss the impact of the surgeon’s experience and a learning curve.
Sebban & Hirst (1991) reported the recurrence rate of 136 pterygia, operated on with a number of techniques by an unspecified number of surgeons with various educational degrees. One hundred and eleven cases were primary pterygia, and hence the number of cases for each surgeon may have been small, probably <25. Total recurrence rate was 46%, and that of primary pterygia was 42%. They believe that these results reflect the typical hospital experience in Australia in 1984–1988 and find it unsatisfactory. They requested new therapies to solve this problem.
Ti et al. (2000) compared the conjunctival autograft technique performed by trainees and more experienced ophthalmologists. One hundred and thirty-nine of the cases were primary pterygia, and 32 ophthalmologists were involved. The number of surgeries for each was necessarily rather small, and hence only 12 of these surgeons, who had at least eight surgeries, were included in the analysis of the recurrence rates. The authors found a great variation in success rate (5–82%) where the most experienced surgeons had the better results. In comparison with their earlier single surgeon study, with only a 2% recurrence rate (Tan et al. 1997), this result was unsatisfactory. They conclude that the variation in success rates may be because of the variation in skill and surgical technique, graft sizing and suturing being the most important issues. The authors suggest a learning curve effect. Also in this study, the number of cases for each surgeon was fewer than 25.
Farrah et al. (2006) who also compared the outcome of the conjunctival autograft surgery results between senior ophthalmologists and trainees also propose that the experience of the surgeon could influence success rates and complications. They state that there is a significant learning curve, indicating the need to supervise trainee surgeons. One hundred and seventy-four primary pterygia were treated by seven consultants and 15 trainees. Also in this study, the number of cases for the individual surgeon is quite small. The mean follow-up time was about 6 months. Recurrences in the experienced group were 6.7% (3/45) and 19.4% (25/129) in the trainee group. There were also more postoperative complications in the trainee group. The reasons for these differences are declared to be a learning curve owing to the difficulties in preparing the autograft, placing the sutures and the adequate clearance of the pterygium tissue from the sclera. They suggest better training and more supervision, possibly at the level of intraocular procedures.
These manuscripts present success rates of the pterygium surgery rather than a study of a learning curve. We did not find any reference to learning curve analysis in pterygium surgery. This concurs with the report of Ramsay et al. (2000) where only 6% of all reviewed published studies were judged to have formally assessed a learning curve.
Thus, our paper may be the first attempt at learning curve analysis in pterygium surgery.
In their more recent studies (Ramsay et al. 2001; Cook et al. 2004), the authors conclude that the statistical methods used for assessing learning effects in health technology have been crude and the reporting of studies poor. The most frequently used variables are the operation time along with the number of complications and failures. However, complications arise through a variety of factors and only some of them are under the control of the operator (Deusinger 1992). We used some of the available methods presented in their report but emphasize the need of further methodological research.
We do not see pterygium surgery as a trivial procedure and residents do not perform this surgery. Instead, ophthalmologists are trained in this task. The importance of the quality of the graft and the pterygium dissection is especially pointed out.
The statistical methods used were advocated in the literature. Logarithmic curves were found to give the best-fitting shape for operation time data (Ramsay et al. 2001). The initial slope of the operation time in group A suggests a learning curve. Surgeon A had no experience with the surgical microscope, while surgeon B was used to utilizing it in cataract surgery. The learning curve effect shown by the steeper slope in group C could be attributable to the fact that during this period GK was developing the new technique, instructing the scrub nurses and busy finding shortcuts.
Wright’s learning percentages have been used by the industry. These values are about 80–90% for manual work in the manufacturing industry. The values were very high, 93–99%, in our study. In group C, the 93% value could be explained by the trial-and-error type development of the Cut and Paste procedure.
We think that the differences in average operation time more mirror the personal character of a surgeon than the difficulty of the surgical method.
Scheffé’s multiple comparison is a method used to demonstrate significant differences between parts of a sample (Ramsay et al. 2001). In group A, we found that the length of the learning curve could be considered to be 40 cases. In group B, no learning curve effect could be demonstrated.
Recurrence rate levels were under 10%, which we consider being acceptable. Analysing moving averages, we found no significant declination in the number of the recurrences with increasing experience, which contradicts the existence of any learning curve in this aspect. We used moving averages of order 25, because studies often report samples of this magnitude (Sebban & Hirst 1991; Ti et al. 2000; Farrah et al. 2006). The large number of cases for each surgeon in our study allowed us to discover long periods with zero recurrence rate. The longest periods were 30 for A, 26 for B and 76 for GK, which clearly shows that recurrence rates from short case series are highly unreliable.
We expected to be able to demonstrate a correlation between age and recurrence according to Lewallen (1989), but we found no significance in any group or in all 480 cases.
Using cumulative charts, we found a learning curve effect in group A until case no. 50, which approximately coincides with the results from Scheffé’s multiple comparison.
The low reoperation rates were not suitable for statistical evaluation. Recurrences with the Cut and Paste method tend to be small and stable, as reported earlier (Koranyi et al. 2005).
There are factors that could not be assessed in this study. Changes in patient referral and selection could mean that the type of patient changes as the operator (or institution) performs more procedures. Including age and sex in the investigation, we found no significant differences between the groups, indicating that these parameters did not change over time. However, the size and appearance of the pterygia may have changed.
The exact prior experience and also the personal characteristics of the surgeons are important factors and certainly have an impact on the learning curve. However, these effects are very difficult to determine.
Our impression has been that performing more pterygium procedures the same day promoted the skills and confidence of both surgeons and nurses and shortened the surgery time.
The strength of our study consists of the adequate follow-up and small number of drop-out cases. We have also analysed a large number of pterygium surgeries for each surgeon, more than in earlier studies on learning effects in eye surgery (Sebban & Hirst 1991; Ti et al. 2000; Farrah et al. 2006). All surgeries were made in a similar fashion. The number of recurrences was not biased by operation of the other eye.
A limitation of a retrospective study is the variability in the notes on the patient charts. We believe that differences in the complication data found in the medical records depend on this variability. Another weakness is the absence of reports on the preoperative appearance of the pterygia, fleshiness and size. It would also be desirable to have a larger number of surgeons in such a study.
Conclusions
Many articles on using fibrin adhesive with conjunctival autograft in pterygium surgery have been published, and the method has been proved also by others to be safe and successful (Hall et al. 2009; Por & Tan 2010).
We think that reported success rates may be attributable to patient factors, surgeon factors and lesion characteristics. We also believe that surgeon’s general qualities and devotion affect surgery time, complications and recurrence rate more than the learning curve of the method.
We have shown that the Cut and Paste method has a very short learning curve. The Tenon-free dissection of the conjunctiva and the thorough excision of the pterygium tissue can be explained and taught. Suturing difficulties are no longer an issue.
There are some unique features in this study; already experienced ocular surgeons were involved because this surgery should not be left to inexperienced residents. The limited number of surgeons and the large number of cases per surgeon are also strengths, showing that if the surgery is not spread among too many hands, very good results can be achieved. There are, to our knowledge, no other papers on this matter. The previous publications were not accurate measures of the learning curve. The methods for evaluating the learning curve have been used in other fields. The statistics shown here contribute to a better understanding of learning curves.
It is important that trainees get adequate training and support from qualified consultants. Pterygium surgery is usually not urgent to execute. We suggest that pterygium surgery should be performed by ‘large volume surgeons’ and the surgery concentrated to sessions of 5–10 procedures. Reports on learning curves should be prospective and, if possible, standardized according to existing reports (Cook et al. 2004) and further research.


