NDRG2 gene expression in B16F10 melanoma cells restrains melanogenesis via inhibition of Mitf expression
Summary
NDRG2 (N-myc downstream-regulated gene 2) is a candidate tumor suppressor implicated in control of glioblastoma proliferation and dendritic cell differentiation. The microphthalmia-associated transcription factor (Mitf) plays a crucial role in the melanocyte lineage and in melanoma by controlling survival, differentiation, cell cycle entry and exit, and melanoma metastasis. Identifying upstream regulators of Mitf expression, therefore, remains a key issue. In this study, we aimed to assess whether the candidate tumor suppressor NDRG2 can modulate Mitf expression. Here, we show that NDRG2 acts to prevent cAMP and β-catenin-mediated activation of the Mitf promoter, thereby blocking melanogenesis via the downstream Mitf target genes Tyrosinase, Tyrp1 and Dct. The data suggest that NDRG2 impairs melanogenesis by interfering with both the TCF/β-catenin and cAMP/CREB pathways that are known to stimulate Mitf expression in melanocytes and have major implications for the role of NDRG2 in pigmentation and melanoma progression. Taken together, the results not only identify NDRG2 as a novel regulator of pigmentation, but also potentially a key factor in regulating melanoma progression via Mitf.
Significance
The NDRG2 gene is a candidate tumor suppressor and is weakly expressed in melanoma cells. How NDRG2 signals in melanoma and what are its downstream targets are unknown. In this report we show that NDRG2 regulates Mitf expression. As Mitf regulates melanoma cell proliferation, differentiation, survival and metastasis, the capacity of NDRG2 to regulate its expression reveals a potential mechanism by which NDRG2 may influence melanoma progression.
Introduction
Melanogenesis is a principal parameter of differentiation in melanocytes and melanoma cells (Hearing and Jimenez, 1989). In melanocytes and melanoma cells, melanogenesis can be stimulated by a large number of effectors, including ultraviolet B radiation (Friedmann and Gilchrest, 1987), cAMP-elevating agents (α-MSH, forskolin and IBMX; Busca and Ballotti, 2000; Thody and Graham, 1998), and glycyrrhizin (Abe et al., 1987; Lee et al., 2005). cAMP, which is able to activate protein kinase A (PKA) and cAMP-related element binding protein (CREB) transcription factor, promotes an increase in the expression of microphthalmia-associated transcription factor (Mitf), a melanocyte-specific transcription factor crucial for melanocyte development and differentiation (Bertolotto et al., 1998). Subsequently, Mitf strongly upregulates the expression of melanogenic enzymes such as Tyrosinase, tyrosinase-related protein 1 (Tyrp1), and tyrosinase-related protein 2 (Dct; Bertolotto et al., 1998; Yasumoto et al., 1997; Yavuzer et al., 1995).
Wnt, a group of secretory signaling molecules, evokes a signal to regulate melanocyte differentiation (Patapoutian and Reichardt, 2000). The binding of Wnt to its receptor Frizzled leads to the inactivation of glycogen synthase kinase-3β (GSK3β), followed by the accumulation of β-catenin and its translocation to the nucleus. T-cell factor (TCF)/lymphoid-enhancing factor-1 (LEF-1) transcription factors can bind the β-catenin and the complexes transactivate the target genes (Barker and Clevers, 2000; Cadigan and Nusse, 1997). A recent study has shown that direct gene transfer of Wnt or β-catenin mRNA to mouse neural crest cells results in melanocyte expansion and differentiation (Dunn et al., 2000). Additionally, it has been reported that exogenously added Wnt-3a protein to cultured murine melanocytes increased Mitf mRNA expression, and transactivated the melanocyte-specific Mitf-M promoter through the LEF-1 binding site (Takeda et al., 2000). These results suggest that the Wnt signaling pathway regulates the differentiation of melanocytes by activating the Mitf-M promoter.
NDRG2 (N-myc downstream-regulated gene 2) belongs to the NDRG family, a new family of differentiation-related genes composed of four identified members: NDRG1-NDRG4 (Zhou et al., 2001). Human NDRG members exhibit distinct patterns of expression during development. It has been shown that while NDRG1 is widely expressed, NDRG2 and NDRG3 are primarily expressed in the brain, heart, skeletal muscle, and kidney and NDRG4 expression is restricted to the brain and heart (Qu et al., 2002). The distinct expression patterns of the four members of the NDRG family suggest that they have their own specific functions in various tissues and organs. Previous data suggest that NDRG1 plays a pivotal role in cell growth arrest, cell differentiation, and tumor metastasis suppression (Kovacevic and Richardson, 2006; Piquemal et al., 1999; Ulrix et al., 1999). Most recently, NDRG2 has been implicated in dendritic cell differentiation (Choi et al., 2003), and inhibition of glioblastoma cell proliferation (Deng et al., 2003). Moreover, NDRG2 was identified as a candidate tumor suppressor gene as this gene was either expressed at low levels or not detected in clinically aggressive tumors and tumor cell lines (Deng et al., 2003; Lusis et al., 2005; Qu et al., 2002). However, the exact functional mechanism of NDRG2 gene remains to be elucidated.
In this study, we sought to determine whether NDRG2 is implicated in melanogenic differentiation of pigment cells. NDRG2 is known to be expressed to a moderate level in melanocytes (normal human melanocyte array at http://www.pigment.org/genearray.asp). In addition, we found that NDRG2 expression level was considerably high in normal epidermis, but its expression was significantly decreased by UVB irradiation (data not shown). Thus, we examined the involvement of NDRG2 in melanogenesis using well-characterized murine B16F10 melanoma cells which express NDRG2 mRNA and protein at a low level. Our results show that NDRG2 overexpression in B16F10 cells leads to a decrease in both melanin synthesis and the expression of the Tyrosinase gene family, including Tyrosinase, Tyrp1, and Dct. We also observed that NDRG2 was able to repress cAMP-induced melanogenesis through the inhibition of CREB phosphorylation and Mitf expression. In addition, TCF/β-catenin signaling, through which the Mitf-M promoter is activated, was impaired by overexpression of NDRG2. From these results, we demonstrate for the first time that the NDRG2 gene exerts a negative regulatory role on the melanogenesis, and the way how to increase the NDRG2 expression could be beneficial for the treatment of skin hyper-pigmentation such as melasma, freckles, and senile letigines.
Results and discussion
NDRG2 overexpression reduces melanin content and tyrosinase activity in B16F10 melanoma cells
As the first step towards examining the effect of NDRG2 on melanogenesis, pCMV-Taq2B (mock) or pCMV-Taq2B/NDRG2 plasmids were used to stably transfect B16F10 melanoma. As shown in Figure 1(A), B16F10-parental and B16F10-mock transfected cells expressed NDRG2 mRNA and protein at a low level, whereas NDRG2-transfected B16F10 cells showed a strong expression of NDRG2 mRNA and protein. B16F10-NDRG2 transfected cells displayed no significant difference in cell morphology (Figure 1B) and cell proliferation when compared with B16F10-parental or -mock transfected control cells (data not shown). However, as shown by the gross appearance, the pigmentation of cell pellets containing a known number of cells (2 × 10⁶ cells) was remarkably decreased in B16F10-NDRG2 transfected cells relative to B16F10-parental or -mock transfected cells (Figure 1C). Melanogenesis was assessed by determining the intracellular melanin content, and values are shown by relative percentage (Figure 1D). In a resting state, B16F10-parental or -mock transfected cells released a substantial amount of melanin during incubation. However, B16F10-NDRG2 cells exhibited approximately 50% inhibition in melanin content compared with B16F10-parental or -mock transfected cells. As melanin synthesis is primarily regulated by the Tyrosinase gene family, including Tyrosinase, Tyrp1, and Dct, mRNA levels for these genes was examined. As shown in Figure 2(A), B16F10-parental or -mock transfected cells showed a high level of Tyrosinase, Tyrp1, and Dct mRNA expression in accordance with melanin synthesis, whereas mRNA expression of these genes was substantially repressed in B16F10-NDRG2 cells. To investigate the inhibitory mechanism of melanogenesis by NDRG2 overexpression, l-DOPA oxidation was examined using cell lysates as an enzyme source of tyrosinase. As shown in Figure 2(B), a complete inhibition of l-DOPA oxidation was observed in B16F10-NDRG2 transfected cells. In addition, we also found in tyrosinase zymogram that while tyrosinase intensity was moderately detectable in the B16F10-parental and -mock transfected cells, its activity in the B16F10-NDRG2 transfected cells was markedly decreased (Figure 2C). Together, these data suggest that NDRG2 overexpression can negatively regulate melanogenesis by both inactivating tyrosinase and inhibiting the transcription of Tyrosinase, Tyrp1, and Dct genes.
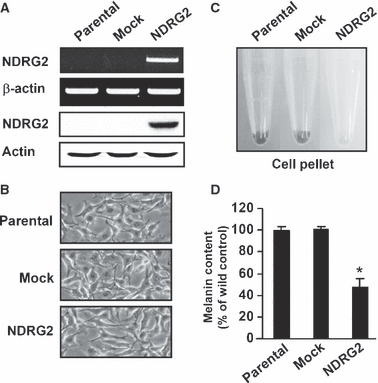
Effects of NDRG2 overexpression on melanin content. B16F10 cells stably transfected with empty vector or NDRG2 cDNA were maintained in DMEM supplemented with 10% FBS containing 1 mg/ml G418. (A) Expression level of NDRG2 mRNA and protein in B16F10-parental, -mock transfected, and -NDRG2 transfected cells were examined by RT-PCR (upper lanes) and Western blot (lower lanes) analysis, respectively. (B) Cell morphology was observed under a phase contrast microscope. (C) Appearance of B16F10-parental, -mock transfected, and -NDRG2 transfected cell pellet. A recognizable decrease in pigmentation was shown in cells overexpressing NDRG2. (D) After harvesting cells, melanin content was determined, and represented as percentage values. Each percentage value was calculated with respect to that of B16F10-parental cells. Data represent the mean ± SD of three different experiments carried out in duplicate.
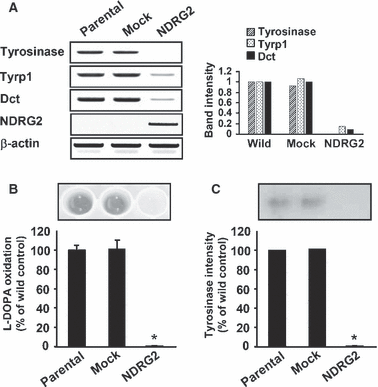
NDRG2 overexpression decreases tyrosinase activity and mRNA expression level of melanogenic enzymes in B16F10 melanoma cells. (A) mRNA expression of Tyrosinase, Tyrp1 and Dct in B16F10-parental, -mock transfected, and -NDRG2 transfected cells was measured by RT-PCR using specific primers. An inverted image was used to show PCR products better. Data are representative of three experiments with similar results. (B) Tyrosinase activity was determined by measuring the formation of dopachrome from l-DOPA as described in ‘Materials and methods’. Dopachrome formation was visible, and tyrosinase activity in B16F10-NDRG2 transfected cells was expressed as percentage reduction, relative to B16F10-parental cells. Values are presented as mean ± SD of three independent experiments. (C) NDRG2 decreases tyrosinase intensity in tyrosinase zymogram. Cell lysates were resolved on SDS-polyacrylamide gel by electrophoresis. The gels were then soaked in l-DOPA-containing buffer. One of three similar zymogram results was represented, and the relative band intensity was quantified using TINA 2.0 software. *P < 0.01 versus B16F10-parental or -mock cells.
NDRG2 overexpression inhibits cAMP-induced melanogenesis
It is well established that α-MSH induces melanocyte differentiation and melanogenesis by binding to the melanocortin 1 receptor (Mc1R), a member of the seven-pass transmembrane superfamily. Mc1R activation increases intracellular cAMP via Gαs-coupled activation of adenylate cyclase (Park and Gilchrest, 1999). Likewise, pharmacologic agents elevating intracellular cAMP, such as IBMX and forskolin, mimic α-MSH in promoting melanocyte differentiation and melanogenesis (Englaro et al., 1995; Hunt et al., 1994). To investigate the effect of NDRG2 expression on cAMP-induced melanogenesis in B16F10 melanoma, we treated B16F10-parental, -mock, and -NDRG2 transfected cells with α-MSH or IBMX, and then examined melanin content, tyrosinase activity, and transcript levels of Tyrosinase, Tyrp1, and Dct. In agreement with reports by others, α-MSH or IBMX treatment substantially increased melanin content in B16F10-parental or -mock transfected cells in a dose-dependent manner (Figure 3A). Melanin content was also increased by α-MSH or IBMX treatment in a time-dependent manner, reaching maximal levels at 72 h (data not shown). However, in B16F10-NDRG2 cells, the increase in melanin content after α-MSH or IBMX treatment was relatively very low. In accordance with melanin synthesis, l-DOPA oxidation and tyrosinase intensity were substantially increased by α-MSH or IBMX treatment in B1F10-parental or -mock transfected cells, but the increase was insignificant in the B16F10-NDRG2 transfected cells (Figure 3B and C). To further investigate whether inhibition of tyrosinse activity by NDRG2 overexpression occurred at the transcriptional level, Tyrosinase promoter activity was determined by transient transfection with pTyrosinase-Gluc construct comprising the murine Tyrosinase promoter fused to the Gaussia luciferase gene as the reporter. As shown in Figure 3(D), in B16F10-parental or -mock transfected cells, luciferase activity was increased up to 2.5-fold over the basal level by α-MSH or IBMX treatment. However, in B16F10-NDRG2 transfected cells, basal Tyrosinase luciferase activity was much lower than B16F10-parental or -mock transfected cells (approximately 20% of control cells). In addition, the increase of tyrosinase activity by α-MSH or IBMX treatment was not observed, indicating cellular Tyrosinase promoter is transcriptionally inhibited by NDRG2 overexpression. Next, we also found that transcript levels of Tyrosinase, Tyrp1, and Dct after treatment with α-MSH or IBMX were greatly repressed in B16F10-NDRG2 transfected cells compared with B16F10-parental or -mock transfected cells (Figure 4A). These results indicate that NDRG2 overexpression inhibits cAMP-induced melanogenesis through downregulation of key regulatory enzymes for melanogenesis.
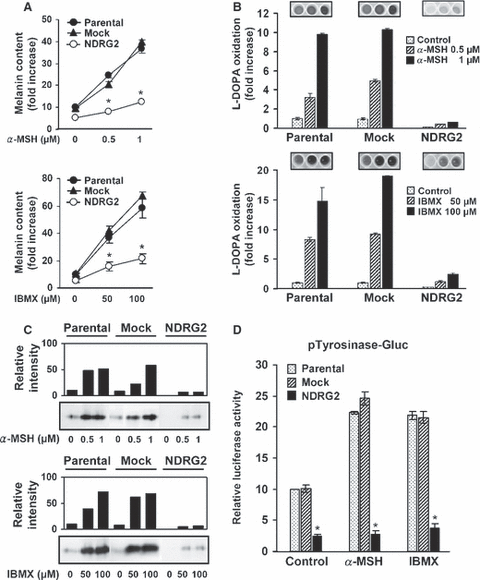
Inhibition of α-MSH or IBMX-induced melanogenesis and tyrosinase activation by NDRG2 overexpression. The cells were treated with the indicated concentration of α-MSH or IBMX for 48 h. (A) Increase of melanin content by treatment with α-MSH or IBMX was examined, and expressed in terms of fold increase when compared to unstimulated B16F10-parental cells. Data represent the mean ± SD of two different experiments. *P < 0.01 versus B16F10-parental or -mock transfected cells. (B) Tyrosinase activation by α-MSH or IBMX was determined by measuring the formation of dopachrome, and then expressed in terms of fold increase when compared to unstimulated B16F10-parental cells. Data represent the mean ± SD of two different experiments. (C) Tyrosinase intensity was also examined by tyrosinase zymogram, and relative band intensity was quantified. Data are representative of three experiments with similar results. (D) B16F10-parental, -mock transfected, and -NDRG2 transfected cells were transfected with both pTyrosinase-Gluc reporter, and β-galactosidase plasmid, and incubated for 18 h in the presence of α-MSH (1 μM) or IBMX (100 μM). Gaussia luciferase activities from culture supernatants were measured with a luminometer, and the intensity was calculated as relative values with respect to β-galactosidase activity. Results were confirmed by two independent transfections. The data are representative experiment carried out in duplicate, and expressed as the mean ± SD. *P < 0.01 versus B16F10-parental or -mock cells.
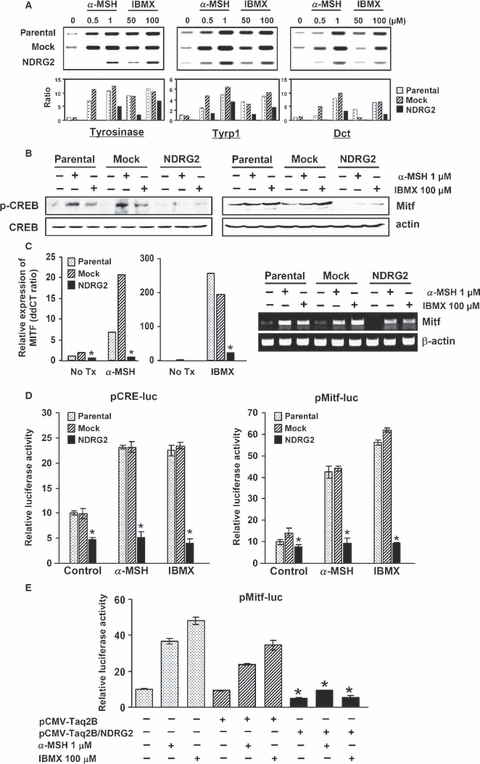
Inhibition of α-MSH or IBMX-induced enhancement of melanogenic enzyme expression, CREB phosphorylation, and Mitf production by NDRG2 overexpression. (A) The cells were treated with the indicated concentration of α-MSH or IBMX for 48 h. mRNA expression of Tyrosinase, Tyrp1 and Dct in B16F10-parental, -mock transfected, and -NDRG2 transfected cells was measured by RT-PCR using specific primers. Data are representative of three experiments with similar results, and the measured band intensity is presented as a histogram. (B) B16F10-parental, -mock transfected, and -NDRG2 transfected cells were stimulated with 1 μM α-MSH or 100 μM IBMX for 6–12 h, and lysates of the cells were subjected to Western blot analysis with anti-CREB, anti-phospho-CREB, or anti-Mitf antibody. Equal protein loadings were confirmed using anti-actin antibody. (C) The mRNA expression level of Mitf was also examined by RT-PCR (right). Quantitative mRNA expression measured by real-time PCR was also displayed by relative value (left). *P < 0.01 versus B16F10-parental or -mock transfected cells. (D) CRE and Mitf promoter activation was determined by luciferase reporter assay. B16F10-parental, -mock transfected, and -NDRG2 transfected cells were transfected with pCRE-luc, or pMitf-luc reporter, and incubated for 18 h in the presence of α-MSH (1 μM) or IBMX (100 μM). Luciferase activity was normalized to β-galactosidase activity. The data are representative experiment carried out in duplicate, and expressed as the mean ± SD. *P < 0.01 versus B16F10-parental or -mock transfected cells. (E) For co-transfection experiments, pMitf-luc reporter, β-galactosidase plasmid, and pCMV-Taq2B (or pCMV-Taq2B/NDRG2) were transfected in B16F10-parental cells for 4 h, and incubated further in the presence of α-MSH (1 μM) or IBMX (100 μM) for 20 h. The data show a representative experiment carried out in duplicate, and expressed as the mean ± SD. *P < 0.01 versus pCMV-Taq2B transfection.
NDRG2 overexpression decreases cAMP-induced CREB activation and Mitf expression
cAMP-induced melanogenesis has been reported to be mediated by the activation of the CREB. Once phosphorylated, CREB can upregulate Mitf, and Mitf subsequently binds and transcriptionally activates the Tyrosinase promoter (Bertolotto et al., 1998). As NDRG2 expression showed an inhibitory effect on tyrosinase activity, we examined whether NDRG2 overexpression can also affect cAMP-induced CREB phosphorylation and Mitf production. As shown in Figure 4(B), phosphorylated CREB was barely detectable in resting B16F10- transcriptional activation cells, but it was significantly increased upon exposure to α-MSH or IBMX. In contrast, phosphorylation of CREB was not increased in resting cells or in α-MSH or IBMX-treated B16F10-NDRG2 transfected cells. In accordance with these results, a remarkable increase in Mitf expression caused by α-MSH or IBMX treatment was observed in B16F10-parental or -mock transfected cells, but not in B16F10-NDRG2 transfected cells (Figure 4B and C). In the resting state, B16F10-parental or -mock transfected cells expressed a considerable level of Mitf mRNA and protein, whereas B16F10-NDRG2 transfected cells showing a low level of mRNA did not express Mitf protein. These results indicate that NDRG2 overexpression in B16F10 melanoma regulates events upstream of cAMP-induced melanogenesis.
NDRG2 overexpression inhibits cAMP-induced CRE and Mitf promoter activity
As described above, cAMP-elevating agents upregulate the activity of the Mitf promoter through activation of the CRE (cAMP response element)-binding transcription factor. Thus, we performed luciferase reporter assay for both CRE activity and the Mitf promoter in B16F10-parental, -mock transfected, and -NDRG2 transfected cells in a resting state and after treatment with α-MSH or IBMX. As shown in Figure 4(D), NDRG2 overexpression remarkably suppressed both CRE and Mitf luciferase reporter activity in a resting state as well as in a cAMP-stimulating condition. These findings suggest that NDRG2 overexpression may block melanogenesis through suppression of Mitf expression and promoter activity. Moreover, in cAMP-induced melanogenesis, NDRG2 overexpression functionally inhibited melanogenesis through inactivation of the CRE and Mitf promoter, eventually to suppress tyrosinase activity. To confirm the inhibitory effect of NDRG2 on Mitf promoter activity, a pCMV-Taq2B (or pCMV-Taq2B/NDRG2) expression vector was co-transfected with pMitf-luc reporter. As shown in Figure 4(E), transient expression of NDRG2 strongly inhibited Mitf luciferase reporter activity in a resting state as well as in a cAMP-stimulating condition.
NDRG2 overexpression inhibits cAMP-induced TCF/β-catenin signaling in B16F10 melanoma cells
As highly conserved Mitf consensus DNA binding elements exist in the promoters of the major pigment enzyme genes such as Tyrosinase, Tyrp1, and Dct, Mitf has strongly been suggested as a critical factor in pigment gene regulation (Goding, 2000). In particular, interaction of β-catenin with T cell transcription factor (TCF)/lymphoid enhancer factor (LEF) has been known to be implicated in the regulation of Mitf expression (Yasumoto et al., 2002). To gain insight into the mechanisms associated with inhibition of melanogenesis by NDRG2 overexpression, we examined whether NDRG2 can modulate TCF/β-catenin signaling. To this end, we used the TOPflash luciferase reporter assay that involves a luciferase reporter plasmid with three copies of the optimal TCF/LEF binding site upstream of the minimal thymidine kinase (TK) promoter. B16F10-parental or -mock transfected, and B16F10-NDRG2 transfected cells were transfected with TOPflash or FOPflash (harbors mutant TCF binding sites). As shown in Figure 5(A), B16F10-NDRG2 transfected cells in a resting state exhibited about half the level of TOPflash luciferase activity observed in B16F10-parental or -mock transfected control cells. FOPflash luciferase activity was detected at a very low level (<10% of TOPflash luciferase activity), and was not altered by NDRG2 overexpression (data not shown). After treatment with α-MSH or IBMX, TOPflash luciferase activity increased about 1.5- to 1.8-fold in B16F10-parental or -mock transfected cells. In contrast, the activity in B16F10-NDRG2 transfected cells did not increase significantly even after treatment with α-MSH or IBMX. For the induction of TCF/β-catenin signaling, β-catenin has to be stabilized by inhibition of GSK3β, followed by binding to TCF and translocation into the nucleus (Barker and Clevers, 2000; Cadigan and Nusse, 1997). Therefore, we examined the expression level of cytosolic and nuclear β-catenin, and phospho-GSK3β (Ser9, 46 kDa) by Western blot analysis. As shown in Figure 5(B), treatment with α-MSH or IBMX in B16F10-mock transfected cells resulted in a marked increase in GSK3β phosphorylation. In addition, the ratio of nuclear β-catenin/cytosolic β-catenin was remarkably increased in B16F10-mock transfected cells (Figure 5C). In the meantime, NDRG2 overexpression inhibited the increase of GSK3β phosphorylation and nuclear β-catenin by α-MSH or IBMX. These results suggest that TCF/β-catenin signaling is impaired in B16F10-NDRG2 transfected cells, and this may lead to a decrease in Mitf expression and consequently in tyrosinase activity. Previous studies have demonstrated that the PI3K inhibitor, LY294002, increases Mitf expression, leading to a stimulation of tyrosinase expression, and induction of melanogenesis (Khaled et al., 2003). In their previous report, it was also shown that forskolin decreases the phosphorylation of Akt as well as GSK3β, and activated GSK3β facilitates Mitf binding to the Tyrosinase promoter (Khaled et al., 2002). Additionally, forskolin did not affect the activity of a TOPflash reporter plasmid bearing LEF-1 binding site, and GSK3β activated by forskolin regulated neither Mitf promoter activity nor the intrinsic transcriptional activity of Mitf. In our present study, we also observed inhibition of Akt phosphorylation after treatment with α-MSH or IBMX, but did not observe a regulatory effect of NDRG2 overexpression (data not shown). Interestingly, treatment with α-MSH or IBMX resulted in the phosphorylation of GSK3β, and an increase in TOPflash luciferase activity although the extent of the increase was mild.
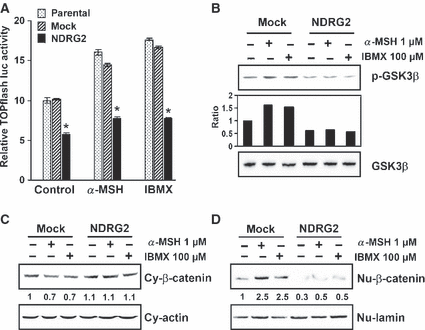
Inhibition of cAMP-induced TCF/β-catenin signaling through downregulation of GSK3β phosphorylation by NDRG2 overexpression. (A) B16F10-parental, -mock transfected, and -NDRG2 transfected cells were transfected with TOPflash luciferase reporter (or FOPflash), and β-galactosidase plasmid, and incubated for 24 h in the presence of α-MSH (1 μM) or IBMX (100 μM). Luciferase activities were measured with a luminometer, and the intensity was calculated as relative values with respect to β-galactosidase activity. The data are representative of three independent experiments carried out in triplicate, and expressed as the mean ± SD. *P < 0.01 versus B16F10-parental or -mock transfected cells. (B) B16F10-parental, -mock transfected, and -NDRG2 transfected cells were stimulated with 1 μM α-MSH or 100 μM IBMX for 6 h, and lysates of the cells were subjected to Western blot analysis with anti-GSK3β, or anti-phospho-GSK3β. (C) After treatment with 1 μM α-MSH or 100 μM IBMX for 6 h, cell lysates were fractionated into cytosolic (Cy) and nuclear (Nu) compartments for the assessment of β-catenin by Western blot analysis. Actin and lamin were used as controls for protein loading as well as marker proteins for the cytosolic and nuclear compartments, respectively. Results are from a single analysis, representative of two independent experiments.
NDRG2 overexpression suppresses TCF/β-catenin-mediated Mitf promoter activation in B16F10 melanoma cells
To confirm the defect in TCF/β-catenin signaling in B16F10-NDRG2 transfected cells, we examined TCF/β-catenin signaling in the presence of LiCl, as the treatment with LiCl is well-known to inhibit GSK3β and mimic Wnt signaling via stabilization of β-catenin (Hedgepeth et al., 1997). In a previous study, it was reported that lithium treatment stimulates pigmentation in embryonic zebrafish through the synthesis/deposition of melanin within the neural crest-derived melanophores (Jin and Thibaudeau, 1999). Moreover, it has been reported that exposure of B16F10 cells to LiCl results in a dose-dependent increase in the levels of differentiation-associated markers of melanoma cells such as melanin synthesis and tyrosinase activity (Kang et al., 2002). In our experiments, treatment with LiCl increased pigmentation of B16F10-mock transfected cells as shown by the gross appearance of cell pellets (Figure 6A) and l-DOPA oxidation was also increased by LiCl treatment in B16F10-mock transfected cells (Figure 6B). However, in B16F10-NDRG2 transfected cells, the increase in pigmentation of cell pellets and tyrosinase activity by LiCl was strongly suppressed. In B16F10-parental and -mock transfected cells, LiCl treatment activated TCF/β-catenin signaling approximately threefold, whereas TOPflash luciferase activity in B16F10-NDRG2 transfected cells after LiCl treatment was no >30% of control cells (Figure 6C). In addition, the increase in both GSK3β phosphorylation and the ratio of nuclear β-catenin/cytosolic β-catenin by LiCl treatment were obviously inhibited by NDRG2 overexpression (Figure 6D and E). To further demonstrate whether inhibition of TCF/β-catenin signaling by NDRG2 overexpression may influence Mitf promoter activity, followed by inhibition of tyrosinase activity, luciferase reporter assays for the Mitf and Tyrosinase promoters were performed after treatment with LiCl. In B16F10-mock transfected cells, Mitf promoter activity was increased about fourfold by LiCl, which is comparable to that of cAMP-elevating agents (Figure 7A). This suggests that both cAMP-signaling and TCF/β-catenin signaling are evenly critical for the activation of Mitf promoter in B16F10 melanoma cells. Moreover, in accordance with the results that GSK3β phosphorylation and nuclear translocation of β-catenin by LiCl treatment was dramatically inhibited by NDRG2 overexpression, substantial increase in the promoter activity of both Mitf and its downstream molecule, Tyrosinase, after treatment with LiCl was blocked in B16F10-NDRG2 transfected cells (Figure 7B). Taken together, these results indicate that NDRG2 overexpression renders B16F10 melanoma cells refractory in TCF/β-catenin signaling, one of the factors that control Mitf transcription. To further demonstrate whether down-regulation of NDRG2 expression could recover melanogenesis, B16F10-NDRG2 transfected cells were transiently transfected with NDRG2 siRNA or control siRNA. As shown in Figure 7(C), the level of NDRG2 mRNA was significantly reduced by NDRG2 siRNA transfection. Interestingly, a dramatic increase in both Mitf and Tyrosinase mRNA expression was indeed observed in NDRG2 siRNA-transfected cells, and the pigmentation of the cell pellet 5 days after siRNA transfection was changed to black similar to the B16F10-mock transfected cells. In addition, we observed that treatment with de-pigmenting agents, such as arbutin, EGCG and resveratrol increased NDRG2 expression in B16F10 melanoma cells (Figure 7D). As the expression of NDRG2 was augmented by treatment with these agents, tyrosinase activity was decreased approximately 30–45% as reported earlier (data not shown; Parvez et al., 2006). This gives support to our results that NDRG2 expression acts as a negative regulator of melanogenesis.
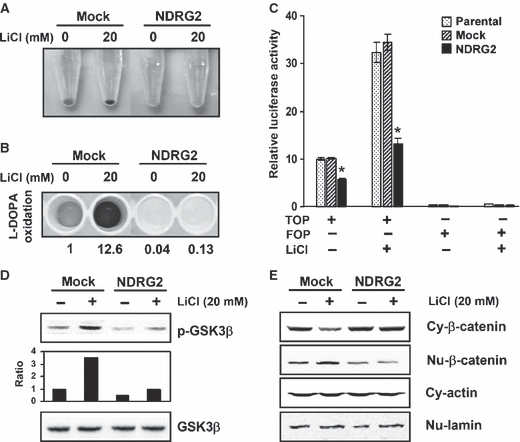
Inhibition of LiCl-induced TCF/β-catenin signaling by NDRG2 overexpression. B16F10-mock transfected and -NDRG2 transfected cells were stimulated with 20 mM LiCl for 72 h. (A) Appearance of B16F10-mock transfected and -NDRG2 transfected cell pellet. LiCl increased pigmentation in cell pellets from B16F10-mock transfected cells, whereas the increase of pigmentation in B16F10-NDRG2 transfected cells was not detected. (B) Tyrosinase activation by LiCl was determined by measuring the formation of dopachrome. (C) After transfection with TOPflash luciferase reporter (or FOPflash), and β-galactosidase plasmid, LiCl (20 mM) was treated for 18 h, and then luciferase activity was measured. The data are representative of three independent experiments carried out in triplicate, and expressed as the mean ± SD. *P < 0.01 versus B16F10-parental or -mock transfected cells. Total cell lysates (D) or cytosolic (Cy)/nuclear (Nu) cellular compartments (E) were prepared after treatment with LiCl (20 mM) for 12 h. Western blot analysis was subjected against GSK3β, phospho-GSK3β, and cytosolic/nuclear β-catenin. Data are representative of two independent experiments.
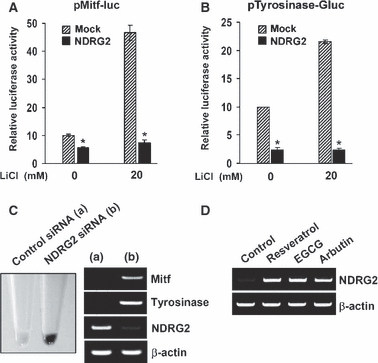
Inhibition of LiCl-induced Mitf promoter activity by NDRG2 overexpression. (A) After transfection with both pMitf-luc reporter and β-galactosidase plasmid, LiCl (20 mM) was treated for 18 h, and then luciferase activity was measured. The data are representative of two independent experiments carried out in duplicate, and expressed as the mean ± SD. *P < 0.01 versus B16F10-mock transfected cells. (B) Tyrosinase promoter activity was measured after transfection with both pTyrosinase-Gluc reporter and β-galactosidase plasmids. Gaussia luciferase activities from culture supernatants were measured with a luminometer, and the intensity was calculated as relative values with respect to β-galactosidase activity. The data are expressed as the mean ± SD. *P < 0.01 versus B16F10-mock transfected cells. (C) Control siRNA or NDRG2 siRNA was transfected in B16F10-NDRG2 transfected cells. After 2 days, mRNA level of NDRG2, Tyrosinase, and Mitf was determined by RT-PCR. (D) Arbutin (500 μM), EGCG (25 μM), or resveratrol (25 μM) was treated to B16F10 melanoma cells for 24 h, and the mRNA level of NDRG2 was examined by RT-PCR.
Collectively, the inhibition of the cAMP/CREB cascade as well as TCF/β-catenin signaling by NDRG2 overexpression acts cooperatively in the inhibition of Mitf expression and promoter activity, and eventually downregulates melanogenesis. At first, we expected that NDRG2 could act as positive regulator for melanogenesis as NDRG2 has been reported as differentiation related gene (Choi et al., 2003). However, as shown in these results, NDRG2 strongly inhibited TCF/β-catenin signaling, upstream of Mitf, and this resulted in the downregulation of melanogenesis. In addition to its role in differentiation pathways such as pigmentation, mounting evidences also suggest a crucial role of Mitf in the proliferation and/or survival of malignant melanocytes. It has been reported that β-catenin is a significant regulator of melanoma cell growth, with Mitf as a critical downstream target (Widlund et al., 2002). Loss of Mitf expression correlated inversely with overall survival and disease-free survival, suggesting that Mitf may be a new molecular prognostic marker in patients with melanoma (Salti et al., 2000), and Mitf was suggested as a marker of malignant melanoma (Vachtenheim and Borovansky, 2004). The retention of Mitf expression in the vast majority of human primary melanomas is consistent with this possibility (Chang and Folpe, 2001; King et al., 1999). Garraway et al. (2005) also reported that Mitf gene was amplified in some melanoma samples, particularly in metastatic disease and correlated with decreased patient survival, while Carreira et al. (2006) demonstrated that Mitf is required to suppress the expression of p27kip1 and that the more invasive cells expressing both low levels of Mitf and high levels of p27kip1 will be dividing slowly. Therefore, understanding Mitf regulation and function in malignant melanoma may be key for the development of effective melanoma therapy. In recent studies, it has been proposed that NDRG2 is a candidate of tumor suppressor gene because its expression is low level or not detected in various tumors and tumor cell lines (Deng et al., 2003; Lusis et al., 2005; Qu et al., 2002). Choi et al. (2007) reported that inactivation of NDRG2 in gastric cancer is involved in carcinogenesis and tumor progression, and this may be linked to resistance against anti-cancer drug or Fas-mediated apoptosis via downregulation of Fas expression. In addition, our group recently reported that NDRG2 overexpression in malignant breast cancer cells specifically inhibits Akt phosphorylation, and inhibits STAT3 activation via SOCS1 induction in a p38 MAPK dependent manner (Park et al., 2007). This implicates that NDRG2 acts as a growth inhibitory gene in signal transduction pathway in breast tumor cells. Based on our results, it is of interest to speculate that downregulation of Mitf via inhibition of TCF/β-catenin signaling by NDRG2 overexpression may play central roles in the progression of melanoma cells. Our ongoing investigation is focusing on the effect of NDRG2 overexpression on the metastatic potential of highly invasive tumor cells, and underlying action mechanism.
Materials and methods
Cell cultures
The murine B16F10 melanoma cell line was maintained as a monolayer culture in Dulbecco’s modified Eagle’s medium (DMEM; Gibco/Invitrogen, Carlsbad, CA, USA) supplemented with 10% (v/v) heat-inactivated fetal bovine serum (FBS; Gibco/Invitrogen), 100 U/ml of penicillin/100 μg/ml of streptomycin (Gibco/Invitrogen), at 37°C in a humidified 5% CO2 incubator.
Antibodies and chemicals
Alpha-melanocyte stimulating hormone (α-MSH), 3-isobutyl-1-methylxanthine (IBMX), synthetic melanin, mushroom tyrosinase, 3,4-dihydroxy--phenylalanine l-DOPA), and Arbutin were purchased from Sigma Chemical Co. (St Louis, MO, USA). (−)-Epigallocatechin-3-gallate (EGCG) and resveratrol were acquired from Calbiochem (La Jolla, CA, USA). Antibodies against phospho-CREB (Ser133), CREB, and phospho-GSK3α/β (Ser21/Ser9) were purchased from Cell Signaling Technology (Danvers, MA, USA). Anti-GSK3α/β and anti-Mitf antibodies were obtained from Upstate Biotechnology (Lake Placid, NY, USA) and Lab Vision Corp. (Premont, CA, USA), respectively. Anti-β-catenin and anti-lamin antibodies were purchased from BD Bioscience Pharmingen (Bedford, MA, USA). Anti-NDRG2 monoclonal antibody was generated by our laboratory (Choi et al., 2007).
Overexpression of NDRG2 gene in B16F10 melanoma cells
Murine NDRG2 cDNA was cloned into pCMV-Taq2B vector. B16F10 melanoma cells were transfected with the plasmid pCMV-Taq2B/NDRG2 by using a WelFect-EXTM PLUS Transfection Reagent (WelGENE, Daegu, South Korea). The stable transfectant clones were selected using complete medium containing 1 mg/ml neomycin (G418, Geniticin; Gibco/Invitrogen), and NDRG2 expression was confirmed by RT-PCR and Western blotting.
Measurement of melanin content
B16F10 melanoma cells were seeded at a density of 2.5 × 10⁵ cells/100 mm culture plate, and then incubated for 48–72 h. After harvest of cells (1 × 10⁷ cells per sample), total melanin content in the cell pellet was measured. Briefly, the pellets were dissolved in 1 N NaOH/10% DMSO for 1 h at 80°C, and solubilized melanin was measured by OD475. Melanin content was calculated from a standard curve using synthetic melanin.
Measurement of tyrosinase activity
For measurement of tyrosinase activity, the cells were washed with ice-cold PBS and then completely lysed with 1% Triton X-100 in PBS by freezing/thawing. The lysates were centrifuged (14 000 g × 20 min, 4°C) to obtain the supernatant as a source of tyrosinase. The reaction mixture containing 50 mM phosphate buffer (pH 6.8), 0.05%l-DOPA, and the supernatant (or mushroom tyrosinase) was incubated at 37°C. After incubation, dopachrome formation was assayed by measuring absorbance at 475 nm. Tyrosinase activity was calculated from that of standard mushroom tyrosinase. For tyrosinase zymogram, equal amount of the cell lysates was mixed with sample buffer without β-mercaptoethanol, and then immediately resolved on sodium-dodecyl-sulfate (SDS)-polyacrylamide gel by electrophoresis. The gels were then equilibrated in 100 mM sodium phosphate buffer (pH 6.8), and then soaked with 5 mM l-DOPA until colorimetric detection of tyrosinase (70–80 kDa).
RNA extraction and reverse transcription-polymerase chain reaction (RT-PCR)
Total RNA was extracted from the cells using TRIzol reagent (Invitrogen, Carlsbad, CA, USA) following the manufacturer’s instructions, and reverse transcribed to cDNA using M-MLV reverse transcriptase (Promega, Madison, WI, USA) and oligo(dT). cDNA aliquots corresponding to 5 μg RNA were analyzed by semi-quantitative PCR. The following primers were used for amplification: Tyrosinase, 5′-GGCCAGCTTTCAGGCAGAGGT-3′ and 5′-TGGTGCTTCATGGGCAATC-3, Tyrp1, 5′-GCTGCAGGAGCCTTCTTTCTC-3′ and 5′-AAGACGCTGCACTGCTGGTCT-3′, Dct, 5′-GGATGACCGTGAGCAATGGCC-3′ and 5′-CGGTTGTGACCAATGGGTGCC-3′, Mitf, 5′-TACAGTCACTACCAGGTGCAG-3′ and 5′-CCATCAAGCCCAAAATTTCTT-3′, NDRG2, 5′-GGATCCATGGCAGAACTTCAGGAG-3′ and 5′-CTCGAGTCAACAGGAGACTTCCAT-3′, and β-actin, 5′-CCACACCTTCTACAATGAGC-3′ and 5′-TGAGGTAGTCAGTCAGGTC-3′. PCR products were electrophoresed on 1% agarose gels containing ethidium bromide (EtBr). Quantitative real-time PCR for Mitf was performed using PalmTM-Cycler (Corbett Life Science, Sydney, NSW, Australia) with Platinum SYBR Green qPCR Super Mix-UDG (Invitrogen). For each sample, delta delta Threshold cycle (ddCT) values were calculated as the Ct of the Mitf gene minus the Ct of the β-actin gene.
Western blot analysis
For the preparation of whole cell lysates, cells were lysed on ice in M-PER Mammalian Protein Extraction Reagent (Pierce Biotechnology, Rockford, IL, USA) for 30 min. Supernatant fractions were recovered by centrifugation (14 000 g × 20 min, 4°C), and the protein concentration was determined using the BCA assay. Nuclear and cytoplasmic extracts were prepared using NE-PER Nuclear and Cytoplasmic Extraction Reagents (Pierce Biotechnology), according to manufacturer’s instructions. Total protein (20–50 μg) was separated by electrophoresis on 8% to 12% SDS-polyacrylamide gels, depending on the size of the target protein, and transferred to Hybond-ECL (Amersham Pharmacia Biotech, Piscataway, NJ, USA). Membranes were incubated with TTBS (25 mM Tris–HCl, pH 7.5, 150 mM NaCl, 0.05% Tween-20) containing 3% BSA for 1–2 h at room temperature to block nonspecific binding. Next, membranes were incubated with primary antibodies (1:1000 to 1:2500 dilutions), washed in TTBS, and incubated for 1 h with horseradish peroxidase-conjugated secondary antibodies (1:3000 dilutions) with 3% BSA in TTBS. Following washing of membranes in TTBS, proteins were visualized with an enhanced chemiluminescence system (ECL, Amersham Pharmacia Biotech) using a LAS 3000 imaging system (FUJIFILM Corporation, Tokyo, Japan). The band intensity was analyzed using TINA 2.0 software.
Luciferase reporter assay
TOPflash (or FOPflash) luciferase reporter plasmid was obtained from Upstate Biotechnology. pCRE-luc and pMitf-luc were kindly provided by Dr Jongsung Lee (Biospectrum Life Science Institute, Korea). To perform the luciferase reporter assay, semi-confluent cells grown in 12-well plates were transiently transfected with each luciferase reporter plasmid, and pCMV/β-Gal plasmid using Lipofectamine 2000 (Invitrogen, San Diego, CA, USA). pCMV/β-Gal was used to control the variability in transfection efficiency. After incubation for 18 h, cells were harvested in passive lysis buffer, and the luciferase activities were measured by luminescence microplate reader set (Perkin-Elmer VictorTM, Fremont, CA, USA) using the Luciferase assay system according to the manufacturer’s instructions (Promega). The β-galactosidase activities were measured using o-nitrophenyl β-galactopyranoside (ONPG) as a substrate. Luciferase activity was calculated relative to the β-galactosidase activity. Tyrosinase activity was examined using pTyrosinase-Gluc which was kindly provided by AMOREPACIFIC R&D Institute (Korea). Gaussia luciferase activity was determined from culture supernatants via Gaussia Luciferase Assay Kit (New England BioLabs, Ipswich, MA, USA).
Downregulation of NDRG2 gene expression by NDRG2 siRNA transfection
To knock down gene expression, NDRG2 siRNA (sc-40758) was purchased from Santa Cruz Biotechnology (Santa Cruz, CA, USA). Fluorescein-conjugated control siRNA (sc-36869) was used as negative control and indicator of transfection efficiency. Transfection of siRNA was performed following manufacturer’s instruction.
Statistical analysis
Results are presented as mean ± standard deviation (SD). All experiments were repeated at least three times, with documented reproducibility. Data were analyzed for statistical significance using the Student’s t-test. P-values of <0.05 were considered significant.
Acknowledgements
This work was financially supported by the Research Center for Women’s Diseases of the KOSEF (R11-2005-017-03001) and by the Sookmyung Women’s University Research Grants 2007.


