Heteroblastic Development and Shade-avoidance in Response to Blue and Red Light Signals in Acacia implexa
Abstract
Information from blue (400–500 nm) and red (660–730 nm) wavelengths is used by plants to determine proximity of neighbors or actual shading. Plants undergo trait changes in order to out-compete neighbors or accommodate shading. Heteroblasty, the dramatic shift from one leaf type to another during juvenility, can be influenced by the light environment although it is unknown whether cues from blue or red (or both) are driving the developmental process. Seedlings of three populations of Acacia implexa (Mimosaceae) collected from low, medium and high rainfall habitats were grown in a factorial design of high/low blue and red light to determine how light signals affect heteroblasty and patterns of biomass allocation. Low blue light significantly delayed heteroblasty in the low rainfall population and low red light significantly delayed in the low and high rainfall populations. Low blue light increased stem elongation and decreased root biomass whereas low red light induced a strong shade-avoidance response. These results were consistent across populations although the low rainfall population showed greater trait variability in response to red light signals. We conclude that red light conveys a greater information signal than blue light that affects heteroblasty and seedling development in A. implexa.
Introduction
A plant’s perception of the light environment is fundamental to growth and reproduction. Light not only determines the total amount of photosynthesis but acts as an information source in plant–plant signaling (1,2). Light signaling occurs across two major components of the spectral wavelength: blue (400–500 nm) and red (660–730 nm) light bandwidths. Leaves preferentially absorb blue and red light (3) and the decrease in these wavelengths relative to other wavelengths acts as an indicator of the presence of neighbor plants, including shading (1,2,4,5). Low levels of blue and red light induce a series of trait changes that accommodates the light environment and directs development toward higher quality light.
Photomorphogenesis defines changes in plant traits caused by the light environment (6). Under shaded environments typical changes in traits include a decrease in root allocation, an increase in stem allocation, elongation of the stem and internodes, an increase in leaf area but a decrease in leaf mass (e.g.7–11). These trait changes direct the growing individual above or away from the source of shade and into a full sunlight environment. Not all plants express such trait changes and many species can tolerate extremely low levels of light (2). Photomorphogenesis is more common in shade-avoiding species, those species requiring relatively high light levels in order to maintain optimal functioning.
The overwhelming number of studies on photomorphogenesis and shade-avoidance has occurred by manipulating red light (660–670 nm) relative to far red light (720–730 nm) while less attention has been directed toward blue light (12). The ratio of red:far-red light is detected by phytochrome molecules and is known to have a significant influence on plant development and shade-avoidance (1,13–15). Blue light is detected by cryptochrome and phototropin molecules and has been suggested to cause redox reactions in the photosynthetic system and stem orientation during seedling development (16,17). Recently, there has been an increasing appreciation that phototropins act as a more general photoreceptor that can induce responses such as reorientation of root growth (12,18) and chloroplast and stomatal development in the leaf (19,20). Therefore, blue light may have a more general role in photomorphogenesis and the shade-avoidance syndrome.
Heteroblastic development is a trait in a number of plant species that can be influenced by the light environment. Heteroblasty is a life-history event where plants switch from highly distinct juvenile to adult foliage (21, cited in 22). Heteroblasty occurs in a number of plant taxa including in the genus Acacia subgenus Phyllodineae (23). The progression from juvenile to adult leaves in Acacia typically commences with a double compound leaf, followed by a transitional leaf consisting of a flattened petiole/rachis (called a phyllode) with double compound leaf attached to the adult leaf which lacks a compound leaf component and solely consists of the phyllode (24,25). Compound leaves developed for longer periods of time in plants growing under closed canopies (26) and heteroblasty was experimentally delayed under low irradiance in the species A. implexa (25). Compound leaves have larger photosynthetic capture area than phyllodes and have greater rates of photosynthesis under lower irradiance (27). Therefore, the delay in heteroblastic development and retention of compound leaves conveys a possible growth advantage to a developing Acacia seedling in an adverse light environment. Despite the interest in the effects of light on Acacia morphology and physiology, little is known about the specific role that blue or red light may play as an information signal.
Populations of Acacia species from regions differing in mean annual rainfall develop different phenotypes when grown in a common environment (28–31). Phenotypic variability could be due to adaptations to the climate (rainfall) experienced by different populations. However, it is possible that the light environment is fundamentally important in the evolution of growth forms in these trees. Vegetation cover and cloud cover decline with decreasing rainfall and irradiance levels increase. Moreover, Acacia species tend to dominate the canopy in low rainfall regions and the subcanopy or understorey in higher rainfall regions (32). Therefore, populations within a species subjected to a strong rainfall gradient should expect to have adaptations to the concurrent light gradient. Whether there is a genetic capacity to respond to contrasting blue and red light signals (or both) in Acacia has yet to be explored.
In this study we performed a full-factorial experiment of high and low blue and red light to determine the timing of heteroblastic development across populations of the species A. implexa. We predict that heteroblastic development will be delayed under low blue and/or red light and this pattern will be consistent across populations. A second objective was to explore patterns of photomorphogenesis under varying light environments. Strong photomorphogenic responses in the shade-avoiding A. implexa are expected to be observed under low red light and the same developmental pattern may also occur under low blue light. Our final objective was to assess whether photomorphogenesis in response to blue and red light environments altered relative growth rates in A. implexa.
Materials and methods
Acacia implexa is a tree growing to approximately 12 m that inhabits woodlands and forests of eastern Australia (33,34). Seeds were collected from three populations representing a rainfall gradient from 830 mm p.a. to 450 mm p.a. (Table 1A). We chose these populations because a previous study found heteroblastic development to be hastened along a rainfall gradient in the closely related A. melanoxylon (28). Seeds were obtained from the CSIRO Australian Tree Seed Centre, Canberra, Australia.
| (A) | ||||
|---|---|---|---|---|
| Population | Seedlot | Location | Rainfall (mm p.a.) | Avg. temp. (°C) |
| Low rainfall | 19780 | 35°57′S, 145°45′E | 450 | 23 |
| Medium rainfall | 19770 | 32°37′S, 150°03′E | 650 | 23 |
| High rainfall | 18859 | 31°56′S, 151°11′E | 830 | 24 |
| (B) | ||||||
|---|---|---|---|---|---|---|
| Filter (product code) | PAR | 400–500 nm | 665 nm | 730 nm | Blue light | Red light |
| 0.3 ND (209) | 60 | 50 | 45 | 85 | High | High |
| Lime Green (088) | 60 | 0 | 45 | 85 | Low | High |
| 0.6 ND (210) | 33 | 25 | 20 | 75 | High | Low |
| 0.3 ND + lime (209 + 088) | 10 | 0 | 20 | 75 | Low | Low |
- Values are percent transmission of light at the specified wavelength. PAR = percent of midday photosynthetically active radiation between 400 and 800 nm on a clear day. Filters were obtained from Lee Filters (Andover, UK).
We applied a full-factorial design with three factors: 3 × population (collected from high, medium and low rainfall regions), 2 × blue light (high and low) and 2 × red light (high and low). Blue and red light were reduced using filter plastic placed around growing plants. Plastic filters were obtained from Lee Filters (Andover, UK). Table 1B outlines the percentage transmission of blue, red and far-red light allowed by the various filter plastics. Table 1B additionally outlines percent photosynthetically active radiation (PAR: 400–800 nm) of midday levels on a clear day that the filters transmitted. Percentage transmission of light in the blue, red and far-red regions was originally assessed through factory specifications provided by Lee Filters. We then checked these specifications using a PP-Systems UniSpec-DC Spectral Analysis System. PAR levels were checked using a Li-Cor 190 Quantum Sensor. We note that the neutral density plastic is not spectrally neutral and the experiment could have been technically improved with an alternative filter. However, the neutral density filters were chosen in this experiment in order to achieve a relative decrease in irradiance in the red light region compared with far-red light. Plants were grown at the University of New South Wales, School of Biological, Earth and Environmental Sciences glasshouse in Sydney, Australia. Humidity in the glasshouse was kept constant and temperatures ranged between 19 and 26°C. Plants were grown in a blocked design and were kept well spaced on glasshouse benches.
Plants were grown in 115 mL pots consisting of uniform soils. Soil consisted of 33% Australian Native Landscape supply of “Organic Garden Mix,” 33% washed river sand and 33% cocopeat. A 4 month Osmocote low phosphorus slow release fertilizer was added with the N:P:K ratio of 17:1.5:8.5. No additional fertilizer was added throughout the experiment due to this species sensitivity to excess nutrients and the fact the experiment ran within the release time of the fertilizer. All soil, pots and any other equipment used in the experiment were sterilized to prevent infection of roots of symbiotic rhizobium (which fix atmospheric nitrogen thus improving fertility and growth of plants). Plants were kept well watered at all times.
Acacia implexa germinates following heat from fire, therefore we immersed seeds in boiling water for 2 min to simulate this heat. Six seeds were then sown directly into potted soil and were later thinned to one plant per pot. Previous attempts at growing this species found high amounts and uniform germination using this technique (M. Forster, personal observation).
Plant height (the length of the stem) was recorded from all plants at the start of the experiment. A subset of 20 plants per population was harvested at this point and stem length was measured. This subset of plants was then oven dried at 60°C for at least 7 days and biomass was recorded. Regression of biomass on stem length gave initial biomass necessary for growth rate calculations (log initial biomass = −3.03 + [0.859 × log initial stem height]; R2 = 0.31, P =0.01). Plants were checked after 20 days of growth for signs of transitional leaf development. Plants that had at least one fully developed transitional leaf were harvested. Thereafter, plants were checked regularly and after 75 days all plants were harvested. At the time of harvest the following traits were measured: stem length, diameter at base of plant, total number of nodes, node of first transitional leaf, number of leaves and number of transitional leaves. At the time of harvest no plants had developed a phyllode leaf type. Leaves and petioles were removed from the stem and flattened (to prevent pinnules from folding inward) for area measurements. Roots were cut from the stem and soil was carefully removed over a plastic container in order to capture all root material. All plant material was oven dried at 60°C for at least 7 days before biomass was recorded. The area of compound and transitional leaves were taken separately on a flatbed scanner (Epson Stylus, CX4900) and using LeafA software (G. Williamson, personal communication). The mass of the different leaf types was also made separately.
 (1)
(1) (2)
(2)All traits are listed in Table 2.
| Trait | Abbrev. | Definition | Trans. |
|---|---|---|---|
| Whole-plant traits | |||
| Height to diameter (mm mm−2) | HtoD | Stem length divided by basal stem diameter | |
| Internode length (mm) | Internode | Stem length divided by the total number of nodes | |
| Root mass ratio (g g−1) | RMR | Total dry root weight divided by the sum of stem and leaf weight | log |
| Stem mass ratio (g g−1) | StMR | Total dry stem weight divided by the sum of leaf and root weight | log |
| Leaf mass ratio (g g−1) | LMR | Total dry leaf weight divided by the sum of stem and root weight | log |
| Leaf area ratio (cm2 g−1) | LAR | Ratio of total leaf area to total biomass | |
| Net assimilation rate (g cm−2 day−1) | NAR | The amount of carbon fixed per day for a given amount of photosynthetic tissue | log |
| Specific leaf area (cm2 g−1) | SLA | Ratio of leaf area to leaf mass | |
| Relative growth rate (g g−1 day−1) | RGR | Amount of biomass fixed per day | |
Statistical analyses. To test the hypothesis that the shift from compound leaves to transitional leaves will occur at an earlier node under low quantity and/or quality light environment a Type III univariate ANOVA was performed with population, light quantity and light quality as fixed factors and the node number of the first transitional leaf as the dependent variable. This same ANOVA model was performed on relative growth rate.
Photomorphogenesis was assessed using multivariate analysis of variance on the same ANOVA design. Data were checked for normality using Shapiro–Wilk test and log transformed where appropriate (details of transformations are shown in Table 1). Following transformations all data were standardized to a mean of zero and standard deviation of 1 as traits were measured on different scales and standardization overcomes bias that may arise from this (36). Homogeneity of variance in MANOVA was checked with Levene’s test of equality and outliers checked with Mahalanobis distances. Additionally we chose to use Pillai’s trace as a test statistic as this measure is relatively robust to the assumptions of MANOVA (36). Multivariate sets of covarying traits were further characterized using discriminant function analysis (DFA). DFA is a classification procedure that can be applied on factorial multivariate data sets to assess whether groups can be uniquely separated (36). In this study we were interested in whether the factorial treatment combinations of blue and red light could be classified into unique groups or whether there were overlaps in groups. We were separately interested in population effects, therefore an additional DFA was run on the three populations. Means with 95% confidence intervals of experimental treatments were plotted against the first and second discriminant functions using procedures outlined in Johnson et al. (37). Lastly, univariate ANOVAs were performed on all plant traits to individually assess mean differences and Student–Newman–Keuls (S–N–K) post hoc analysis was performed where appropriate. Sequential Bonferroni correction was applied in order to overcome bias associated with running a large number of statistical tests (38). All statistical analyses were performed using SPSS 15.0.1.
Results
Heteroblastic development was significantly delayed under the red light treatment, and there was no difference in the blue light treatment (Table 3, Fig. 1A). There was also a significant population effect (Table 3, Fig. 1A) and a significant population with blue light and population with red light effect (Table 3). Low blue light and low red light significantly delayed heteroblastic development in the low rainfall population and low red light delayed development in the high rainfall population; however, light had no effect on the medium rainfall population (Fig. 1B,C).
| d.f. | MSS | F-value | P-value | |
|---|---|---|---|---|
| Population | 2 | 14.551 | 8.269 | 0.0004 |
| Blue light | 1 | 1.629 | 0.926 | 0.3376 |
| Red light | 1 | 38.848 | 22.077 | <0.0001 |
| Population × blue light | 2 | 7.561 | 4.297 | 0.0154 |
| Population × red light | 2 | 11.749 | 6.677 | 0.0017 |
| Blue × red | 1 | 4.063 | 2.309 | 0.1309 |
| Population × blue × red | 2 | 1.854 | 1.054 | 0.3514 |
| Error | 140 | 1.760 | ||
| Total | 152 |
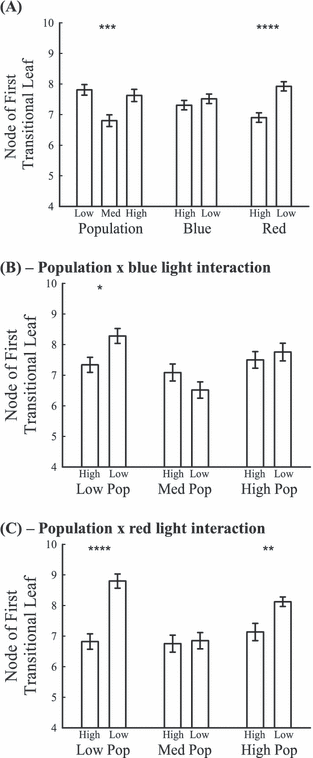
Node of first transitional leaf represents the onset of heteroblasty. Displayed are means (±SE). *P < 0.05; **P < 0.01; ***P < 0.001; ****P < 0.0001. Complete statistical results are presented in Table 3. (A) Population, blue and red light treatments; (B) interaction of the population with blue light treatment; and (C) the interaction of the population with red light treatment.
Acacia implexa displayed patterns of shade-avoidance under both low blue and red light with a more pronounced phenotypic response to red light (MANOVA, Table 4A). There was also a significant population and a population with red light effect; however, there was no significant effect in the population with blue light treatment (Table 4A). Additionally, a significant three-way effect between population, blue and red light was observed (Table 4A).
| (A) MANOVA | |||
|---|---|---|---|
| Pillai’s trace | F-value | P-value | |
| Population | 0.690 | 8.299 | <0.0001 |
| Blue light | 0.204 | 3.999 | 0.0003 |
| Red light | 0.380 | 9.593 | <0.0001 |
| Pop × blue light | 0.092 | 0.762 | 0.7281 |
| Pop × red light | 0.226 | 2.007 | 0.0133 |
| Blue × red | 0.246 | 5.106 | <0.0001 |
| Pop × blue × red | 0.219 | 1.934 | 0.0181 |
| (B) ANOVA | |||||||
|---|---|---|---|---|---|---|---|
| Trait | Population (2) | Blue light (1) | Red light (1) | Pop × blue (2) | Pop × red (2) | Blue × red (1) | Pop × blue × red (2) |
| HtoD | 33.030**** | 15.276*** | 13.594*** | 0.913 | 4.703** | 4.123* | 3.465* |
| Internode | 26.437**** | 4.026* | 11.195** | 0.516 | 2.913 | 1.583 | 1.434 |
| RMR | 1.906 | 11.965*** | 21.793**** | 1.476 | 3.730* | 2.213 | 0.776 |
| StMR | 24.847**** | 1.643 | 12.971*** | 1.123 | 3.662* | 0.683 | 1.069 |
| LAR | 3.464* | 0.460 | 35.342**** | 1.048 | 3.603* | 0.016 | 0.453 |
| LMR | 9.980**** | 3.874 | 2.403 | 0.058 | 2.546 | 0.001 | 0.403 |
| SLA | 11.651**** | 0.107 | 33.576**** | 1.374 | 4.646* | 0.130 | 0.289 |
| NAR | 1.415 | 0.861 | 51.802**** | 1.311 | 0.277 | 11.547*** | 3.318* |
- Abbreviations as in Table 2. *P < 0.05; **P < 0.01; ***P < 0.001; ****P < 0.0001.
A shade-avoidance syndrome was most apparent in the low red light treatment. By contrast, only stem elongation and lower root biomass allocation were evident in the low blue light treatment (Table 4B, Fig. 2). Low red light elongated the stem and increased biomass allocation to the stem and away from roots (Table 4B, Fig. 2). There was no significant difference in leaf mass allocation under low red; however, leaf area was significantly increased as indicated by an increase in leaf area ratio (LAR) and SLA (Table 4B, Fig. 2). NAR was significantly lower in the low red light treatment (Table 4B, Fig. 2). Across populations there was an elongation of the stem and an increase in biomass allocation to the stem from the low rainfall to the high rainfall population (Table 4B, Fig. 2). There was also a significant increase in LAR and SLA; however, LMR significantly decreased across the rainfall gradient (Table 4B, Fig. 2). In the population with red light treatment interaction, the low rainfall population was most sensitive to decreased red light (Fig. 3). This pattern was particularly evident in the traits height to diameter (HtoD), stem mass ratio (StMR), LAR and SLA.
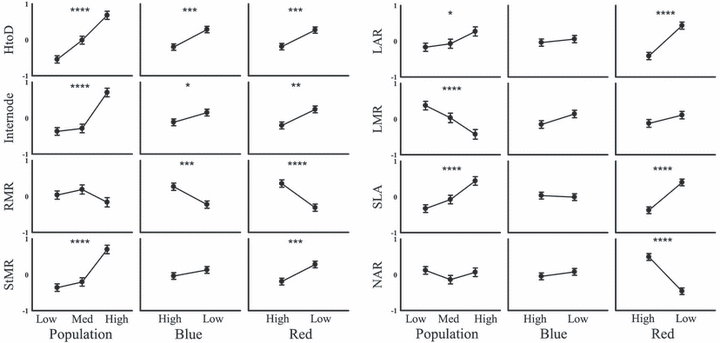
Means (±SE) of whole-plant traits within the population, blue light and red light experimental treatments. *P < 0.05; **P < 0.01; ***P < 0.001; ****P < 0.0001. All traits have had units of measurement standardized to a mean of zero and standard deviation of 1.
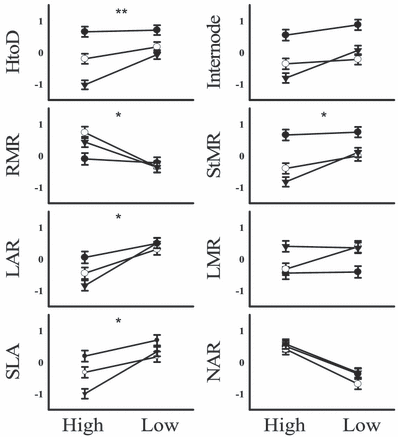
Means (±SE) of whole-plant traits within the population with red light interaction treatment. *P < 0.05; **P < 0.01. High and Low correspond to red light treatment. • High rainfall populations; ○ medium rainfall population; and low rainfall population. All traits have had units of measurement standardized to a mean of zero and standard deviation of 1.
Discriminant function analysis of the blue and red light treatments explained 93.6% of the variance across the first two discriminant functions. The high red light treatment was positively associated with the first discriminant function and the low red light treatment was negatively associated (Fig. 4A). The blue light treatment could be reliably separated into groups within the low red light treatment; however, 95% confidence intervals overlapped in the high red light treatment (Fig. 4A). A biplot of the traits revealed root mass ratio (RMR) and NAR to be associated with the high red light treatment and the stem and leaf traits to be associated with the low red light treatment (Fig. 4B). We also performed a DFA on the population with red light treatment interaction due to these factors having a significant effect following MANOVA (Table 4A). The first two discriminant functions explained 76.3% of the variance with the high red light treatment being positively associated with the first discriminant function (Fig. 4C). The red light treatment could reliably be separated within populations as there was no overlap in 95% confidence intervals (Fig. 4C). However, low red light with medium rainfall population interaction could not be separated from the high red light with high rainfall population interaction (Fig. 4C) meaning that these two groups had similar multivariate distribution of traits. RMR and NAR were positively associated with the first discriminant function and all other traits were negatively associated (Fig. 4D). Therefore, the low rainfall population and high red light treatment could be discriminated by larger root mass and higher assimilation rates. Conversely, the high and medium rainfall populations and low red treatment could be discriminated by greater biomass allocation to stem traits (StMR, HtoD, Internode) and leaf area (SLA, LAR).
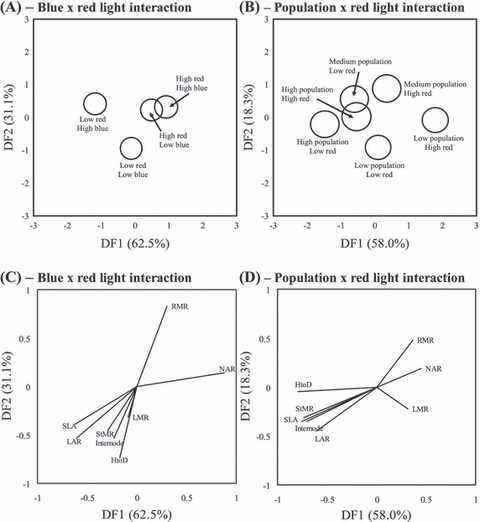
Grouping of population, blue and red light treatments following discriminant function analysis. Displayed are group centroids with circles indicating 95% confidence intervals (overlapping circles indicate no difference between groups). Variance explained by first and second discriminant functions displayed parenthetically. (A) Blue with red light treatment interaction. (B) Population with red light treatment interaction. (C, D) Factor loadings of measured traits corresponding to discriminant function analysis of treatments across first and second discriminant functions. HtoD = height to diameter ratio; StMR = stem mass ratio; RMR = root mass ratio; NAR = net assimilation rate; SLA = specific leaf area; LMR = leaf mass ratio; LAR = leaf area ratio.
There was a highly significant difference in RGR in the blue and red light treatments with RGR being greater under high red light and the low blue light treatments (blue: F1,152 = 15.361, P = 0.0001; red: F1,152 = 14.989, P = 0.0002; Fig. 5). There was also a significant blue with red light interaction effect on RGR with the high blue light with low red light treatment having a much slower growth rate than the other treatment groups (F1,152 = 22.356, P < 0.0001; Fig. 6). The slow growth rate in this treatment could be attributed to the medium rainfall population which showed the slowest growth rate of all populations and treatments in the high blue/low red treatment (Fig. 6). We also note that there was a significant three-way population, blue and red light treatment interaction effect (F2,152 = 3.453, P = 0.0344; Fig. 6).
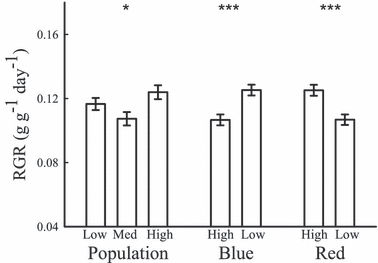
Mean (±SE) of relative growth rate (RGR) across experimental treatments. *P < 0.05; ***P < 0.001.
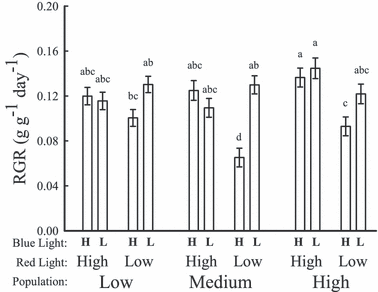
Mean (±SE) of relative growth rate (RGR) across the full factorial combination of population by blue and red light treatments. H = high; L = low. Letters indicate groupings following Student–Newman–Keuls post hoc analysis.
Discussion
Species response to contrasting light environments
Photomorphogenesis in A. implexa is largely driven by information obtained from the red:far-red wavelength with the blue wavelength having a minor effect. Under the low red:far-red treatment A. implexa displayed a classical shade-avoidance syndrome of thinner and longer stems (i.e. increased HtoD and longer internodes), greater biomass allocation to stems and less to roots, larger photosynthetic capture area (i.e. increased LAR and SLA) and lower assimilation rates (3, 4). The low blue treatment only had a significant effect on stem elongation and root biomass allocation. However, the most novel finding of this experiment is heteroblastic development can also be classified as a shade-avoiding syndrome with low red:far-red significantly delaying the onset of transitional leaves (Fig. 1).
The pattern of trait responses observed in this experiment strongly suggests photoreceptors in the red light region are driving juvenile development in A. implexa. Phytochromes are the principal photoreceptors for red and far-red light and are widely known to control the expression of shade-avoidance phenotypes (1,2,13–15). It was therefore highly predictable that A. implexa, a shade-intolerant, pioneer-colonizing species of high irradiance habitats, should express the classic traits of shade-avoidance (3, 4). On the other hand, phototropins detect changes in blue light and low blue light signals to the plant to undergo stem elongation (or stem bending) toward better quality light (phototropism, [2,17]). High blue light signals detected by phototropins are known to cause an increase in root growth (12,18). In this experiment we observed a significant increase in stem elongation (higher HtoD and Internode; Fig. 2) under low blue light and a significant increase in root biomass allocation under high blue light. Overall, plant traits were much more responsive to alterations in red light wavelength.
In this experiment blue and red regions of the light spectrum were manipulated; however, PAR was not explicitly controlled. This is in contrast to many previous experiments that tend to maintain constant levels of PAR and elevate far-red light using specialized lamps (7). In this experiment plants in the high red light treatment also had higher levels of PAR (Table 1B). Therefore, many of the treatment affects attributed to red light cannot be completely divorced from possible mutually inclusive effects PAR levels have on plants. Light quality (i.e. low red:far-red ratio) tends to induce traits associated with shade-avoidance whereas light quantity (i.e. low PAR) induces shade tolerance traits (7). These traits typically include leaf physiological adjustments, such as lower light compensation points and chlorophyll contents, rather than morphological adjustments, such as increased stem elongation (39). Concordantly, low PAR negatively affects photosynthetic rates which, in turn, negatively affect RGR. In this experiment RGR was significantly lower in the low red treatment (Fig. 5) suggesting PAR levels may have influenced experimental outcomes. However, when examining population RGR response to red light there was no consistent reduction in RGR across all populations (Fig. 6). In fact, in the low and medium rainfall populations RGR in low red light treatment was higher than in the high red light treatment (Fig. 6). Nevertheless, all populations showed a consistent stem elongation response to the low red treatment, a strong indication that the plants are showing a shade-avoidance response to reduced red:far-red ratio.
The effect of blue light on RGR has to date not been widely studied. RGR should be greater under high blue light due to the higher light quality (e.g. [40]). Counter-intuitively we found RGR to be significantly greater under low blue light. In examining the components of RGR (i.e. NAR, LMR and SLA, [41]), we found SLA and NAR to be similar across the blue light treatments yet LMR was greater under low blue light, albeit marginally nonsignificant (P∼0.05). In this experiment low blue light induced a greater elongation of the stem which allowed the development of more leaf material for a given amount of plant biomass which in turn increased RGR. Therefore, light signals conveyed by different wavelengths can have a complex effect on growth rates of developing seedlings of A. implexa.
The control of heteroblastic development under low red:far-red, and the subsequent implied involvement of phytochrome photoreceptors, offers insights into hormonal signaling and the shade-avoidance syndrome. The effects of hormones on red:far-red signaling and shade-avoidance have not been extensively studied and it has been suggested that either auxin, ethylene or gibberellic acid may be involved (5,42). The application of gibberellic acid to lateral branches of A. melanoxylon suppressed heteroblastic development and applying gibberellins following phyllode development caused a reversion to compound leaves (43). Application of gibberellic acid to other heteroblastic species has also induced a reversion to juvenile leaves (44). Gibberellins are also known to cause a number of traits to undergo changes associated with shade-avoidance, particularly stem elongation (42). Therefore, shade-avoidance and heteroblastic development in Acacia may have a hormonal basis in gibberellic acid; however, the role of other hormones, particularly auxin, cannot be discounted. Furthermore, the delay in heteroblastic development may be due to increased levels of gibberellic acid and the fact that compound leaves are also adaptive under low irradiance may be coincidental.
Population response to contrasting light environments
Acacia species have high genetic variability between populations (31) and the patterns of morphological development observed for A. implexa were no exception. Irrespective of light treatment there were highly significant differences between low, medium and high rainfall populations across a range of traits. Stem elongation, in particular, appears to be highly variable across populations with the high rainfall population having the longest stems. The pattern of trait variability is consistent with adaptation to varying light environments from where seeds were collected. For example, canopy cover in the region of the high rainfall population is denser than canopy cover in the low rainfall region (45–47). Additionally, the number of cloud-free days is greater in the low rainfall region than in the high rainfall region (M. Forster, unpublished). Greater canopy cover and less total solar radiation in the high rainfall region suggests that light quality and quantity in that region is lower. Therefore, we observed greater carbon allocation to the shoot in the high rainfall population when compared with the low rainfall population.
In this experiment there were strong populations with red light treatment effects, yet there were no populations with blue light effects further suggesting that seedling development in A. implexa is controlled by changes in the red:far-red ratio. This species has an early successional strategy; it typically germinates following disturbances such as fire. Selective pressure to respond to a reduction in the red:far-red ratio would be strong as this signals competing plants are potentially growing an overhanging canopy. Experiments have shown that blue photoreceptors (cryptochromes) do not respond to crowding whereas red photoreceptors (specifically, phytochrome-B) played the most important role in photodetection of neighbors and potential competition (4).
The low rainfall population appeared to be more sensitive to a reduction in red light than the medium or high rainfall populations. In this experiment stem elongation (HtoD), allocation of biomass to stem tissue (StMR) and leaf area (LAR, SLA) were particularly sensitive traits to a reduction in red light in the low rainfall population (Fig. 3). Stem elongation is a ubiquitous response across a number of populations from open habitats when these populations are subjected to shade (48,49) and is implicated as the most common shade-avoidance response in plants (50). Evidence of greater response to shading in populations from more open habitats confirms the adaptive value of shade-avoidance (48,49,51). RGR was used as a measure of plant performance in this experiment and RGR was not significantly different in the red light × low rainfall population treatment. This result suggests a possible adaptive value for shade-avoidance in the low rainfall population.
Different parts of the spectral wavelength convey information and plants have evolved numerous mechanisms to detect plant–plant signals. A. implexa is highly responsive to a reduction in the red:far-red ratio which signals to developing seedlings to undergo photomorphogenesis and shade-avoidance. There was some shade-avoidance response to blue light but the overwhelming response was to red light. Novel to this experiment was the finding that heteroblastic development is also affected by the red light component whereby plants retain juvenile leaves for longer periods of time under low red light.
Acknowledgments
Acknowledgements— We thank Natalie Wynyard, Brenton Ladd, Geoff McDonnell and Markus Low for assistance and Grant Williamson for leaf area software. We thank reviewers for helpful comments that improved the manuscript. The project was funded by UNSW Faculty Research Grant and Early Career Research grant to S.P.B.


