Effect of Oxygen Concentration on Photo-oxidation and Photosensitizer Bleaching in Butter
Abstract
The effect of headspace oxygen concentration and color of light on photo-oxidation and degradation of photosensitizers in butter was studied. Butter samples were stored under 0%, 0.4%, 0.8%, 1.6%, 3.0%, 5.0%, 21% oxygen, and exposed to violet, green or red light. Storage time was 36 h. Degree of photo-oxidation was measured by a trained sensory panel. Photobleaching of six different photosensitizers was estimated based on front face fluorescence excitation and emission landscapes and spectral curve resolution (parallel factor analysis). The higher oxygen concentration, the more sensory degraded were the samples. Violet light resulted in slightly higher degrees of photo-oxidation than green and red light for low oxygen concentrations. Bleaching rate and course as function of O2 concentration differed between the photosensitizers. It is suggested that the rate of photobleaching is a balance between type I and type II photoreactions.
Introduction
Much work has been undertaken to explain the causes of photo-oxidation in dairy products and to describe the practical consequences (1,2). The general photoreactions are well described, but the particular processes in dairy products are not well understood. The accumulated knowledge about these photochemical reactions is to date insufficient to give well-founded practical advice to the industry on how to minimize photo-oxidation through packaging and retail.
Many studies have shown that dairy products get oxidized by exposure to visible light, violet and blue in particular, but also green, yellow and red light. This is due to photosensitized oxidation triggered by several different photosensitizers. Riboflavin has been assumed to be a prominent photosensitizer in dairy products, while recent results indicate that porphyrins and chlorophyllic molecules might play an even more important role in the photochemical reactions (3). In butter, at least six different photosensitizers are present; riboflavin, protoporphyrin IX, hematoporphyrin, a chlorophyll a like substance, as well as two unidentified tetrapyrrols (4), which we in this study denote porphyrin X1 and porphyrin X2. It is reasonable to believe that the same photosensitizers are present in most dairy products (3). The sensitizing properties of these molecules are different, making butter a rather complex photochemical system. In the photo-oxidation process, the impact of each sensitizer in the product depends on its concentration, extinction coefficient, wavelength of exposure light, as well as the availability of oxygen. We have shown that the photodegradation (photobleaching) of photosensitizers is a useful marker for the degree of photo-oxidation in butter (5) and cheese (6). This makes sense, since the result of this degradation initiates the oxidative reactions. The rate of degradation is, however, dependent on the oxygen concentration. In the case of butter, the degree of sensory perceived photo-oxidation has been shown to be higher in samples stored in high (21%) oxygen concentration atmosphere, but the rate of photodegradation of the sensitizers was lower than under low oxygen conditions (0.4%) (5). It was suggested that this was due to different shares of type I and type II photo-oxidation reactions under the two conditions: When much oxygen is present, singlet oxygen (1O2) is generated (type II photoreactions). When little oxygen is present, the light energy directly decomposes the sensitizers, and free radicals are formed (type I photoreactions) (7,8). In the previous butter study, it was apparent that under low and high oxygen concentration, different sensitizers seemed to have most impact on the resulting photo-oxidation. The above-mentioned features illustrate some of the complexity of the photochemical reactions in dairy products.
The ability to rapidly and nondestructively monitor the simultaneous degradation of several photosensitizers in biosystems is enabled by the use of fluorescence excitation–emission spectral landscapes (EEL) in combination with three-way multivariate curve resolution. EELs have been shown to follow the three-way PARAFAC (parallel factor analysis) decomposition model (9–11). From sets of EELs of mixtures it is therefore possible to estimate the pure excitation and emission spectra as well as the relative concentrations of the chemical analytes measured. An established PARAFAC model has predictive abilities; it can be used to estimate the concentrations of fluorophores in unknown samples, as demonstrated by for instance Moberg et al. (12). We developed and demonstrated a PARAFAC model that can estimate the relative concentrations of the six above-listed photosensitizers in butter (4). In the present work, we use this PARAFAC model as an effective tool to study how the photosensitizers in butter are affected by different storage conditions.
The objective of this work was to study how the photosensitizer degradation is affected by oxygen concentration and how this is related to photo-oxidation. It is well known that increased oxygen concentration leads to higher degree of photo-oxidation measured by sensory analysis or secondary oxidation products, and also that very low oxygen concentrations such as 0.2% and 0.5% are enough to give significant negative effect on product quality (5,13). Photobleaching of the photosensitizers under similar conditions, on the other hand, has never been studied and discussed in detail. This is done in this study, where EELs were collected from butter stored under different oxygen concentrations and exposed to violet, green or red light. The relative photosensitizer concentrations were estimated by the established PARAFAC model and compared with sensory analysis.
Materials and Methods
Materials. Commercially produced butter was purchased (TINE BA, Oslo, Norway) in 500 g block packages. The butter packages were all from the same production batch. The blocks were sliced into sample bars of size 6 × 6.5 × 1 cm, wrapped in plastic film (Clingfilm, Toro, Norway), placed in plastic laminate (APET/PE) trays (EKA AS, Hamar, Norway), and sealed with a laminate film-based oriented polyester (Biaxer 65 XX HFP AF) (Wihuri Oy Wipack, Nastola, Finland; O2 transmission rate of 5 cm3 per 24 h at 23°C, 50% relative humidity) with a 511VG tray-sealing machine (Polimoon, Kristiansand, Norway). The packages were flushed with 100% nitrogen giving a residual oxygen level not exceeding 0.05% in the headspace. Oxygen levels and colored films were chosen according to the design described below. All samples were stored in dark and cool (4°C) before light exposure.
Experimental design. The purpose of this design was to elucidate the effects of varying oxygen concentration and varying wavelength of exposure light. Six oxygen concentration levels were chosen; 0%, 0.4%, 0.8%, 1.6%, 3.0%, 5.0%, 21%. Oxygen was injected in the packages to reach target concentrations. To obtain 0% oxygen, the packages were packed with two FreshPax oxygen absorbers (R-100 Multisorb Technologies Ltd, Buffalo, NY). Three colors of light—violet, green and red—were obtained, by using plastic films manufactured by Rosco (Stamford, CT) with different spectral properties. The films used were: 19 Super Fire red, 89 Moss green, and 357 Royal Lavendel (violet). These filters were chosen because of their relatively narrow transmission bands in the visible spectral region. The sample packages were covered with the colored films and stored in light from two broad band 575 W metal halide lamps (OSRAM HMI 575 W/SE; Osram GmbH, München, Germany) in a refrigeration room at 4°C. In addition to the colored filters, a UV filter (3114 UV Tough filter) was used to block UV contributions transmitted through the red and green filter. No UV-block was used together with the violet filter. The three resulting exposure spectra are illustrated in Fig. 1. The fluence rate at the sample surface was ∼2 ± 0.1 W m−2 independent of color, a rate typical for commercial storage displays in grocery stores. Fluence rates were measured by a calibrated spectrometer (Apogee Spectroradiometer; Apogee Instruments, Inc., Logan, UT) and integrated in the 280–800 nm region. The samples were exposed to light for 36 h. Two butter bars were stored in each package: One for sensory analysis, one for fluorescence analysis. Three packages were stored at each of the 21 design points. In addition, six control packages were stored in the dark, three in 21% oxygen and three in 0% oxygen, resulting in a total of 69 samples for both fluorescence and sensory analysis.
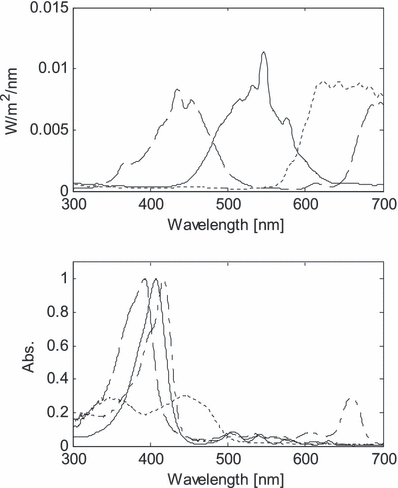
Upper panel: Spectral distribution of the exposure light used in experiment. Violet (dashed), green (solid) and red (dotted). Lower panel: Absorption spectra of hematoporphyrin (dashed), protoporphyrin (solid), chlorophyll a (dashed dot) and riboflavin (dotted). Maximum intensities are normalized to 1, except riboflavin for clarity.
Sensory analysis. Sensory analysis is a scientific discipline that applies principles of experimental design and statistical analysis to the use of human senses (sight, smell, taste, touch and hearing) for the purposes of evaluating consumer products. The discipline requires panels of human assessors, on whom the products are tested, and recording the responses made by them. It has been shown that sensory analysis is more sensitive to attributes of photo-oxidation in dairy products than instrumental methods traditionally used for measurement of oxidation, like peroxide value, gas chromatography and thiobarbiturate reactive substances (5). The instrumental methods measure more specific compounds, but as long as these are not relevant to sensory perception, or of too poor sensitivity, they are not very helpful.
The sensory evaluation was performed by a trained sensory panel at MATFORSK AS using descriptive sensory profiling according to “Generic Descriptive analysis” described by Lawless and Heymann (14). The sensory panel consisted of 10 selected and independent assessors (15) and took place in a purpose-built sensory laboratory (16). Prior to the analysis, the panel was trained in the definition and intensities of the chosen attributes using butter with varying sensory properties (light exposed and nonexposed). The following attributes were evaluated: Odors: acidic, butter, sunlight and oxidized. Flavors: acidic, sweet, salty, bitter, metallic, butter, sunlight and oxidized. Whiteness, hue and color intensity were also evaluated. The attributes oxidized- and sunlight odor/flavor are related to oxidized proteins and the typical training reference is milk exposed to sun light. Acidic odor and flavor refer to fresh acidulous/sweet fruity.
Each assessor was served each butter sample (2 × 3 cm2, with a thickness of 1 cm) on a cardboard plate. The sample temperature was ∼17°C. The samples were served twice and the serving order was randomized according to sample and assessor. Water and crackers were provided to cleanse the palate between samples. A continuous nonstructured scale was used for evaluation of sensory attributes ranging from the lowest intensity of each attribute with a span from 1.0 to the highest intensity of 9.0. Each judge evaluated the samples at individual speed on a computer system for direct recording of data (Compusense five, v. 4.6; Compusense, Inc., Guelph, ON, Canada). The sensory scores for each sample of butter were obtained by averaging the individual scores for the 10 subsamples. Sixty-nine samples were evaluated, and the measurements had to be carried out over 2 days due to capacity limitation.
Fluorescence spectroscopy. Fluorescence EELs were recorded with a Perkin Elmer LS50B (Norwalk, CT) luminescence spectrometer with a Hamamatsu PMT detector (model R3896, Japan). This detector is particularly sensitive in the red spectral region. The instrument was equipped with a front face solid sample accessory with 60° sampling geometry. The emission side was scanned with 0.5 nm step size from 580 to 720 nm, excitation was scanned with 3 nm step size from 350 to 452 nm. Excitation slit width was 6 nm and emission slit width was 10 nm. A cut-off filter at 515 nm was used at the emission side. The butter samples were placed in a circular cuvette (D = 15 mm) and covered by quartz glass. Sample temperature was ∼6°C. Total scanning time per sample was ∼15 min. The fluorescence spectra were obtained on the irradiated surface of the butter samples.
Measurement of pure compounds. Protoporphyrin IX, hematoporphyrin, Dulbecco’s PBS and dimethyl sulfoxide (DMSO) were obtained from Sigma Chemical Co. (St. Louis, MO). Protoporphyrin IX was dissolved and measured in DMSO, while PBS was used for hematoporphyrin (pH 7.4). Chlorophyll a was dissolved in methanol and riboflavin in water. Absorption spectra were registered with a Perkin-Elmer Lambda 40 UV/Vis spectrometer (Shelton, CT). All measurements were performed in standard 10 mm quartz cuvettes.


The element xijk represents the fluorescence intensity for sample i, at excitation wavelength j, and emission wavelength k. The fluorescence landscapes are thus decomposed into sample scores, aif, excitation loadings bjf, and emission loadings ckf, for each factor f, also called PARAFAC components. The residual eijk contains the variation not explained by the PARAFAC model. Both shape and amplitude of the fluorescence landscapes are used to estimate the scores.
The model used in this study had been previously developed particularly for butter. It was validated by comparison with spectral measurements of pure chemical components, as well as a so-called split-half analysis (10). The model is thoroughly described in Wold et al. (4). Model input for each butter sample, X, is a fluorescence excitation–emission landscape. Model output for each sample is estimated concentrations for protoporphyrin IX, hematoporphyrin, riboflavin, a chlorophyll a like molecule, and two presently unidentified porphyrins denoted porphyrin X1 and X2. Since the model is not calibrated against known concentrations, the output concentrations are relative for each compound. The PARAFAC analysis was performed in Matlab ver. 7.1.0 (The Mathworks, Inc., MA) by use of the PLS_Toolbox (Eigenvector Research, Inc., WA).
Significance testing of the sensory analysis with respect to storage time was performed by Tukeys honestly significantly different all-pairwise comparison test by the software Statistix 8.0 (Analytical Software, Tallahassee, FL).
Results and Discussion
Sensory analysis
Based on previous experience on Swiss cheese and cream cheese (17), we expect the sensory properties to change mainly in the upper 2–3 mm of the 1 cm thick butter samples. Possible variation in distribution of oxidation products as function of exposure light wavelength and diffusion length, is supposed to have negligible effect on the sensory judgment.
Of the sensory attributes, we have chosen to present results for oxidized flavor, sunlight flavor, butter flavor and acidic flavor since these span the main sensory variation and are closely related to photo-oxidation. The other sensory properties were either closely correlated with these (like the corresponding odors and bitter flavor), or little variation was measured (as for salty, sweet and metallic flavors). No significant changes were observed for appearance measured by whiteness, hue and color.
Figure 2 shows the sensory responses for the chosen attributes. There were no differences between control samples at 0% O2 and 21% O2 stored in the dark, which means that oxygen alone does not induce notable oxidation after 36 h of storage. For the light-exposed samples, a general trend is that the higher oxygen concentration, the more sensory degraded were the samples. Clear response variations in the concentration region 0–5% O2 were observed, while the differences between 5% and 21% were minor. Light-exposed samples stored with oxygen absorbers (close to 0% O2) were sensorically similar to control samples stored in the dark. For samples exposed to violet light an increase from 0% to 0.4% and 1.6% O2 gave a significant change in sunlight flavor, and oxidized, acidic and butter flavor, respectively. Significant differences after exposure to green and red light were obtained for slightly higher oxygen concentrations. Degree of oxidation as function of oxygen level corresponds with results on Havarti cheese, where levels of 0.2% and 0.5% O2 gave notably more intense off-flavors than samples stored with active oxygen absorbers (13). In the mentioned study, the samples stored under ∼0% oxygen became oxidized after prolonged storage (4–7 days). The results also correspond well with Veberg et al. (5), who observed a similar higher level of sensory measured oxidation in butter stored in 21% O2 compared with 0.4% O2.
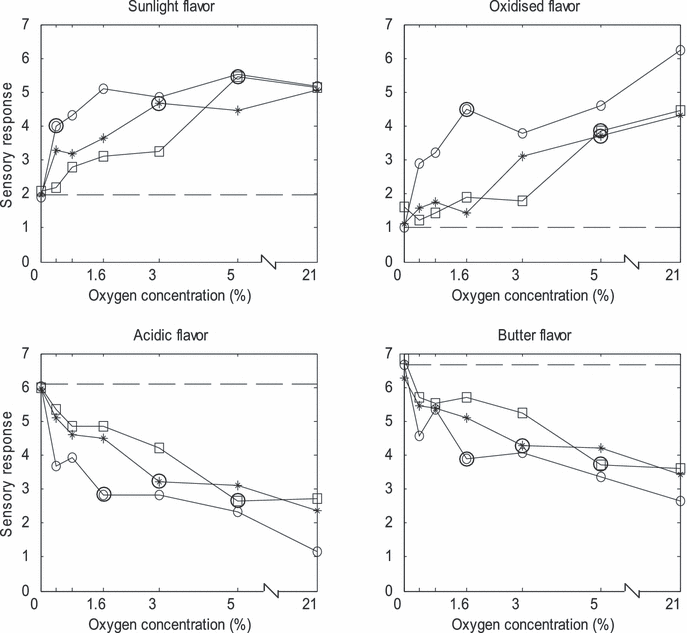
Sensory responses of butter stored under different atmospheres and exposure light. Violet (○), green (*) and red light (□). Big circles indicate at what O2 concentration above 0% the sensory properties were significantly different from control samples stored in the dark. Sensory properties at all concentrations higher than these were significantly different from controls. Dashed horizontal line indicates sensory values for control samples. Mean SD for each mean value is 1.3.
An interesting comparison can be drawn to a study by Moan and Sommer (18), who studied the oxygen dependence of the photosensitizing effect of hematoporphyrin on living cells. The O2 levels used were ∼0%, 0.5%, 1%, 2%, 5%, 10%, 20% and 100%. The efficiency of photoinactivation of the sensitized cells decreased with decreasing oxygen concentration in the same fashion as sensory measured oxidation decreased in this study. No photoinactivation was observed when the atmosphere above the cells was pure N2 gas. With 1% O2 the inactivation was reduced by 50% compared with 20% O2, which is comparable with our sensory results. The yield of singlet oxygen was found to follow the same O2 dependency as that of the yield of cell inactivation, and the authors concluded that singlet oxygen reactions with the cells were the main reason for cell destruction.
It is clear that violet light resulted in a generally more severe photo-oxidation than green and red light at low O2 concentrations, while at high O2 concentrations minor differences were observed. It should be noted that green light induced significant increases in oxidation at lower oxygen levels compared with the red light. The same trend was observed in a similar light exposure experiment with butter, including the O2 levels 0.4% and 21% (5). The reasons for the sensory responses are further discussed next, in connection with the spectroscopic analysis.
Degradation of photosensitizers
Figure 3 shows a typical EEL with the different spectral features indicated. More details seen in typical fluorescence emission spectra from butter stored under different conditions are presented in Fig. 4. The sloping “baseline” is the tail of the riboflavin peak at about 530 nm. It is clear that both color of exposure light and O2 concentration affected how the photosensitizers were degraded. A striking feature is that photobleaching was more severe at 3% O2 than at either 0% or 21% for many of the sensitizers. Figure 5 shows the PARAFAC estimated concentrations of the different photosensitizers, and illustrates in detail how they varied with O2 concentration and color of exposure light. The overall picture is quite complex, and in the following we can only suggest explanations based on existing literature.
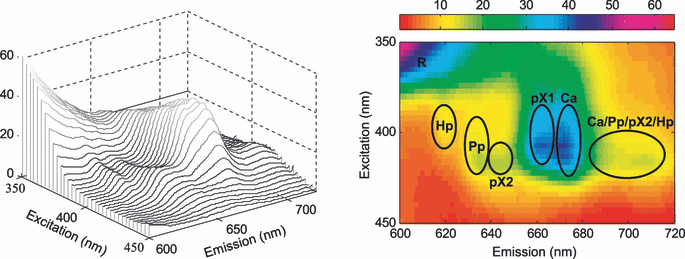
Excitation and emission landscape from nonexposed butter sample (left), and corresponding intensity image (right). The peaks are identified by Hp: hematoporphyrin, Pp: protoporphyrin IX, pX1: porphyrin X1, Ca: chlorophyll a, R: tail of riboflavin peak, pX2: porphyrin X2.
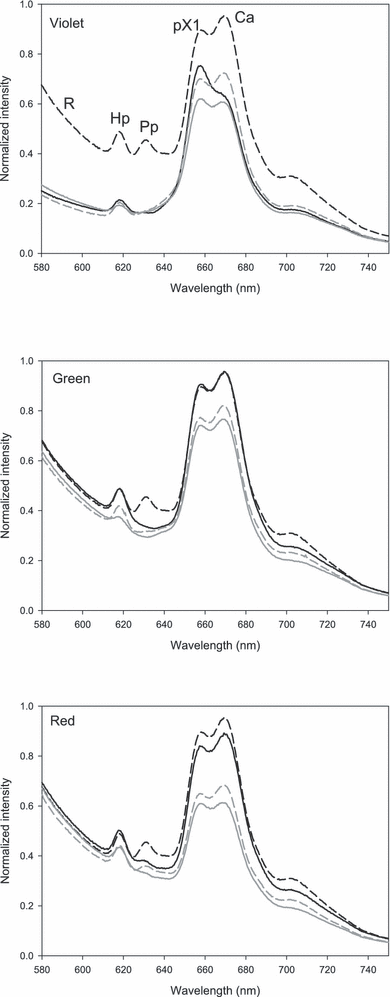
Fluorescence emission spectra (for excitation at 380 nm) of butter stored under different light and atmospheres. Sample stored in the dark (black dashed). Samples stored in 21% (gray dashed), 3% (gray solid) and 0% O2 (black solid). The peaks are identified by Hp: hematoporphyrin, Pp: protoporphyrin IX, pX1: porphyrin X1, Ca: chlorophyll a, R: riboflavin. Porphyrin X2 cannot be discerned in this plot.
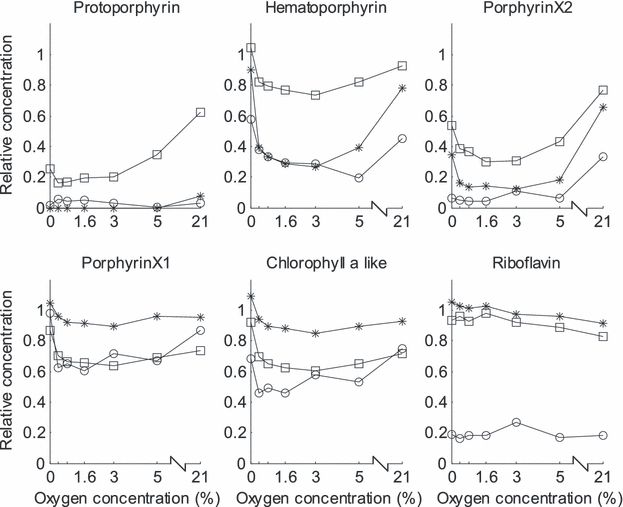
Normalized photosensitizer concentration estimated by PARAFAC versus oxygen concentration. Samples exposed to violet (○), green (*) and red (□) light. The value 1 indicates the concentration in nonexposed control samples.
Oxygen dependence. For all photosensitizers, except riboflavin, the degradation was nonlinear with respect to oxygen concentration. Riboflavin was very little or negligibly affected by the oxygen concentration. Four of the sensitizers were least degraded at very low and high O2 concentrations, and most degraded at oxygen concentrations around 1.6–3%. Protoporphyrin IX behaved slightly differently, and is unfortunately difficult to compare with the others because it was completely degraded at several storage conditions, particularly under green light exposure. However, when exposed to red light, protoporphyrin IX was more degraded at lower O2 concentrations. Similar differences in degradation rate of photosensitizers in butter with respect to high and low oxygen levels were observed by Wold et al. (4) and Veberg et al. (5). We have previously seen that the photosensitizers in light-exposed butter and cheese are gradually degraded over time, and that the rate of degradation correlates well with sensory measured oxidation (5,6). In this experiment, the degree of photobleaching is not correlated with formation of oxidative flavors. Many of the sensitizers were least degraded at 21% O2, while the corresponding samples were the most oxidized. Degradation of photosensitizers can therefore be used as a quantitative marker for photo-oxidation only when the O2 level in the product packages to compare is the same.
An increase in photobleaching with decreasing O2 concentration is unusual when comparing with relevant reports. Investigations of photobleaching of sensitizers related to photodynamic therapy (PDT) generally show that a decrease in oxygen leads to a slower degradation of the sensitizers. Most of these studies conclude that singlet oxygen is involved in the reactions. When protoporphyrin IX is bleached through reactions with singlet oxygen, a photoproduct is formed (photoprotoporphyrin) with emission maximum at 670 nm and excitation maximum at 428 nm (19–22). In our studies of butter and other dairy products we have never observed formation of this photoproduct, maybe because it is of very low intensity, or maybe because it is not formed. No formation might suggest that protoporphyrin in our case is degraded by other reactions than with singlet oxygen. Wilson et al. (23) suggested that the rate of photobleaching might be a balance of oxygen-dependent and -independent mechanisms. Finlay et al. (24) developed a model in which reactions between singlet oxygen (1O2) and the photosensitizer and reactions between the sensitizer triplet and biological targets are both allowed to contribute to bleaching. Predictions of this model were tested in experiments performed on cells sensitized with different concentrations of Photofrin and subjected to PDT. In qualitative agreement with the mixed-mechanism model, the Photofrin bleaching was more efficient via1O2 reactions at high photosensitizer concentrations, while at the lowest concentration, sensitizer triplet reactions (type I photoreactions) were more efficient. A similar study of photobleaching of protoporphyrin IX in cells in well-oxygenated and hypoxic conditions clearly indicated that other mechanisms for photobleaching than type II reactions were involved (25). Based on previous photo-oxidation and bleaching results obtained from butter, we suggested that both type I and type II photoreactions were involved in the actual bleaching (4). The fact that the sensitizer concentrations in butter are very low, around 0.02 ppm for protoporphyrin IX and hematoporphyrin (26), and that severe photobleaching at low O2 concentrations occurs, support the hypothesis that sensitizer triplet reactions are influential in butter.
The observed nonlinear relation with O2 concentration is not trivial to explain, but it is reasonable to believe that part of it is related to the share of type I and type II photoreactions. At 21% oxygen it is reasonable to believe that singlet oxygen formation is the main photoreaction (type II). Singlet oxygen will react with neighboring molecules, either the sensitizer itself or fatty acids in the butter. Probably, singlet oxygen favors the fatty acids, since the degradation rate of the sensitizers increases when the oxygen concentration decreases. Type I photoreactions is then gradually taking over at lower O2 concentrations. The maximum degradation around 3% O2 might indicate a transitional region between the two reaction types. The course of degradation below 3% O2 varied for the different molecules. Hematoporphyrin, porphyrin X1 and chlorophyll a were not or only slightly degraded at ∼0% O2, while protoporphyrin IX and porphyrin X2 were severely degraded. In spite of this strong sensitizer degradation at ∼0% oxygen, the sensory properties of the butter were not significantly different from the reference stored in the dark. This might suggest that the light-exposed butter samples at ∼0% oxygen contained free radicals as a result of type I reactions, but with a minimum of available oxygen the oxidative reactions would be at a very low rate.
Butter contains mostly saturated fatty acids, but the monounsaturated oleic acid makes up as much as 32% of the fat. Linoleic (two double bonds) and linolenic (three double bonds) make up about 0.2% and 0.1%, respectively. It is well known that oxidizability of fatty acids by singlet oxygen in homogeneous bulk phase is accelerated with an increase in the number of double bonds. The reaction rates of singlet oxygen with oleic, linoleic and linolenic acids are 0.74, 1.3, and 1.9 × 10⁵ m s−1, respectively (27). Watabe et al. (28) reported that in a system with liposome bilayer membranes and protoporphyrin IX, the decomposition rate after reaction with singlet oxygen was higher for oleic acid than for linolenic and linoleic acid. It was suggested that oleic acid was more available for singlet oxygen in this particular system. These findings suggest that there are good conditions for singlet oxygen reactions with the fatty acids in butter, although the major fat fraction is saturated. Singlet oxygen reactions in butter have previously been documented by Luby et al. (29), who studied the oxidation products formed during light exposure of butter, and found that cholesterol undergoes oxidation via singlet oxygen attack, as well as by free radical mechanisms. Veberg et al. (5) suggested that both type I and II reactions are active in butter. They added β-carotene to samples of butter stored in air and measured a pronounced inhibition of photo-oxidation compared with samples without β-carotene. β-Carotene is an excellent singlet oxygen quencher (30).
Dependency of wavelength of exposure light. Degree of photobleaching with regard to the color of exposure light corresponded quite well with the spectral overlaps between exposure sources and the absorption spectra of the photosensitizers (Fig. 1). All sensitizers were degraded by violet light, since all of them absorb in this spectral region. Green light resulted in prominent photobleaching of protoporphyrin IX, hematoporphyrin and porphyrin X2. It is noteworthy that these three molecules were degraded more, or at a similar rate in green light as they were in violet light, although their absorption coefficients are much higher in the violet region than in the green. Similarly, the red light degraded porpyrin X1 and the chlorophyll a-like molecule at a similar level as violet light. These results suggest that the rate of photobleaching of each sensitizer depends on the presence and concentration of the others. The natural color of butter originates from β-carotene. β-Carotene absorbs light between 400 nm and 500 nm and would most probably absorb parts of the violet light, limiting degradation of the sensitizers, and also inhibiting photo-oxidation by violet light. This might explain the rather small sensory differences induced by violet and green light.
There might also be other interdependencies. Singlet oxygen has a short life time before it reacts with surrounding molecules and thus has a very short diffusion length (31). Observed lifetime in H2O is 3.1 μs with a diffusion length of 1900 Å. Corresponding values in lipid membranes are 7 μs and 2200 Å. It has also been shown that the lifetime of singlet oxygen decreases with increasing photosensitizer concentration (32,33). In butter it is therefore most likely that 1O2 reacts with fatty acids in close vicinity of the place of generation or with the sensitizer molecule from which it was generated. However, it can also react with other photosensitizers. The weak decrease in riboflavin concentration under red and green light towards higher oxygen concentration could be due to reactions with singlet oxygen generated by other photosensitizers. Riboflavin is the sensitizer of highest concentration (about 0.3 mg g−1), 10 000 times more than some of the porphyrins, which are in the range 0–0.02 ppm.
Finally, it should be noted that the fact that the fluorescence measurements were performed on the light exposed surface of the butter samples, might introduce some limitation in the interpretation of the results. The diffusion depth of light is not considered, and might be wavelength dependent. We have previously observed that the spectral effects in similar samples are mainly at the surface, and that these effects are similar, but less pronounced some mm into the sample (17). In the present study we regard the surface to be representative enough to study the main photochemical effects of O2 concentration and color of light. The effect of diffusion length dependency on wavelength might be a case for further studies.
Summary
Photooxidation mechanisms and degradation of photosensitizers during light exposure are complex. The processes are intricately interrelated and depend on factors such as sensitizer concentration, light fluence, matrix, number and properties of sensitizers, etc. It is beyond the scope of this work to explain in detail all the observed results. They have been discussed and related to relevant literature to the best of our abilities. The present findings, together with those previously reported by us (4), can hopefully constitute a starting point for further studies and a more thorough understanding of the photochemical processes in dairy products in particular, and for biomaterials in general.
We can harvest some practical conclusions: As has been demonstrated earlier, low oxygen concentration inhibits photo-oxidation. In the case of butter, green and red light will induce comparable photo-oxidation as violet light as long as the exposure intensity is the same. This is because the effective photosensitizers protoporphyrin IX and hematoporphyrin seem to be just as active under exposure to green light as to violet. It has previously been shown that degradation of photosensitizers can be used as a marker for photo-oxidation, but for comparative studies, the oxygen concentrations in the products/packages should be the same.
Acknowledgements— The authors thank Hanne Larsen, Hans Sundell, Inger-Johanne Fjøsne and Per Lea at MATFORSK AS, the Norwegian Food Research Institute, for excellent technical assistance. The Research Council of Norway is greatly appreciated for founding this research (NFR-165637).


