Photoprocesses of Xanthene Dyes Bound to Lysozyme or Serum Albumin
Abstract
The ground and excited state processes of eosin, erythrosin and rose bengal in aqueous solution were studied in the presence of lysozyme or bovine serum albumin (BSA). Noncovalent protein-dye binding was analyzed by circular dichroism (CD), fluorescence and UV–Vis absorption spectroscopy. The effects of protein concentrations and pH were studied. Fluorescence quenching of the dye takes place due to binding to lysozyme and fluorescence enhancement due to low loading to BSA. The effects of proteins on the xanthene triplet state and its precursor were observed by time-resolved 530 nm photolysis. The triplet lifetime is quenched by lysozyme and prolonged by loading to BSA. Light-induced damages on both the dyes and proteins were observed under exclusion of oxygen. Photo-oxidation is efficient for lysozyme and lower for BSA. The CD signal of the eosin/BSA system is maximum at pH 4, where the photo-oxidation is minor.
Introduction
The interaction of electronically excited small molecules with macromolecules plays an important role in the development of new biotechnologies. One example with wide application potential is J-aggregation of cyanine dyes (1). J-aggregation is the subject of much interest for nanosized systems and can be enhanced by macromolecules, e.g. polyanions or gelatin, as templates (2,3). Thiacarbocyanine dyes bind to proteins, such as bovine (BSA) or human (HSA) serum albumin (3–6). Each protein, ribonuclease A, lysozyme, trypsin or BSA, has different binding sites (4). As methods to characterize the binding properties, absorption, fluorescence, circular dichroism (CD) spectroscopy and flash photolysis have often been used. Cyanine dyes are suitable for analyzing complexation with macromolecules and their binding sites, but are unfavorable for inducing photodamage as the quantum yield of intersystem crossing (Φisc) is low.
Insights into the structure of proteins are of great importance. For photochemical investigations, a variety of molecules have been applied; examples are methylene blue (7,8), porphyrins (9), chlorin p6 (10), flavins (7), nalidixic acid (11), 9,10-anthraquinones (12), anthracene (13), ketones (14,15), 1,8-naphthalimide (16), naphazoline (17), triarylmethane dyes (18) and several chain-substituted pyrenyl peptides (19,20). Moreover, xanthene dyes, such as eosin Y, erythrosin B (denoted from now as eosin and erythrosin) and rose bengal have frequently been applied. They are well-known sensitizers, and their binding to proteins and their photoredox features have been intensively investigated (7,21–41).
Most photodamage studies refer to oxygen-mediated effects. The photosensitized oxidation of biomolecules has been reviewed by Straight and Spikes (38). Photodynamic inactivation of enzymes in the presence of oxygen involves molecular singlet oxygen, which is formed by energy transfer from the sensitizer triplet state. The reactions of molecular singlet oxygen with proteins have been reviewed by Davies (39). Alternatively, electron transfer from the sensitizer triplet state yields oxygen radicals (38,41). One could expect that proteins are photodamaged in the presence and absence of oxygen via different mechanisms. In fact, the interaction of radicals and biomolecules follows other pathways, but only little data concerning the effects of oxygen-free oxidation of proteins are available in the literature. Anthracene and 9,10-anthraquinone derivatives were used to decompose lysozyme and BSA by UV-irradiation in deoxygenated solution (12,13). Photodamage of oxygen-free BSA with anthracene derivatives has been analyzed by SDS-PAGE (13). Stereoselective interactions on HSA could be performed with ketones (15). The triplet state of the anionic 1,8-naphthalimide reacts with aromatic amino acids of lysozyme and BSA (16). For cationic triarylmethane dyes this triplet quenching can be achieved using benzophenone as the sensitizer (18).
In this paper we extend our studies of the binding of ionic dyes to proteins (3–6) using eosin, erythrosin and rose bengal in combination with either lysozyme or BSA. The features of these dyes in aqueous solution are well known, e.g. strong fluorescence and even stronger intersystem crossing, but the characterization of the photo-oxidation is not sufficient. Electron transfer from protein components, e.g. aromatic amino acids, to the xanthene triplet state is expected to take place. We aim to outline the CD properties and at a better understanding of the binding and photo-oxidation of proteins and to elucidate the conditions in the absence of oxygen. A comparison of some results with fluorescein as related dye without intersystem crossing and with gelatin as polypeptide is instructive (Scheme 1).

Materials and methods
The dyes (41) and proteins (4) were the same as used previously. Lysozyme (Fluka, molecular weight: 14.3 kDa) was from egg white; BSA and gelatin (porcine skin, type A) were from Sigma and water was from a millipore (milli Q) system. Gelatin solutions were prepared by addition of an appropriate amount of water to the grains; after a few hours of swelling the sample was solubilized by heating for 20 min at 50°C. The dye solutions were freshly mixed and prepared without buffer, unless indicated otherwise. The pH was typically 7.2–7.8 and shifted by addition of protons (HClO4) or hydroxyl ions. The molar absorption coefficient of BSA is ε280 = 4.6 × 10⁴ m−1 cm−1 (9). The molar absorption coefficient of eosin is ε517 = 0.9 × 10⁴ m−1 cm−1 (41). The steady-state spectral measurements were used to determine the concentration of free dyes and those bound to proteins as well as to analyze the pH and concentration dependences. A spectrofluorimeter (Cary, eclipse) was employed to measure the fluorescence spectra. Irradiation was performed with a 1000 W Xe-Hg lamp and a monochromator. For free eosin (20 μm) test measurements revealed that photodecomposition is more than 100 times less efficient than in the presence of 20 μm lysozyme. The UV–Vis absorption spectra were recorded on a diode array spectrophotometer (HP, 8453). The CD spectra were recorded on a Jasco J-715 spectrometer with Hamamatsu R376 photomultiplier and appropriate software (Spectra Manager). SDS–PAGE of samples was performed using a Xcell SureLock system (Invitrogen, EL0001); solutions were prepared without buffer prior to electrophoresis. The loading buffer (Lämmi, 10 μL) containing SDS (4% vol), 20% glycerol, 0.1 m Tris-HCl (pH 6.8) and 0.2 m 1,4-dithiotreitol either with or without bromophenol blue (0.2%) were added to the protein samples. Protein solutions (20 μL) were denatured by boiling for 3 min before loading onto the gel. For BSA and lysozyme 4–12% polyacrylamide gels (bis-tris) were used. The gels were run in a MES-buffer by applying 60 mA and 110 V. Maldi-Tof analysis was carried out with BSA, but the photodamage was too small for the required high protein concentration.
The flash photolysis (Nd-YAG laser) operated at λexc = 530 nm, the absorption signals were measured with two digitizers (Tektronix 7912AD and 390AD) and an Archimedes 440 computer for data handling (41). The measurements were carried out at 24°C and refer to air-saturated aqueous solution unless indicated otherwise, e.g. when photolysis was applied. Test measurements revealed that for CD and fluorescence essentially the same results were obtained either in air- or argon-saturated aqueous solution in contrast to both steady-state and time-resolved photolysis. In order to examine intact dye-protein systems, the pH was kept at 7–8 and only for eosin/lysozyme was the range extended to pH 3 and 11.
In order to probe for dye radicals, electron transfer from the triplet state to hexammineCo(III)chloride (Aldrich) was studied. In fact, quenching was efficient, but the transient absorbance (ΔA) at 400 nm (after quenching) is too low, in agreement with other cases in the literature (41,42). HexammineCo(III)chloride binds to the dyes and photolysis of the complex in the absence and presence of lysozyme gave an absorption increase at 300–500 nm. No photolytic results, however, were attempted as thermal decomposition of the xanthene dyes within a few minutes was registered.
Results
Absorption of xanthene dyes
The various spectral and kinetic features change with increasing the protein concentration ([P]), whereas the dye concentration ([D]) was kept constant for each method. The results may roughly be distinguished between high loading conditions with many dyes bound to one protein ([P]/[D] ≤0.2) and low loading ([P]/[D] >1) with only one dye or less per protein. Free eosin, erythrosin and rose bengal in aqueous solution at low concentrations of 2–20 μm are present as monomers. The absorption maxima λa are compiled in Table 1. The values vary little with pH, e.g.λa = 510 and 520 nm for eosin at pH 3 and 11, respectively.
| Dye | λa0 (nm) | λfex (nm) | λfem (nm) | Φ f† | Φ isc† |
|---|---|---|---|---|---|
| Eosin | 515 | 515 | 537 | 0.20 | 0.80 |
| Erythrosin | 525 | 525 | 547 | 0.07 | 0.4 |
| Rose bengal | 547 | 547 | 565 | 0.1 | 0.75 |
| Fluorescein | 475 | 488 | 511 | 0.9 | 0.03 |
- *For free dyes in water at pH 7.0–8.0. †Taken from Refs. (41–43).
Addition of proteins results in a marked hyperchromism due to stacking of the aromatic residues with those of the dye chromophore. Generally, the maxima are redshifted upon an increase in the protein concentration, e.g. from λa0 = 547 nm for free rose bengal to λaP = 564 nm when bound to BSA. Examples are shown in Fig. 1 (inset) for eosin in the presence of lysozyme. The signal at λa0 = 515 nm decreases with increasing [lysozyme]/[eosin] and increases at λaP = 530 nm of the complex (Fig. 1). Figure 2 illustrates binding of eosin and rose bengal to BSA and three curves for erythrosin/BSA system are shown in Fig. 3 (inset). The peak height for [P]/[D] = 1 vs 0 (ΑP/Α0) at pH 8 is only slightly smaller. The effect is described by the 50% value ([P]/[D])1/2 which varies between 0.05 and 0.2 (Table 2). Moreover, an isosbestic point at 522–555 nm demonstrates the presence of only two absorbing species, free and bound dye.
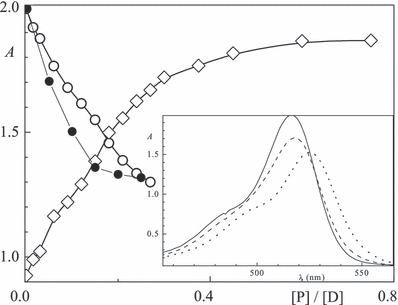
Absorption at 517 nm (circles) and 530 nm (◊) as a function of the [P]/[D] ratio for lysozyme (full) and BSA (open) with eosin (20 μm) in aqueous solution at pH 7.6; inset: spectra at [lysozyme]/[eosin] = 0, 0.05 and 0.5 (left to right).
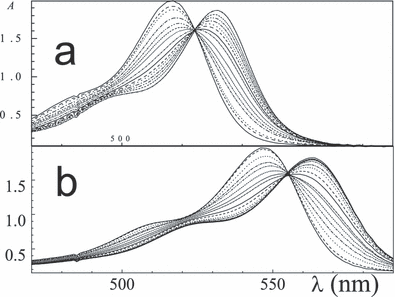
Absorption spectra of (a) eosin and (b) rose bengal in aqueous solution at pH 7.6 at [BSA]/[D] intervals between 0.015 and 0.15 and 0.008–0.15, respectively.
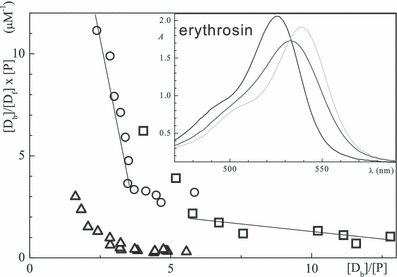
Scatchard plots for BSA with eosin (circles), erythrosin (triangles) and rose bengal (squares) in aqueous solution at pH 7.6; inset: spectra at [BSA]/[erythrosin] = 0, 0.2 and 1 (left to right).
| Dye | Protein | λaP (nm)† | Α P/Α0† | ([P]/[D])1/2‡ |
|---|---|---|---|---|
| Eosin | BSA | 530 | 0.95 | 0.14 |
| Lysozyme | 522 | 0.8 | 0.06 (0.3)§ | |
| Gelatin | 521 | 0.52 | ||
| Erythrosin | BSA | 539 | 0.95 | 0.18 |
| Lysozyme | 537 | 0.8 | 0.06 (0.2) | |
| Rose bengal | BSA | 564 | 0.95 | 0.05 |
| Lysozyme | 556 | 0.75 | 0.05 (0.1) | |
| Fluorescein | BSA | 517 | 1.6 |
- *In water at pH 7–8 under air (for convenience). †For [P]/[D] = 0.3–1. ‡Values for 50% of maximum change and [D] = 20 μm. §Values in parentheses refer to 5 mm phosphate buffer, pH 7.
 (1)
(1) (2)
(2) (3)
(3)Here, [P] is the total protein concentration and [Df] is the concentration of free dye molecules which are in equilibrium with bound dyes [Db]. The dependence of [Db]/([Df] × [P]) vs [Db]/[P] is in a simple case, i.e. when the binding sites do not interact, a straight line, the intercept/slope gives n and 1/slope is Kd. Scatchard plots for BSA and the three xanthene dyes (Fig. 3) show two linear parts, i.e. that two binding domains are present. Data for typical cases are listed in Table 3. Biphasic Scatchard plots have also been reported for binding of triarylmethane dyes (18) and thiacarbocyanine dyes (4) to BSA.
| Dye | Protein | n 1 | n 2 | K d1 (μm) | K d2 (μm) |
|---|---|---|---|---|---|
| Eosin | BSA | 4 | 9 | 0.14 | 1 |
| Lysozyme | 10 (3)† | 8 (1) | 2 (0.1)† | 4 (1) | |
| Erythrosin | BSA | 4 | 8 | 1 | 10 |
| Lysozyme | 17 (5) | 11 (1) | 2 (0.2) | 10 (3) | |
| Rose bengal | BSA | 6 | 25 | 0.7 | 10 |
| Lysozyme | (1) | (2) |
- *In air-saturated aqueous solution at pH 7–8. †Values in parentheses refer to 5 mm phosphate buffer, pH 7.
To reveal a possible effect of ion strength, the binding to lysozyme was also studied using phosphate buffer. The ([P]/[D])1/2 value in the absence of a buffer is significantly smaller than in the presence (Table 2), indicating stronger binding in neat water. For the three dyes and lysozyme both Kd and n values are smaller, when 5 mm phosphate buffer at pH 7 is used (Table 3). Generally, a comparison with other values in the literature (4,10,19,20,24,32,33,37) indicates that the Scatchard analysis of the xanthene/lysozyme or /BSA systems yields too many binding sites.
Circular dichroism
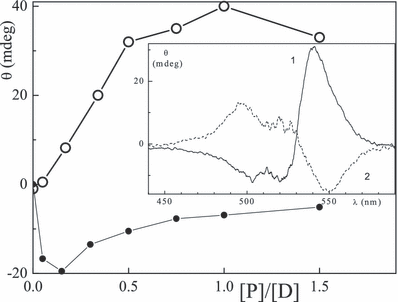
The binding of the xanthene dyes to proteins is supported by the induced CD measurements. Figure 4 (inset) shows CD absorption spectra of eosin bound to lysozyme and BSA. In the lysozyme the ellipticity (amplitude of the signal: Θ) is largest at pH 5. With increasing [BSA]/[eosin] at pH 7 the CD absorption signal at 540 nm increases, has a maximum at a characteristic dye/protein ratio ([P]/[D])c of ca 1 and then decreases (Fig. 4). The plot of -Θ with lysozyme at 550 nm is corresponding, except for the steep increase in Θ above ([P]/[D])c = 0.05. For all protein/dye systems which reveal binding, a doublet (bisignate) signal coinciding with the absorption band was observed. The position of the sub-band, Θ, its sign and the characteristic ([P]/[D])c ratios are listed in Table 4 for the six systems most extensively studied; the signals of rose bengal are smallest. The dyes are partly bound to characteristic environments of BSA and lysozyme, i.e.α-helices and β-sheets, respectively. The role of H+ and OH− concentrations was examined in the case of eosin for [P]/[D] = 1. The peak signals with BSA and lysozyme are largest at pH 3.8 and 5, respectively (Fig. 5). A maximum at pH 4 was also observed for the erythrosin/BSA system.
| Dye | Protein | λCD (nm) | Θ (mdeg) | ([P]/[D])c† |
|---|---|---|---|---|
| Eosin | BSA | 540 | 40 | ≈1 |
| Lysozyme | 550 | −20 | 0.15 | |
| Lysozyme‡ | 500/550 | 6/−12 | 0.25 | |
| Erythrosin | BSA | 550 | 20 | ≈1 |
| Lysozyme | 559 | −14 | 0.05 | |
| Rose bengal | BSA | 574 | 10 | |
| Lysozyme | 567 | 5 |
- *In water at pH 7–8 (unless otherwise indicated) for [P]/[D] = 0.9–1.1. †Values for minimum or maximum. ‡Values at pH 11.
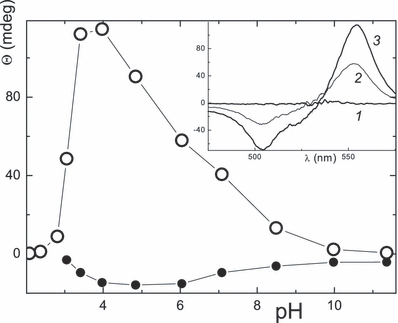
Θmax signals at [P]/[eosin] = 1 plotted as a function of the pH for lysozyme (•) and BSA (○); inset: spectra of BSA at pH 4, 7 and 10, 3, 2, 1, respectively.
Fluorescence
The fluorescence emission maximum of eosin in aqueous solution is positioned at λfem = 537 nm, the excitation peak is at λfex = 515 nm and the values are compiled in Table 1. The maxima are redshifted with increasing protein concentration, e.g. 13–20 nm for [P]/[D] = 1. Examples of the emission and excitation spectra in the absence and presence of BSA are shown in Fig. 6 (inset) for eosin. Binding of xanthene dyes to lysozyme was found to quench the quantum yield Φf which decreases with increasing protein concentration (full circles in Fig. 6). The ratio of values for [P]/[D] = 1 vs 0 is ΦfP/Φf0 = 0.7 for BSA/eosin. However, Φf initially decreases, approaches a minimum at [BSA]/[D] = 0.02 and then increases (Fig. 6). This minimum is similar in the case of rose bengal and erythrosin where, however, the fluorescence at low loading is much larger (Table 5). A minimum in the dependence of Φfvs the albumin concentration has been reported for eosin/HSA (21). In contrast to BSA, Φf of the three dyes decreases steadily vs the lysozyme concentration.
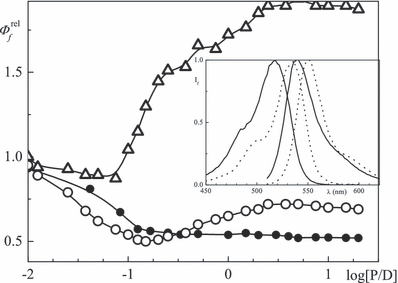
Relative Φf (λfex = 520 nm, λfem as in Table 5) as a function of log [P]/[D] in aqueous solution at pH 7.6 for erythrosin (Δ, BSA) and eosin (3 μm) with BSA (○) or lysozyme (•); inset: fluorescence excitation (left, λfem = 560 nm) and emission spectra (right, λfex = 520 nm) of eosin in the absence (full) and presence (dotted) of BSA, [P]/[D] = 1.
| Dye | Protein | λfex (nm) | λfem (nm) | Φ f P/Φf0 |
|---|---|---|---|---|
| Eosin | BSA | 534 | 550 | 0.7 |
| Lysozyme | 528 | 545 | 0.7 | |
| Gelatin | 520 | 542 | 0.8 | |
| Erythrosin | BSA | 540 | 559 | 2.1 |
| Lysozyme | 539 | 555 | 0.94 | |
| Gelatin | 534 | 550 | 0.6 | |
| Rose bengal | BSA | 564 | 583 | 2.4 |
| Lysozyme | 556 | 572 | 0.8 | |
| Gelatin | 552 | 570 | 0.18 | |
| Fluorescein | BSA | 510 | 527 | 0.23 |
| Lysozyme | <490 | 511 | 0.6 | |
| Gelatin | 489 | 511 | 0.95 |
- *In water at pH 7–8 for [P]/[D] = 0.9–1.1.
Transient absorption
The triplet states of the xanthene dyes have maxima at 550–600 nm, a strong bleaching at λa and first-order decay kinetics (41). The lifetime (τT) in air- and argon-saturated aqueous solution is typically 3 and τT0 = 30 μs, respectively. The rate constant of eosin triplet quenching by oxygen is kox = 1 × 10⁹ m−1 s−1 (26). Φisc values of free dyes in aqueous solution are 0.4–0.8 (Table 1). The transient difference spectra remain virtually unchanged when a protein is added, except for the shift from λa0 to λaP, whereas the kinetics depend significantly on the protein concentration.
The dependences of 1/τT and ΔA600 as a function of the [P]/[D] ratio are shown in 7, 8, respectively. The lifetime under argon becomes longer on addition of BSA in the 1–30 μm range. The triplet lifetime of porphyrins bound to BSA is also longer than that of the free dye (9). On the other hand, τT becomes shorter in the presence of the lysozyme. Typical triplet lifetimes at low loading are compiled in Table 6. A shorter τTP with loading to the lysozyme is ascribed to triplet quenching. The slope in the three cases of Fig. 7 is similar and corresponds to a rate constant for quenching of the triplet state by lysozyme of kq = 1.1 × 10⁹ m−1 s−1. ΔA600 was taken as the relative triplet yield. In all cases the yield becomes smaller on increasing [protein] and the effect is measured by the ΦiscP/Φisc0 ratio (Table 6). The decrease in Φisc is largest for rose bengal and smallest for erythrosin, whereas binding to lysozyme or BSA is the same (Fig. 8). Oxygen quenches the triplet lifetime of the dyes, e.g. 30 μs (air) vs 230–300 μs (argon) for xanthenes at [BSA]/[D] = 1 and τT = 2–4 μs (air) vs 30–40 μs (argon) for the free dyes.
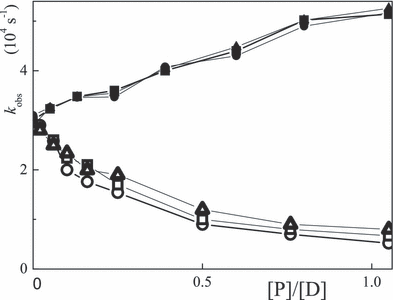
Plots of 1/τT of 20 μm eosin (circles), erythrosin (triangles) and rose bengal (squares) in argon-saturated aqueous solution at pH 7–8 as a function of the [P]/[D] ratio for lysozyme (full) and BSA (open).
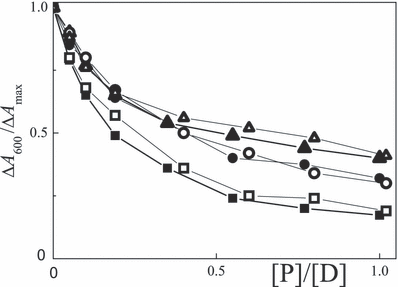
Plots of ΔA/ΔAmax at 600 nm of 20 μm eosin (circles), erythrosin (triangles) and rose bengal (squares) in argon-saturated aqueous solution at pH 7–8 as a function of the [P]/[D] ratio for lysozyme (full) and BSA (open).
| Dye | Protein | τTP (ms) | Φ isc P/Φisc0 |
|---|---|---|---|
| Eosin | BSA | 0.20 | 0.3 |
| Lysozyme | 0.02 | 0.3 | |
| Gelatin | 0.1 | 0.4 | |
| Erythrosin | BSA | 0.18 | 0.4 |
| Lysozyme | 0.02 | 0.4 | |
| Rose bengal | BSA | 0.16 | 0.2 |
| Lysozyme | 0.02 | 0.2 |
- *In argon-saturated aqueous solution at pH 7–8 for [P]/[D] = 0.9–1.1.
Photodamage
The absorption peak of the xanthene dyes in argon-saturated aqueous solution in the presence of proteins decreases upon continuous irradiation at 530 nm. Examples for the absorption of eosin at 540 nm in the presence of BSA and lysozyme ([P]/[D] = 1) are shown in Fig. 9 as a function of irradiation time. The photodamage is generally larger for lysozyme than BSA and most substantial in the alkaline medium and smallest in the acidic range (Table 7). Photodamage also takes place for the proteins themselves, as observed in the UV range or using gel electrophoresis (data not shown). The latter shows a smaller molecular weight of lysozyme after photolysis. As a measure of the photo-oxidation, the fluorescence of the aromatic amino acid residues (λfex = 280 nm, λfem = 350 nm) can be used to probe for damage of lysozyme and BSA upon irradiation of eosin. The photodamage is shown in Fig. 10 for lysozyme and BSA with eosin and rose bengal at [P]/[D] = 1.
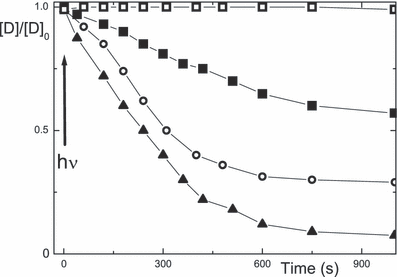
Photodamage of 18 μm eosin in argon-saturated aqueous solution, shown as Amaxvs time of irradiation at 530 nm, at pH 4.5 (squares) 7 (circles) and 10 (triangles) using lysozyme (full) and BSA (open) at [P]/[D] = 1.
| Dye | Protein | [D]/[D]0† | Φ d rel |
|---|---|---|---|
| Eosin | BSA | (0.99) 0.20 [0.1] | (<0.01) 0.4 [0.95] |
| Lysozyme | (0.5) 0.15 [0.09] | (0.1) 0.5 [1.0]‡ | |
| Gelatin§ | 0.12 | 0.5 | |
| Erythrosin | BSA | 0.3 | 0.3 |
| Lysozyme | 0.2 | 0.5 | |
| Rose bengal | BSA | 0.3 | 0.3 |
| Lysozyme | 0.15 | 0.7 |
- *In argon-saturated aqueous solution at pH 7–8 for [P]/[D] = 1; in parentheses at pH 4.5 and in brackets at pH 10. †Values for t = 10 min. ‡Absolute value Φd = 0.004. §At 0.02 wt%.
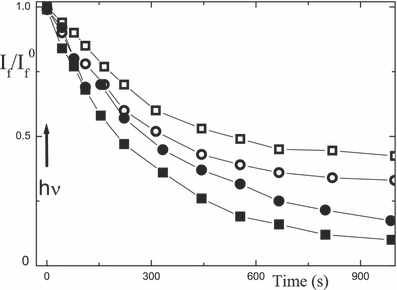
Plots of the fluorescence intensity at λfem = 350 nm (λfex = 280 nm) due to photodamage of lysozyme (full) and BSA (open) vs time of irradiation at 530 nm of 18 μm eosin (circles) and rose bengal (squares) in argon-saturated aqueous solution at pH 7–8 at [P]/[D] = 1.
Discussion
Binding of dyes to proteins
Three-dimensional structures, size, shape and charge distribution of the two proteins are well known. BSA exists in the form of a prolate ellipsoid with 185 ions per molecule, the overall net charge is −18 at pH 7, MW is 66.7 kDa and the number of amino acid residues is 582. BSA is characterized by three domains and a rigid structure due to the presence of 17 disulfide bonds compared with six to eight in other proteins; it has 65%α-helices whereas β-motives are absent. The lysozyme structure is a less flexible ellipsoidal shape and has a prominent cleft that is formed across the face of the enzyme. There are 26 ions per lysozyme molecule, the number of amino acid residues is 129, its overall net charge is +7 and the isoelectric point, where the net charge is zero, is at pH 11. The content of α-helices (40%) exceeds more than three times that of the β-sheets (12%) which, however, can be registered by CD spectroscopy.
The low ([P]/[D])1/2 of 0.05–0.18 in Table 2 indicates strong binding of xanthene dyes to lysozyme and BSA. This is different from rose bengal binding to trypsin for which ([P]/[D])1/2 of ca 30 has been reported (32). The number of binding sites of the eosin–BSA system is n = 4 and 9 and the complexation constants are Kd = 0.1 μm and 0.4 mm, respectively (33). Another analysis claimed n = 1.1 and Kd = 36 μm (36). For the eosin–lysozyme system, n = 1 (24) and multiple binding of eosin to HSA has been reported (21). On the other hand, the riboflavin–BSA system has n = 1 (14), the chlorin p6–BSA system exhibits n = 1.0 and Kd = 0.4 μm (10). A single site was also found for binding of the chain-substituted pyrenyl peptides to lysozyme and n = 2 for BSA (19,20). Kd = 230 μm for lysozyme/eosin (30). Kd depends on pH, the absorption of the eosin–BSA complex is largest at pH 2.6 and Kd (0.4 μm) is smallest at neutral pH (37). The binding to BSA has been ascribed to hydrophobic ranges or cavities in the case of cyanine dyes (4) and chain-substituted pyrenes (19). Some studies have dealt with the interaction of dyes and lysozyme (39), where the binding is due to hydrophilic ranges (4).
Chirality
The free xanthene dyes are achiral and the observed CD spectra are therefore induced by binding to chiral parts of the proteins. Left-handedness in CD spectra is suggested to be caused by binding to β-sheets (cf. Slavnova et al. [4]). The largest negative signal of Θ = −15 mdeg for lysozyme/eosin at pH 7 (curve 2 in Fig. 4) is probably due to a stronger hydrophobicity of the dye and the larger extent of β-sheets of the protein. Right-handedness may be due to binding in α-helical ranges. The largest signal of Θ = +32 mdeg for BSA/eosin at pH 7 (curve 1 in Fig. 4) is ascribed to binding sites in α-helices. The CD measurements for lysozyme/eosin solutions (Fig. 5) indicate less chiral binding sites at H+ and OH− concentrations of >0.1 mm. For cyanine dyes bound to proteins, CD spectra have been reported for HSA or BSA (4–6). The binding of chain-substituted pyrenyl peptides to both BSA and lysozyme causes comparable negative and positive Θ signals (19,20).
Photophysical processes
The fluorescence quantum yield of eosin was reported to be Φf = 0.2 (27,43–45), those of rose bengal and erythrosin are smaller (Table 1). The fluorescence quenching of xanthene dyes due to binding with lysozyme has been ascribed to dimer formation (45). Note that dimers are frequently nonfluorescent (4,28). The minimum in the dependence of Φfvs the BSA concentration in Fig. 6 is suggested to result from two effects, dimer formation and nonradiative internal conversion due to charge transfer at low loading conditions. Multiple binding of xanthene dyes to HSA was found to enhance fluorescence (21). The higher Φf at low loading of rose bengal or erythrosin to BSA (Table 5) is attributed to a binding site in a region of low polarity. The results obtained with BSA are illustrated in Scheme 2. The first dye molecule, as outlined previously (21), is held more strongly than the next and this leads to the minimum in the plot of Φfvs [P].

Quenching of the triplet of free xanthene dyes by aromatic amino acids has been discussed (41). The phosphorescence of rose bengal has a lifetime of 135 μs which is quenched by tyrosine and tryptophan, but not by histidine (32). Binding to macromolecules may increase or decrease the triplet lifetime of xanthene dyes. The former could be due to a lowering of self-quenching. The latter could be due to electron transfer to a protein component. The transient difference spectra with BSA show triplet formation and decay but virtually no free radicals. To account for the strong lowering of Φisc with the BSA concentration (Fig. 7) charge transfer excluding triplet population has been proposed (27). The triplet yield and lifetime of the eosin/lysozyme complex are both strongly reduced and ascribed to efficient charge transfer in the excited singlet state (22,27). The dependences of the quantum yield vs [P]/[D] show essentially opposite trends, for example when Φf is enhanced, Φisc is reduced (6, 8). Equilibria between free dyes, bound dimers and bound monomers account for the results (Scheme 2).
Photo-oxidation
The photodamage of xanthene dyes in argon-saturated aqueous solution is substantial for BSA and generally stronger for lysozyme (9, 10, Table 7). The rate constant for quenching of the triplet state by lysozyme is similar for the three xanthene dyes (Fig. 7) and in agreement with the value of kq = 0.9 × 10⁹ m−1 s−1 for eosin (23,24,26). These possibilities were considered for several related systems (19,20). The triplet state of benzophenone in argon-saturated aqueous solution reacts with lysozyme, kq = 4 × 10⁹ m−1 s−1, the ketyl radical is efficiently formed and the quantum yield of inactivation is Φia = 0.01 (14). Quenching of the 1,8-naphthalimide triplet state by BSA and lysozyme is less efficient, kq = (0.46–0.76) × 109 m−1 s−1 and the yield of radical anion is 0.2 (16).
So far, quantum yields of inactivation have been reported for enzymes and xanthene dyes only under air: Φia = 0.004–0.02 for the lysozyme/eosin system at pH 7 (21,23). The active site of trypsin was probed using rose bengal or eosin, Φia = 0.003 at pH 9 (7). Inactivation of trypsin is ten times more efficient for rose bengal at pH 8 than at pH 5 (32). A similar increase has been reported for the lysozyme/eosin system at pH 9 vs 11 (24). For trypsin and methylene blue or eosin as sensitizers Φia = 0.015 or 0.025, respectively (7). The photo-oxidation of lysozyme in the presence of air is mainly due to damage to trypthophan (8,24).
The fluorescence intensity around 350 nm of the tryptophyl residues has been reported to be a reliable measure for inactivation of lysozymes upon irradiation of eosin (22). Our results for [P]/[D] = 1 are shown in Fig. 10 and Table 7. Using Φia = 0.007 for eosin under air at pH 10 (24) we obtain Φd = 0.004 under argon and accordingly lower Φd values for eosin at smaller pH. The Φd values for erythrosin and rose bengal are comparable. The results presented in this work are reminiscent in several aspects of those of the chain-substituted pyrenyl peptides (19,20). The analogies with respect to the various spectroscopic features are surprising, taking into account the large differences in dye properties. The peptide cleavage was attributed to residues 108/9 of lysozyme and 346/7 of BSA. A major difference, however, is the necessity of a metal-assisted step (electron transfer from the singlet excited dye) in the photodamage using chain-substituted pyrene systems and the absence for the xanthenes. Another difference is the presence of air in previous works (19,20) and absence in this work. The mechanism is photoinduced electron transfer to CoIII, forming the pyrene radical cation, which abstracts an H-atom from an α-C atom of an amino acid residue, then reacts with oxygen to form a hydroperoxyl radical as intermediate, which releases a hydroperoxyl/superoxide ion radical (HO2•/O2•−) and eventually splitting takes place. A related peptide cleavage (aside from involvement of O2•−) is also conceivable.
Effects of pH
The absorption spectra of the eosin [P]/[D] = 1 case depend somewhat on pH, the values are λaP = 530 and 518 nm and ΑP/Α0 = 0.4 and 1 for lysozyme at pH 3 and 11, respectively. The fluorescence spectra depend also somewhat on pH, e.g.λfem = 550 and 545 nm at pH 3 and 11, respectively, but the major effect refers to the intensity. This is rather constant for BSA between pH 7.5 and 12 on the one hand and at pH 3–7 on the other, but the latter is only ca 50%. For the lysozyme, however, the trend is opposite and rather continuous, resulting in a 50% enhancement between pH 7 and 3 and a ca 60% decrease from pH 7 to 11.
The CD measurements of lysozyme/eosin solutions reveal the maximum at pH 5, indicating less chiral binding sites at both higher H+ and OH− concentrations (Fig. 5). For BSA the maximum signal is shifted to pH 3.8. This three-fold increase from neutral to the acidic range is surprising and seems not to have been reported for other dye/BSA systems. A tentative reason is a preferred binding of eosin to α-helices at pH 3–4. The maximum in the pH dependence of Θ for BSA/eosin is to a certain degree related to the photodamage, as this is smallest at pH 4.5 (Fig. 9, Table 7). It indicates shielding of the dye against damage, which gradually increases on approaching the alkaline range. For the trypsin/eosin/air system, where Φia is, in principle, similar, i.e. smaller than 10−5 at pH 3–5 and largest (0.004) at pH 11, a concise explanation is still lacking (7).
Xanthene dyes
The results so far refer to three xanthene dyes with high Φisc (40–43). In contrast, fluorescein has only a low Φisc of 0.03 but the largest Φf of close to unity. As fluorescein has been used in the so-called chromophore-assisted laser inactivation (46), we included it here. Binding to BSA gave a 42 nm redshift and ΑP/Α0 = 1.6 (Table 2). Virtually no CD signal was recorded on binding of fluorescein to BSA or lysozyme, the reasons for which are unclear. Fluorescence quenching by BSA is three times more efficient than by lysozyme (Table 5). The low ΦfP indicates that aggregation is strongest for fluorescein.
Gelatin
Gelatin was included for a few results. It can be considered as a polyelectrolyte with an isoelectric point at 5 or as a polypeptide as it contains a few thousands of amino acids. The effect of protonation–deprotonation of amino acids has been examined using cyanine dyes as probes (3). The binding of anionic dyes to the gelatin molecule is governed by Coulombic interaction. For rose bengal, fluorescence quenching is significant, ΦfP/Φf0 = 0.18 and the binding properties are closer to lysozyme than to BSA (Table 5). However, no CD signal was observed for eosin/gelatin (20 μm/0.01 wt%). This indicates that binding to chiral polypeptide parts is not strong enough. On the other hand, the effect of photodamage of eosin bound to gelatin was found to be similar to the protein cases (Table 7).
Conclusion
The spectroscopic and photochemical features of three xanthene dyes were studied in aqueous solution in the presence of BSA or lysozyme in a large concentration range and for eosin as a function of pH. High loading to lysozyme quenches singlet and triplet states. Low loading to proteins causes oxidative damage under argon, which is smaller for BSA than for lysozyme.
Acknowledgments
Acknowledgements— We thank Professor Wolfgang Lubitz for his support, Professor Alexander K. Chibisov and Dr. T.D. Slavnova for lively discussions, and Mrs. Helene Steffen, Mr. Norbert Dickmann, Andreas Göbels and Leslie J. Currell for technical assistance.


