Ultraviolet Radiation in the Rhône River Lenses of Low Salinity and in Marine Waters of the Northwestern Mediterranean Sea: Attenuation and Effects on Bacterial Activities and Net Community Production
Abstract
The high content in nutrients of freshwater outflows induces highly productive and buoyant plumes spreading over marine waters (MW). As a consequence, the growth of organisms developing in these low-salinity waters (LSW) might be potentially affected by UV-R (280–400 nm). This study investigated the penetration of UV-R and its impact on net community production (NCP) and bacterial protein (BPROTS) and DNA (BDNAS) synthesis in mesotrophic-LSW formed from the Rhône River and in oligotrophic MW of the Northwestern Mediterranean Sea (Gulf of Lions) in May 2006. High concentrations of chlorophyll a (up to 8 μg L−1) measured in the LSW (<37.8 psu, 0–10 m) were the main factor influencing the diffuse attenuation coefficients (Kd) of both UV-R and photosynthetically active radiation (PAR). The mean ratio of the Kd measured between the LSW and the MW increased with wavelength from 2.4 at 305 nm to 2.9 at 380 nm and 3.1 for PAR indicating more similarity in the UV region. NCP was severely inhibited by UV-R at the surface of the LSW, whereas no effect was measured in the surrounding MW. In contrast, BPROTS and BDNAS were affected deeper by UV-R in the MW (up to 8 m depth) compared to the LSW where inhibition was only observed at the surface. Differences in response of bacteria in LSW and MW are largely explained by differences in UV-R transparency; however, transplant experiments indicate that bacterial assemblages from the MW were also more sensitive to UV-R than those present in the LSW. We also observed that higher activity of bacteria after nutrient additions increased their sensitivity to UV-R during the day, but favored their recovery during the night incubation period for both LSW and MW. Results suggest that riverine and nutrient inputs may alter the effects of UV-R on microbial activity by attenuating the UV-R penetration and by modifying the physiology of bacteria.
Introduction
Several studies have underlined the role of UV-R (280–400 nm), including both UV-B (280–315 nm) and UV-A (315–400 nm), to induce detrimental effects on planktonic organisms, especially by inhibiting primary production and bacterial activities (1,2). Each type of UV-R causes distinct but overlapping damage (3). UV-B causes mainly direct effects on DNA by inducing dimerization of DNA bases, leading to the formation of cyclobutane pyrimidine dimers (CPDs) and pyrimidine (6-4) pyrimidone photoproducts (6-4 PP). These photoproducts block DNA replication and transcription. UV-A causes mainly indirect damage to DNA, lipids and proteins by generating reactive oxygen species (ROS) by photosensitization of endogenous cell chromophores such as cytochromes, flavins/riboflavins and nicotinamide adenine dinucleotide phosphate. However, UV-A radiation as well as photosynthetically active radiation (PAR) serve also to repair CPD and 6-4 PP of the exposed cells (3).
Deleterious effects of UV-R on phytoplankton and bacteria are observed for a wide range of aquatic ecosystems, ranging from eutrophic to oligotrophic (4). Coastal waters are productive due to nutrient loading by the rivers and upwelling. Even though transparency for UV-R is lower in coastal waters than in oceanic waters due to higher concentrations of suspended particles and chromophoric dissolved organic matter that absorbs and scatters sunlight (5,6), different studies have demonstrated that UV-R could affect both bacteria and phytoplankton in coastal waters (e.g.7,8). Indeed, the response of phytoplankton and bacteria to UV-R is not only a function of the radiation levels received, but also to a number of environmental (e.g. temperature, nutrient status, CO2 concentration) and biological (e.g. specific sensitivity, photoacclimation capacity) factors (9). In contrast to the upwelling zone (10), to our knowledge, the impact of UV-R on bacteria and phytoplankton has never been studied in coastal waters under the influence of the discharge of nutrient-rich freshwater. Moreover, we still know very little about the optical properties of coastal seawater influencing the penetration of UV-R in these river plumes (11). Whereas upwelling systems are characterized by high vertical mixing rates, river plumes are exposed to a number of night/day cycles during the transit time needed before their complete mixing with the surrounding and underlying marine waters (MW). They are also characterized by both high particulate concentration close to the river mouth and high microbial activity farther offshore. Hence, they potentially present ideal conditions to study the attenuation and effects of UV-R on microbial processes.
The Rhône River is the main river flowing into the Mediterranean Sea contributing an average of ∼1750 m3 s−1 of freshwater (12) and it represents a major nutrient source for the Gulf of Lions in the Northwestern Mediterranean Sea greatly influencing its productivity (13). In the Rhône River plume, a high productive zone generally occurs in salinities between 30 and 35 psu (14) in association with high bacterial production (15,16). However, depending on interactions between wind conditions, the density gradient induced by the Rhône River input and the intensity of mixing processes, lenses of low-salinity water (LSW; <37.8 psu), may accumulate for many days along the coast before their transfer offshore (17). These diluted water masses may cover extended areas and are associated with high concentrations of chlorophyll a (Chl a) in surface waters contrasting with surrounding oligotrophic waters of Mediterranean Sea as shown by satellite images (18) (Fig. 1b).
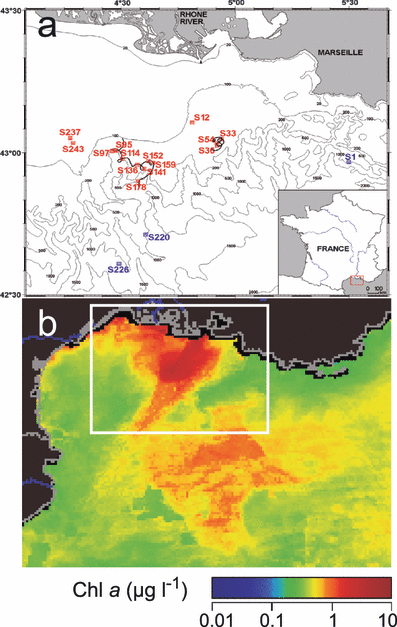
Map of the area studied during the BIOPRHOFI cruise with some of the stations used in this study (in red for low salinity waters and in blue for marine waters) (a) and a MODIS satellite image of the Gulf of Lions showing average surface chlorophyll a in May 2006 and location of the study area (white rectangle) (b).
A field campaign was conducted in May 2006 to characterize the UV-R penetration in both LSW and MW and to evaluate the influence of different light-absorbing components (phytoplankton as measured by Chl a, dissolved organic carbon [DOC], and colored dissolved organic matter [CDOM] measured by absorbance and fluorescence). We also determined the impact of UV-R on net community production (NCP = production − respiration) and bacterial activities in both LSW and MW. Finally, we examined whether the sensitivity of bacteria in LSW and MW differed, and if a change in the nutrients loaded by the Rhône River may alter the sensitivity of the marine bacteria to UV-R.
Materials and Methods
Study site and sampling. The field study was carried out on board the French R/V Le Suroît from 14 to 28 May 2006 during the BIOPRHOFI (Biological Processes in the Rhône Freshwater Influence) cruise. The study area was located in the Northwestern Mediterranean Sea off the Rhône River mouth. The sampling strategy was based on the deployment of a 10 m high Holey-sock drogue, drifting between 5 and 15 m depth to sample a LSW mass every 6 h during its transfer to the open sea. Two deployments were performed and we followed the trajectory of the buoy for 60 and 110 h, respectively (Fig. 1a). At each station, CTD profiles of temperature and conductivity were recorded with a SeaBird 9/11+, equipped with additional sensors for fluorescence (Chelsea Aqua 3), light transmission (Seatech Wetlab Cstar) and oxygen (SBE 43). MW outside the LSW influence were also sampled. Discrete water samples were collected within the upper 50 m of the water column from 12 L Niskin bottles attached to the CTD-rosette system. Surface water (∼0.1 m) was collected with a clean bucket.
Chl a, nutrients, DOC and CDOM absorbance and fluorescence analysis. For Chl a measurements, phytoplankton was collected by filtration of 500 mL seawater through 47 mm GF/F glass fiber filters (Whatman). Pigment extraction was processed immediately on board with 90% acetone. The extract was kept for 12 h in the dark at 4°C, then centrifuged. Fluorescence properties of the supernatants were measured on a Hitachi F4500 spectrofluorometer operating in the ratio mode to determine Chl a concentrations (19,20).
Samples (60 mL in duplicate) for NO3−, NO2− and PO43− were stored at −20°C and analyzed within 1 month of collection according to Tréguer and Le Corre (21) on a Skalar auto-analyzer. Measurement accuracy was ±0.1 , ±0.02 and ±0.02 μm, respectively, for NO3−, NO2− and PO43−. Samples (40 mL in duplicate) for NH4+ were analyzed on board according to the method of Holmes et al. (22) with a Turner Designs 700 fluorometer. Measurement accuracy was ±0.05 μm.
For DOC measurements, samples were filtered through two precombusted (450°C, 24 h) 25 mm GF/F filters, transferred into precombusted glass tubes, poisoned with 85% H3PO4 (final pH = 2), closed with Teflon lined screw caps and stored in the dark at room temperature until analysis. DOC was analyzed using the high temperature catalytic oxidation technique using a Shimadzu TOC-V analyzer (23). Measurement accuracy was less than 2 μm.
Fluorescence of CDOM (filtered as above) was determined with a Perkin Elmer LS55 spectrofluorometer using a 1 cm quartz cuvette (excitation wavelength: 350 nm; emission wavelength: 450 nm). Fluorescence values were standardized with a quinine sulfate solution (1 QSU = 1 ppb quinine sulfate in 0.05 m H2SO4). Absorption of CDOM (filtered as above) at 350 nm wavelength was determined with a Hitachi U-3010 spectrophotometer using a 10 cm cuvette. Absorbance was measured against Milli-Q water as blank. Absorption coefficients a350 (m−1) were calculated as a350 = 2.303 D/L, where D is the absorbance at 350 nm wavelength and L is the pathlength of the absorbance cell in meters. a350 (m−1) has been used to quantify CDOM because it represents the middle of the UV-A region, where the overlap of the solar irradiance spectrum and aCDOM yields the highest absorption rates relative to the photobleaching (24).
Irradiance measurements. Incident solar irradiance at the surface and cosine collected downwelling irradiance underwater were measured using a GUV-510 surface radiometer and a PUV-500 submersible radiometer (Biospherical Instruments, Inc., San Diego, CA), respectively. The GUV was installed on board in a shadow-free area at ∼5 m above the water surface level and was cleaned daily. The instruments were designed to measure absolute 2π cosine UV-R irradiance values at 305, 320, 340 and 380 nm for UV-R (full bandwidth at half maximum is 8–10 nm) and 400–700 nm for PAR. The submersible unit also measures depth and temperature. A total of 11 locations were profiled under clear sky conditions within 1 h of solar noon from the stern of the ship oriented toward the sun. The underwater measurements were normalized against the simultaneous surface record to remove variations resulting from changes in cloud cover. The diffuse attenuation coefficients of downwelling UV-R (Kd) were calculated as the slope of an exponential regression between radiation and depth using three downward consecutive profiles from the surface to 30 m depth at each location. The depth at which the irradiance was reduced to 1% (Z1%) was determined manually. This procedure was preferred rather than dividing 4.6 by Kd due to the nonlog linearity of some profiles caused by the water column stratification. The water column was sampled at discrete depths for measurements of water optical properties (i.e. Chl a, DOC, CDOM absorption, CDOM fluorescence). The light exposures at each recorded wavelength and at different depths were estimated by integrating the continuous data recorded at the surface and then transforming these for each incubation depth using the derived Kd coefficient. When different Kd values were observed in the water column, the upper Kd was used to calculate the doses at the bottom of the LSW and the second Kd was used to calculate the doses in the underlying MW for wavelengths that penetrated deeper than the LSW.
Bacterial abundance and activity. Bacterial abundance (BA) was determined by flow cytometry within 2 months after sampling (15). Samples (3 mL) were preserved with formaldehyde (2% final concentration) and stored in liquid nitrogen. The samples were later thawed at room temperature, stained with a nucleic acid dye (SYBR Green I; final concentration 0.01% [vol/vol] of the commercial solution; Molecular Probes, Inc., OR) for at least 15 min at 20°C in the dark and were then analyzed at low speed (approximately 10 μL min−1) on a flow cytometer (FACSCalibur; Becton Dickinson, San Jose, CA) equipped with a 488 nm, 15 mW Argon laser. Bacteria were detected using the plot of green fluorescence versus right angle light scatter and the green fluorescence as threshold parameter. Picophytoplankton cells were detected in a plot of red fluorescence versus green fluorescence and excluded from heterotrophic bacterial counts.
Bacterial protein and DNA synthesis (BPROTS and BDNAS) were measured by [4,5-3H]-leucine (3H-Leu) and [3H-methyl] thymidine (3H-TdR) incorporations, respectively, using the microcentrifuge method (25). Samples (2.5 mL in triplicate) were added to a sterile polystyrene snap cap tube (5 mL), containing either 2 nm3H-Leu (specific activity 117 Ci mmol−1; Perkin Elmer) and 18 nm of unlabeled leucine or 15 nm of 3H-TdR (specific activity 76.2 Ci mmol−1; Perkin Elmer). One kill control was prepared for each assay by addition of 250 μL 50% trichloroacetic acid (TCA), 15 min before the addition of 3H-Leu or 3H-TdR. Tubes were incubated in the dark at 18°C for 1 h and the incorporation was then terminated by transferring replicate 1 mL samples from each tube into microcentrifuge tubes containing 100 μL of 50% TCA. Samples were stored for at least 1 h at 4°C and then centrifuged on board for 15 min at 12 000 g. The precipitate was rinsed once with 5% TCA and once with 70% ethanol. The precipitates were finally resuspended in 1.0 mL of liquid scintillation cocktail (FilterCount; Perkin Elmer) and radioactivity determined by the liquid scintillation counter (LS 5000CE Beckman).
Impact of UV-R on NCP and BPROTS and BDNAS at different depths. Water samples were collected before sunrise at 5 m depth at two stations (different dates) situated inside and outside the influence of the LSW. NCP and community respiration (CR) were determined by change in dissolved oxygen concentration during 24 h incubations (13). All measurements were analyzed in triplicate. Before use, the biological oxygen demand (BOD) bottles were washed with 10% HCl and rinsed three times with Milli-Q water. Water samples were carefully siphoned to 125 mL gravimetrically calibrated BOD bottles. A total of 30 BOD bottles were allowed to overflow ∼3 times the volume of the bottle, ensuring that no bubbles remained in the bottles, and capped free of headspace with ground glass stoppers. Winkler reagents were added to three bottles to measure the initial oxygen content present in the samples (see below). Two light treatments were considered for NCP: (1) Full sun treatment-unfiltered samples in quartz BOD receiving full solar radiation (280–700 nm) and (2) PAR treatment samples in borosilicate BOD covered with Courtgard film to remove UV-R (see Supporting Information Fig. S1 for light transmission of Courtgard). CR was determined by incubating triplicate samples in the dark in borosilicate BOD bottles covered with aluminum foil. For the determination of NCPFull sun and NCPPAR, BOD bottles were incubated on deck in an outdoor water bath where temperature was controlled by a continuous surface seawater flow (surface incubation at 0.1 m depth, temperature 17–19°C). The other bottles were placed at three different depths (2, 5 and 8 m) in the water column by fixing the BOD on metal frames (1.2 × 0.7 m) fixed along separate mooring lines to maintain horizontal positioning during incubation. BOD bottles for CR determination were only incubated at 5 m depth assuming that differences in temperature at the different depths (<2°C) had negligible effect on CR. After 9–10 h incubation in light or dark, all BOD bottles were recovered and dark incubated in the outdoor water bath for an additional 14–15 h period. After the total 24 h incubation period, the BOD bottles were fixed with Winkler reagents and stored underwater at ∼18°C. The oxygen concentration was analyzed within 24 h after fixation. The total iodine was determined spectrophotometrically in three runs on a Hitachi U-3010 spectrophotometer with a four-digit readout, using a 1 cm flow through cuvette (26). Samples were withdrawn from the BOD bottles by a sipper system. Measurements were recorded in a temperature-controlled laboratory container set at 20°C. The average coefficient of variation of the O2 concentration measurements in the zero, dark and light bottles was 0.22%. NCP and CR were calculated from the difference between the averages of the replicate light and dark-incubated bottles and zero time analyses. Gross primary production (GPP) was calculated as the sum of CR and NCPFull sun or NCPPAR.
For BPROTS and BDNAS measurements, a set of 50 mL tubes, previously washed with 10% HCl and rinsed three times with Milli-Q water and then by sample water, was filled with the water sample. As for NCP, two light treatments were incubated in triplicate (i.e. Full sun and PAR treatments) using quartz or borosilicate tubes with or without Courtgard film. These tubes were incubated at the same depths as the BOD bottles for NCP determination and a set of three tubes covered with aluminum foil (dark control) was also incubated at 5 m depth. At the beginning of the incubation and again after the 9–10 h exposure period, BPROTS and BDNAS were determined.
UV-R sensitivity of different bacterial assemblages. Water samples from 0.1, 5, 10 and 20 m were collected before sunrise in LSW. After prefiltration onto 1.2 μm polycarbonate membranes (142 mm diameter; Nuclepore) at low pressure to remove phytoplankton and protozoa, samples were placed in 50 mL sealed tubes to study three light treatments (triplicates for each treatment): (1) Full sun, (2) PAR and (3) Dark, as described above. The tubes were incubated on the deck in the recirculating bath and exposed to natural solar radiation for 6.5 h (centered on local noon). At the end of the incubation, BA, BPROTS and BDNAS were measured in each tube.
Determination of the combined effects of nutrients and solar radiation on BPROTS. Water samples from the LSW and the MW were collected at the end of the afternoon at different dates and in different locations. Phytoplankton and protists were removed by filtration through polycarbonate 1.2 μm pore size filters (142 mm diameter; Nuclepore), and the resulting filtrate was distributed among two 10-L Nalgene containers previously cleaned with HCl 10% and rinsed with Milli-Q and the filtered sample. One carboy was enriched with NO3− (6 μm final concentration), NH4+ (2 μm final concentration), PO43− (0.5 μm final concentration) and glucose (1 μm final concentration). All nutrient stocks were sterilized by autoclaving or by filtering (glucose solution) and stored at −20°C before use. The containers (unamended and with nutrients) were then dark incubated for 12 h in the outdoor water bath. Before sunrise of the following day, 50 mL tubes were filled with water from each treatment to study Full sun and dark treatments in triplicate. The incubations started during early morning on the deck in a flowing seawater bath. After 10 h exposure, each tube was sampled to measure BPROTS (T1), and then reincubated in the dark in the outdoor water bath for an additional 12 h period, before sampling again to measure BPROTS and BA (T2).


Negative values indicate inhibition, whereas positive values indicate stimulation. Mann–Whitney U-tests were also used to determine statistically significant (P < 0.05) differences in (1) the percentages of BPROTS and BDNAS inhibitions induced by solar radiation (relative to dark treatment) for the bacteria coming from the different depths (0.1, 5, 10 and 20 m), and (2) the percentage of BPROTS inhibition induced by solar radiation (relative to dark treatment) with or without nutrient addition. For each condition tested, nine values of BPROTS and BDNAS inhibition were obtained by operating multiple combinations between the triplicate measurements for Full sun (or PAR) treatment and those for the dark treatment.
Results
UV penetration in LSW and MW
During the experiment, the daily Rhône River flow ranged from 1239 to 2292 m3 s−1 (1756 m3 s−1 in average), with a 3 day peak discharge over 2200 m3 s−1 from 20 to 22 May. Southwestward of the River mouth a large dilution zone was associated with high surface Chl a as shown by the MODIS satellite image (Fig. 1b). Typical vertical profiles of salinity, temperature, DOC, Chl a concentration, BA, BPROTS and cell-specific activity (CSA = BPROTS/BA) in the MW (station S1) and in the LSW (station S152) are shown in Fig. 2. For all stations inside the LSW lenses, the upper layer (0–6 m) was characterized by lower salinity (from 30 to 37.8), higher temperature (up to 18.5°C) and higher DOC concentration (up to 90 μm) than MW (salinity 38.2, temperature 16°C, ∼70 μm DOC). The LSW was also characterized by strong vertical gradients of Chl a and BPROTS from the surface down to 10 m depth. For both parameters, the values measured at the surface of the LSW were up to 10-fold higher than those measured in MW. Slightly higher BA values were also observed in the LSW but without vertical stratification as for the other parameters. However, CSA was ∼3-fold higher in LSW compared to MW.
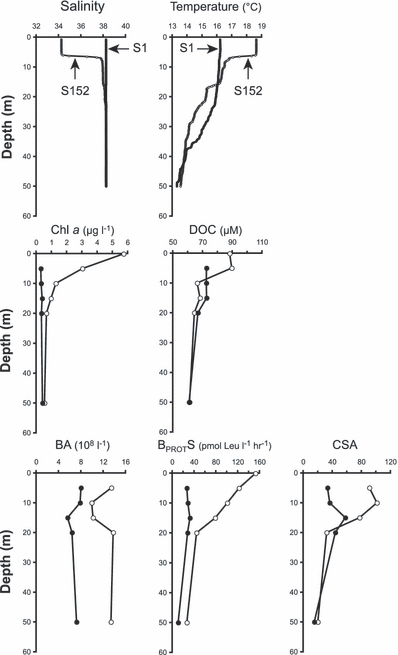
Typical vertical distributions of salinity, temperature, DOC, Chl a concentration, bacterial abundances (BA), protein synthesis (BPROTS) and cell-specific activity (CSA = BPROTS/BA in zmol leu per cell h−1, zmol = 10−21 mol) for a marine station (closed circles, station S1, 14 May) and a station in the LSW (open circles, station S152, 22 May).
The light profiles obtained in MW and LSW showed distinct patterns (Fig. 3). Whereas the UV-R attenuation in MW was constant in the water column, there was often a sharp break in the vertical attenuation at the transition between the LSW (0–10 m) and the MW. In those cases we calculated a Kd for both the LSW and the MW (see Table S1 for details of Kd and optical properties). Due to the high attenuation, no values for Kd 305 nm could be determined below the LSW. The mean ratio of the Kd measured in the LSW and those measured in the MW (below the LSW and outside the LSW influence) increased with wavelengths from 2.4 at 305 nm to 2.9 at 380 nm, and it was equal to 3.1 for PAR. The mean Z1% at 305 nm (UV-B) decreased from 13 m in MW to 6 m in the LSW. At 340 nm (UV-A) these values were 25 and 10 m, respectively, and for the PAR they were 56 and 38 m, respectively. Consequently most of the UV-R is absorbed in the LSW, whereas PAR is able to penetrate deeper than the LSW.
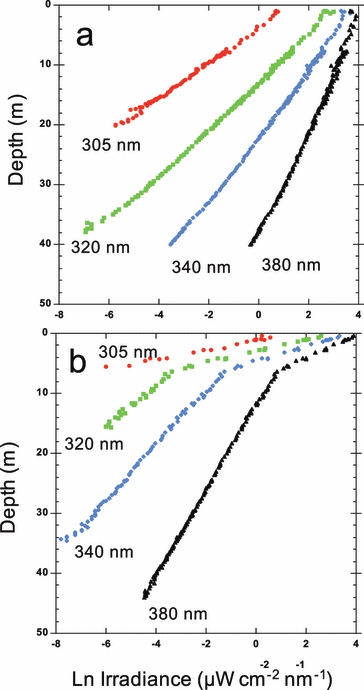
Profiles of downwelling UV irradiance against depth for (a) one marine station (station S1, 14 May) and (b) one station in the LSW (station S16, 15 May).
The Kd at 340 nm was chosen to illustrate the relationship between UV attenuation and the optical properties of the LSW and MW (Fig. 4). The other nominal UV wavelengths and PAR measured with the PUV radiometer led to similar conclusions. We found a strong negative linear correlation between Kd and light transmission (r2 = 0.89, P < 0.0001). A similar, but positive, linear correlation was observed with Chl a concentration (r2 = 0.87, P < 0.0001). Other variables such as DOC, absorption of CDOM at 350 nm (a350) and fluorescence of CDOM (F) gave weaker correlations (r2 = 0.55, 0.29 and 0.51, respectively; P < 0.05). The mean ratios of average values between LSW and MW were 0.73 for light transmission, 5.6 for Chl a, 1.6 for a350, 1.4 for F and 1.2 for DOC.
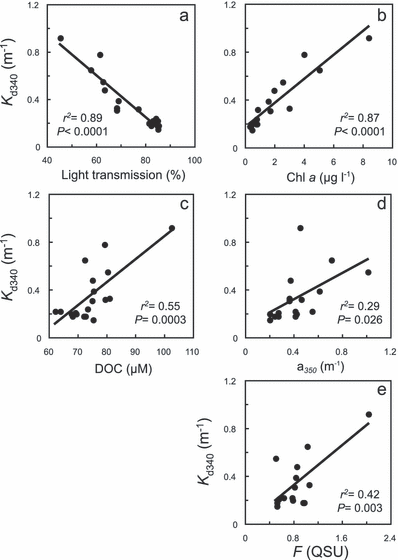
Plots of diffuse attenuation coefficients measured at 340 nm (Kd340) against (a) light transmission, (b) Chl a concentration, (c) DOC, (d) CDOM absorption and (e) CDOM fluorescence.
Impact of UV-R in the water column on bacterial activities and NCP
The impact of UV-R on BPROTS, BDNAS and NCP was studied in both LSW and MW for samples collected at 5 m depth and incubated in situ at four different depths (0.1, 2, 5 and 8 m) (see Table S2 for the details of the samples characteristics). Due to differences in the light attenuation between the two environments, large differences were observed in the UV-R and PAR exposures at the different incubation depths (see Table S3 for details of the light doses at different depths). The vertical distribution of NCP measured under PAR in LSW was homogeneous from the subsurface to 8 m with ∼13 μmol O2 L−1 day−1 (Fig. 5a). The CR was 5.5 ± 1.0 μmol O2 L−1 day−1, leading to a GPP of ∼18.5 μmol O2 L−1 day−1. When samples were additionally exposed to UV-R, a significant inhibition (90%) of NCP was observed at the surface (0.1 m). At 8 m depth (i.e. under low light) we measured a stimulation of NCP by 35% under Full sun relative to PAR that may result from the small absorption of PAR by the Courtgard foil (∼15%). In MW the NCP measured under PAR was homogeneous for the different depths of incubation and equaled ∼2.2 μmol O2 L−1 day−1 (Fig. 5b). CR was 18-fold lower than that measured in the LSW, leading to a GPP of ∼2.5 μmol O2 L−1 day−1. No effect of UV-R was observed on NCP even at the surface.
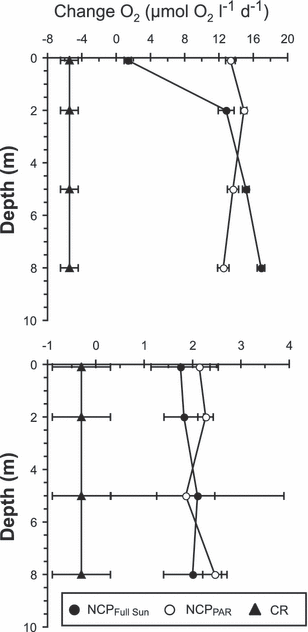
Vertical distribution of net community production measured under Full sun radiation (NCPFull Sun) or PAR (NCPPAR), and dark community respiration (CR) (mean ± 1 SD, n = 3) for samples collected at 5 m depth and incubated in situ at four depths (0.1, 2, 5 and 8 m) in (a) low salinity waters and (b) marine waters. CR measured at 5 m depth was reported for the other depths considering that dark incubation would be independent of depth.
As for the NCP, the BPROTS and BDNAS in the LSW were only inhibited by UV-R at the surface by 52% and 68%, respectively (Fig. 6a). In contrast, in MW we measured an inhibition by UV-R relative to dark treatment up to 5 m depth for BPROTS and up to 8 m depth for BDNAS (Fig. 6b). Inhibitions were maximal at the surface and at 2 m depth reaching 63% for BPROTS and 77–87% for BDNAS. No significant differences in BPROTS and BDNAS were observed between PAR and dark incubations for both LSW and MW at any depth (except at 8 m depth where PAR inhibited by 19% BDNAS). Based on integrated values (0–8 m), BPROTS and BDNAS inhibitions due to UV-R were 36% and 55%, respectively.
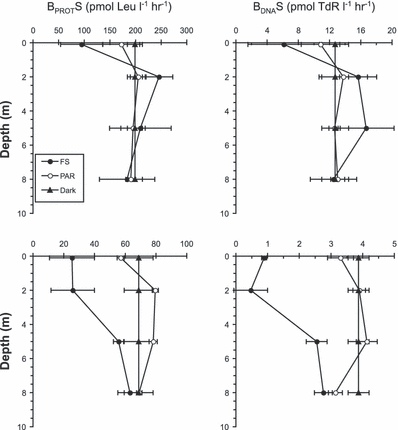
Vertical distribution of bacterial protein (BPROTS) and DNA (BDNAS) synthesis (mean ± 1 SD, n = 3) for samples collected at 5 m depth and incubated in situ at four depths (0.1, 2, 5 and 8 m) with different light treatment in (a) low salinity water and (b) marine waters. BPROTS and BDNAS measured after dark incubation at 5 m depth was reported for the other depths assuming that dark incubation would be independent of depth.
Impact of UV-R on bacterial assemblages from different depths
In order to study the sensitivity to UV-R of bacterial assemblages collected from the surface to 20 m depth in the LSW, we exposed all these samples to the surface solar radiation and then compared the BPROTS and BDNAS in exposed and dark-incubated samples. The main characteristics of these water samples are given in Table S2. As shown in Fig. 2, these water samples showed large differences before the exposure in their BPROTS associated with the salinity gradient (Table S2). After incubation in the dark, the same relationship was always observed between the samples, but the BPROTS and BDNAS values were higher, possibly due to the absence of predators that we removed by filtration and/or the effect of confinement (Fig. 7). PAR exposure had no effect for both BPROTS and BDNAS as previously observed after incubation at different depths, whereas exposure to Full sun induced significant inhibition for all samples. Percentages of BPROTS and BDNAS inhibition due to UV-R relative to dark samples ranged from 45% to 67% and from 47% to 74%, respectively. We observed significant differences (P < 0.05) in BPROTS and BDNAS inhibition between the samples in order: 20 m > surface > (5 and 10 m). BA was significantly reduced (P < 0.05) between 13% and 18% by Full sun but not by PAR relative to dark treatment for all samples with the exception of the sample from 10 m depth (data not shown).
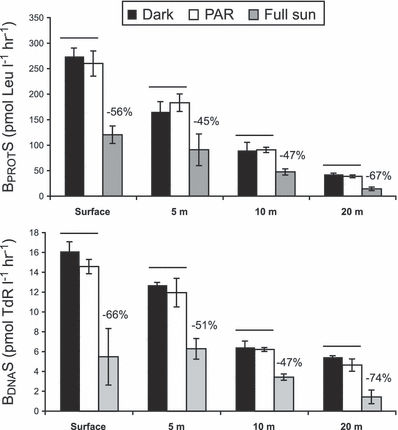
Reduction in bacterial protein (BPROTS) (a) and DNA (BDNAS) (b) synthesis (mean ± 1 SD, n = 3) for waters sampled at different depths and exposed to the same surface solar radiation (details of the initial water characteristics are given in Table S2). Horizontal bars indicate light treatments that did not differ significantly (P > 0.05) within a water sample (Mann–Whitney U-test). Percentages of inhibition relative to dark treatment are reported above the treatments that differed significantly.
Effects of nutrient addition on bacterioplankton sensitivity to UV-R
The objective of this third series of experiments was to test the effect of nutrients (N, P) and organic carbon additions on the response of bacteria exposed to solar radiation. This addition simulated a possible change in the inorganic nutrient and DOC concentrations carried by the Rhône River. Based on the concentration of nutrients measured in the waters, the enrichment factors were 33–67, 0–46 and 2.3 to >25 for NH4+, NO3− and PO43−, respectively. Subsequent experiments confirmed that inorganic phosphorus was the main limiting element for both MW and LSW (data not shown), in agreement with the nutrient analyses of these waters that showed a complete depletion of this element in most of the samples (Table S2). For the LSW (experiments 1, 2 and 4), the nutrient addition increased BPROTS relative to unamended samples (using dark incubation for calculations) by a factor of 2.5 ± 0.7 and 2.0 ± 0.8 at T1 and T2, respectively (data not shown). These factors were higher for the MW (experiment 3), with values of 16.8 and 3.3 at T1 and T2, respectively (data not shown), suggesting a more severe nutrient limitation for bacteria in these waters.
Despite the different origins and characteristics of the waters used in experiments 1, 2 and 3 (Table S2), we found a similar pattern of responses to light exposure regarding nutrient addition (Fig. 8). At T1, we observed a higher inhibition induced by light for the samples enriched with nutrients relative to unamended samples. At this time, the mean ratio of inhibition between the two types of samples was 2.2 ± 1.0. At T2, after the dark repair, we observed a complete recovery of the BPROTS for unamended samples, whereas for samples enriched with nutrients we observed a net stimulation of BPROTS induced by the previous exposure to sunlight. At this time the mean ratio of BPROTS stimulation between the two treatments was 22.8 (±7.9). For experiment 4 (surface of LSW), we did not observe a significant difference between the inhibition measured for control and nutrient-enriched samples at T1. Inhibition at this time was also low (∼20%) compared with the other experiments and may be due to the lower incident irradiance during this day (Table S3) and greater attenuation by these water samples. However, at T2, we observed a pattern similar to the other experiments with a ratio of 16.7 between the BPROTS stimulation of both conditions. For the different experiments without nutrient addition, BA at T2 was either significantly reduced by sunlight exposure (by 26% and 48% for experiments 1 and 3, respectively) or unchanged (experiments 2 and 4) relative to dark samples (data not shown). With nutrient addition, BA at T2 was either significantly increased by sunlight exposure (by 55% for experiment 3) or unchanged (experiments 1, 2 and 4) relative to dark samples (data not shown).
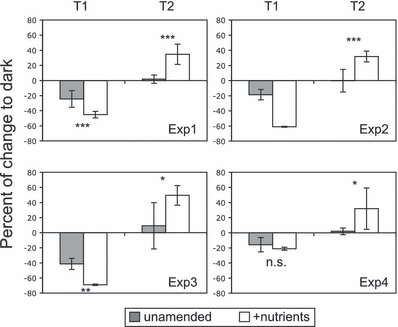
Effect of solar radiation on bacterial protein synthesis (BPROTS) for unamended (control) and nutrient-enriched samples in four different experiments (details of the initial water characteristics are given in Table S2). Results are expressed as percentages (mean ± 1 SD, n = 9) of the BPROTS between samples exposed to Full sun radiation relative to samples maintained in the dark, at sunset (T1) and after the morning of the following day (T2). Asterisks indicate light treatments that differed significantly within one incubation period, where *P < 0.05, **P < 0.01, ***P < 0.001 (Mann–Whitney U-test). n.s. = not significant.
Discussion
UV penetration in the MW under the influence of river input has been very little studied. To our knowledge the only study was performed by Farmer et al. (11) in the Caribbean Sea on the influence of the Orinoco River plume. Interestingly, these authors observed a sharp break in the attenuation of UV-R in the river plume during high river flow similar to our observations for the LSW of the Mediterranean Sea. Considering the higher correlation observed between the Kd and the light transmission or the Chl a concentration than for DOC or CDOM absorption and fluorescence (Fig. 4), it can be considered that UV-R attenuation was mainly driven by particulate rather than dissolved matter. It is difficult to make conclusions on the relative effect of detrital and living particles on UV-R attenuation as similar regression coefficients were obtained with light transmission (a proxy of nonfluorescent particles) and Chl a (a proxy of the phytoplankton biomass). However, it can be noticed that Kuwahara et al. (27) reported that during spring bloom, the phytoplankton pigments were the largest contributors to the attenuation of UV-R and PAR in coastal waters of Japan. For the other periods, CDOM was the highest absorbing fraction for UV-R. The bio-optical factors contributing to the attenuation of UV-R in the LSW of Gulf of Lions could also vary seasonally, depending on the river flow (11) and the hydrodynamic conditions that may influence phytoplankton growth and concentration of CDOM (28).
The high Chl a concentrations measured in the LSW were accompanied by a high NCP. It is not surprising to observe that the photosynthetic processes dominate over heterotrophic processes in the LSW at this period of the year as has been observed for the Mississippi River plume during most of the year except winter (29,30). We observed that UV-R has a strong inhibitory effect on NCP at the surface of the LSW. This effect could be overestimated by the interference of the oxygen consumption due to photochemical degradation of DOC (31). To estimate the error on NCP related to photochemical degradation, we used the data obtained by Obernosterer and Herndl (32) and Obernosterer et al. (33). These two studies were conducted in coastal waters of the Mediterranean Sea (northern Adriatic Sea and Gulf of Lions) in summer, and they reported a photochemical oxygen consumption of ∼5–30 nmol O2 [μm DOC]−1 day−1. Based on the highest estimation, the photochemical oxygen consumption in our study would be 2.4 μmol O2 day−1. Consequently, most of the decrease in NCP (∼80%) can be attributed to photoinhibition of photosynthesis by UV-R rather than photochemical oxygen consumption. Depression of O2 production in surface samples using quartz BOD has been observed previously in the Arabian Sea and was attributed also to inhibition of photosynthesis by UV-R (34). Furthermore, inhibition of NCP by UV-R may have been overestimated because phytoplankton in natural conditions are not likely to remain at the surface for extended periods of time due to thermal mixing. Finally, inhibition of NCP may have also been overestimated because the phytoplankton from the 5 m depth that we used for the experiments was less photoacclimated to high UV-R than surface phytoplankton. However, the density gradient measured inside the LSW along the trajectories seems to indicate that mixing occurred that might have prevented the development of a specific photoacclimatation at the surface of the LSW lenses. Even if the effect of UV-R on NCP appeared to be restricted to the surface, a modification of the net autotrophic metabolism at the top centimeter of the water column could have an influence on the air–sea exchange of CO2 (35). In contrast to the LSW, NCP in MW was not affected by UV-R even at the surface. This does not necessarily indicate an absence of effect of UV-R on plankton and DOM, because the relative increase in photochemical oxygen demand and the photoinhibition of phytoplankton might be balanced by an inhibition of oxygen consumption by the different heterotrophic organisms (mainly bacteria).
Studies on the inhibition of bacterial activities by UV-R at different depths in MW are scarce compared to phytoplankton and focus mainly on coastal waters. Here, we observed that UV-R inhibited both BPROTS and BDNAS down to 8 m in the clear coastal MW but only at the surface in the LSW. An inhibition of BPROTS and BDNAS by solar radiation down to 10 and 15 m was measured in tropical coastal waters and the Gulf of Mexico, respectively (7,36). In both cases the waters showed a higher UV-R transparency than the MW that we studied here. By comparing three stations in a large coral reef lagoon, Conan et al. (37) determined that BDNAS inhibition due to UV-R was significant down to 4 or 8 m depending on the transparency of the waters. UV-R attenuation is certainly the major factor determining the importance of its impact on BPROTS and BDNAS in the water column as can be seen in this study. However, this does not preclude that other factors, like community composition and nutrient status, may also affect the response of bacterial communities to UV-R.
We tested the sensitivity of the bacterial communities present in the LSW and in the MW to UV-R by exposing them to the same solar radiation. Our results indicate that the deeper bacterial community present in MW was more sensitive to UV stress than the surface bacterial community from the LSW. This conclusion contrasts with those obtained by others using similar transplant approaches to study the sensitivity of bacterial communities collected at different depths to full surface exposure. In a productive upwelling zone in Chile, Hernández et al. (10) observed a 75% inhibition of BPROTS for surface waters (0.5 m), whereas a ∼25-fold enhancement of BPROTS was observed for the bacterial community sampled below the photic layer (80 m) exposed to the same conditions. Xenopoulos and Schindler (38) observed also that after a short exposure to solar radiation (4 h) the bacterial community from the surface (0.25 m) of two boreal lakes was more sensitive than communities from the base of the mixed layer (∼3 m). However, after a longer incubation (2 days), bacteria from the surface responded positively more frequently to UV radiation than those from deeper samples. Finally, Herndl et al. (39) found that bacteria below the euphotic zone (20 m depth) were as sensitive to UV-R as bacteria present at the surface (0.5 m depth) in the Adriatic Sea. Indeed, the comparison of these different studies is not obvious, because the response of a bacterial community to UV-R is the result of complex interactions between different factors, including the specific sensitivity of bacterial species (40–42), the presence of phytoplankton (7,43,44), the quality of the DOM (45), the nutrient status of bacteria (44,46) and the vertical mixing (47). The analysis of the bacterial diversity by 16S rDNA and rRNA fingerprintings (48) during the BIOPRHOFI cruise did not reveal large differences in the community composition of free-living bacteria (i.e. <1.2 μm) present from 5 to 50 m depth at different stations of the LSW (J.-F. Ghiglione, personal communication). We took care to exclude the phytoplankton from our incubations to avoid any interaction with bacteria via the production of fresh DOC released from algae thereby generating differences between the samples. However we did not investigate the possible effects of the photodegradation of DOM on bacterial activity in the short term of these incubations. It is possible that LSW contained a higher concentration of fresh DOM originated from the phytoplankton, but also a higher concentration of refractory DOM from the river water compared to the MW. We know that photodegradation of DOM may have contrasting effects on the bacterial activity depending on its source (45) and further studies are required to address the photoreactivity of DOM present in LSW.
Our results concerning the effect of the nutrient status on the response of bacteria to UV-R indicate that bacteria growing faster after stimulation by nutrients are more sensitive to solar radiation. Faster replicating DNA may be more sensitive to UV-R damage (both direct or indirect through ROS). For the enriched samples first exposed to solar radiation, the better recovery of BPROTS may be explained by the energy requirements for nucleotide excision repair (“dark repair”) mechanisms, and the net stimulation of BPROTS by the facilitated use of the small organic molecules from DOM photodegradation in the presence of inorganic nutrients (especially phosphorus in our case) added to the samples (49). The interactive effect of nutrient limitation and UV-R on aquatic bacteria has been less studied than for phytoplankton. Kaiser and Herndl (50) observed that bacterial inhibition induced by artificial sources of UV-B was higher in freshly collected seawater than in aged seawater where bacteria were less active, but recovery under photoreactivating UV-A was greater for the more active bacteria present in freshly collected seawater. These results are not easily comparable to ours, because in our case both damaging UV-B and repairing UV-A were present during exposure to natural sunlight. In contrast to our results, other studies reported that the sensitivity to UV-R of P-deficient bacteria was reduced by an increase in inorganic P availability (44,46,51). This result was obtained independently of the presence or absence of phytoplankton (44). Contrasting results have also been observed for phytoplankton, with a favorable effect of nutrient stress (e.g.52) or detrimental effect when combined with UV-B stress (e.g.53). Clearly, further studies are needed to better understand the complex interactions between nutrient and UV-R stress on bacteria, by monitoring both changes in bacterial activity and diversity and by considering different environments with variable nature of limitations (e.g. carbon, nitrogen, phosphorus).
In conclusion, we observed a rapid attenuation with depth of UV-R in LSW, which was mainly explained by the higher phytoplankton biomass. This leads to a low impact on NCP, BPROTS and BDNAS except at the surface, where they were inhibited by 90%, 52% and 68%, respectively. In MW, NCP was not affected by UV-R whereas BPROTS and BDNAS were impacted down to 8 m depth. In both environments, PAR had no significant effect (positive or negative) on BPROTS and BDNAS. Differences in the effect of UV-R on BPROTS and BDNAS between the two environments were mainly due to differences in UV-R attenuation, but differences in sensitivity of bacterial assemblages might also play a role, given that bacteria from the LSW were less sensitive to UV-R than those from MW. Nutrient limitation exerted by phosphorus in both environments seems to play a protective role during exposure to UV-R, but a negative role during the night period by limiting the repair in bacteria. Nutrient limitation might also reduce the use of bioavailable organic carbon produced by photodegradation of DOM.
Acknowledgements— This work was supported by the projects BIOPRHOFI within the framework of the French Programme National d’Environnement Côtier (PNEC), ATIPE (“Response of marine bacteria to UV-R”) and UVECO (“Induction of microbial community responses and dissolved organic matter transformation by UltraViolet radiation in marine ECOsystems”) supported by the CNRS-INSU. This study was also funded through a PhD grant from the Syrian Atomic Energy Commission to M.A. and a National Science Foundation Office of International Science and Engineering U.S-France Cooperative Science Program grant 0340764 to W.H.J. We thank the captain and the crew of the R/V Le Suroît for their assistance in field sampling and C. Courties for providing BA showed in Fig. 2. We also acknowledge the reviewers for their thoughtful and constructive comments.


